-
-

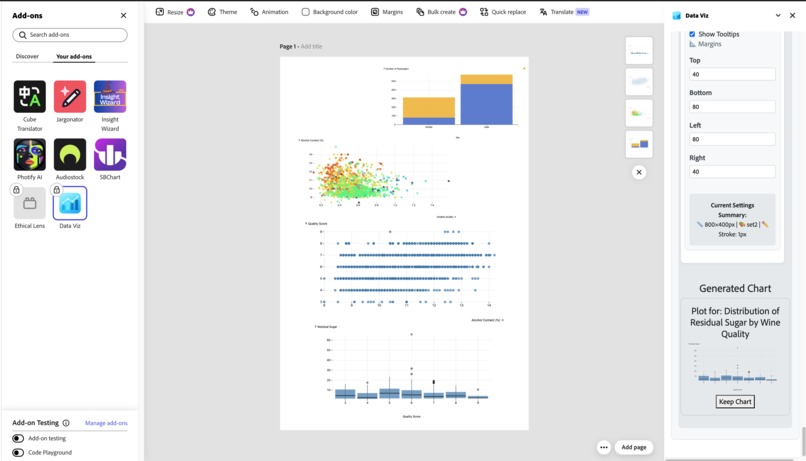
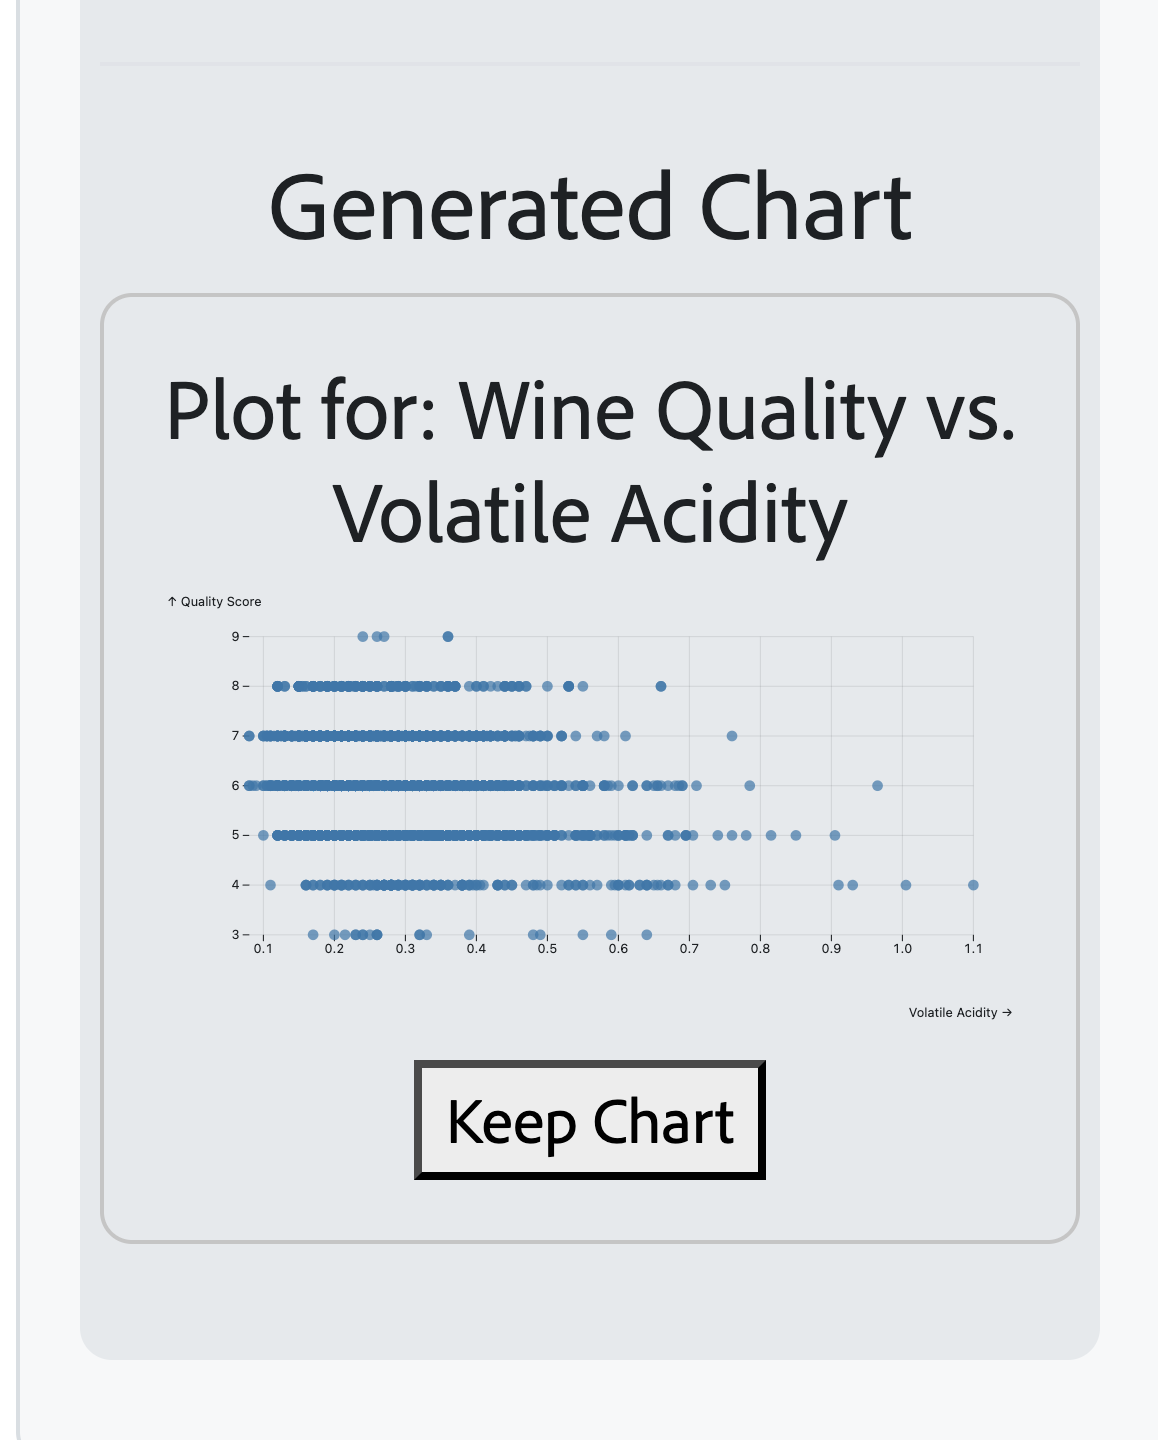
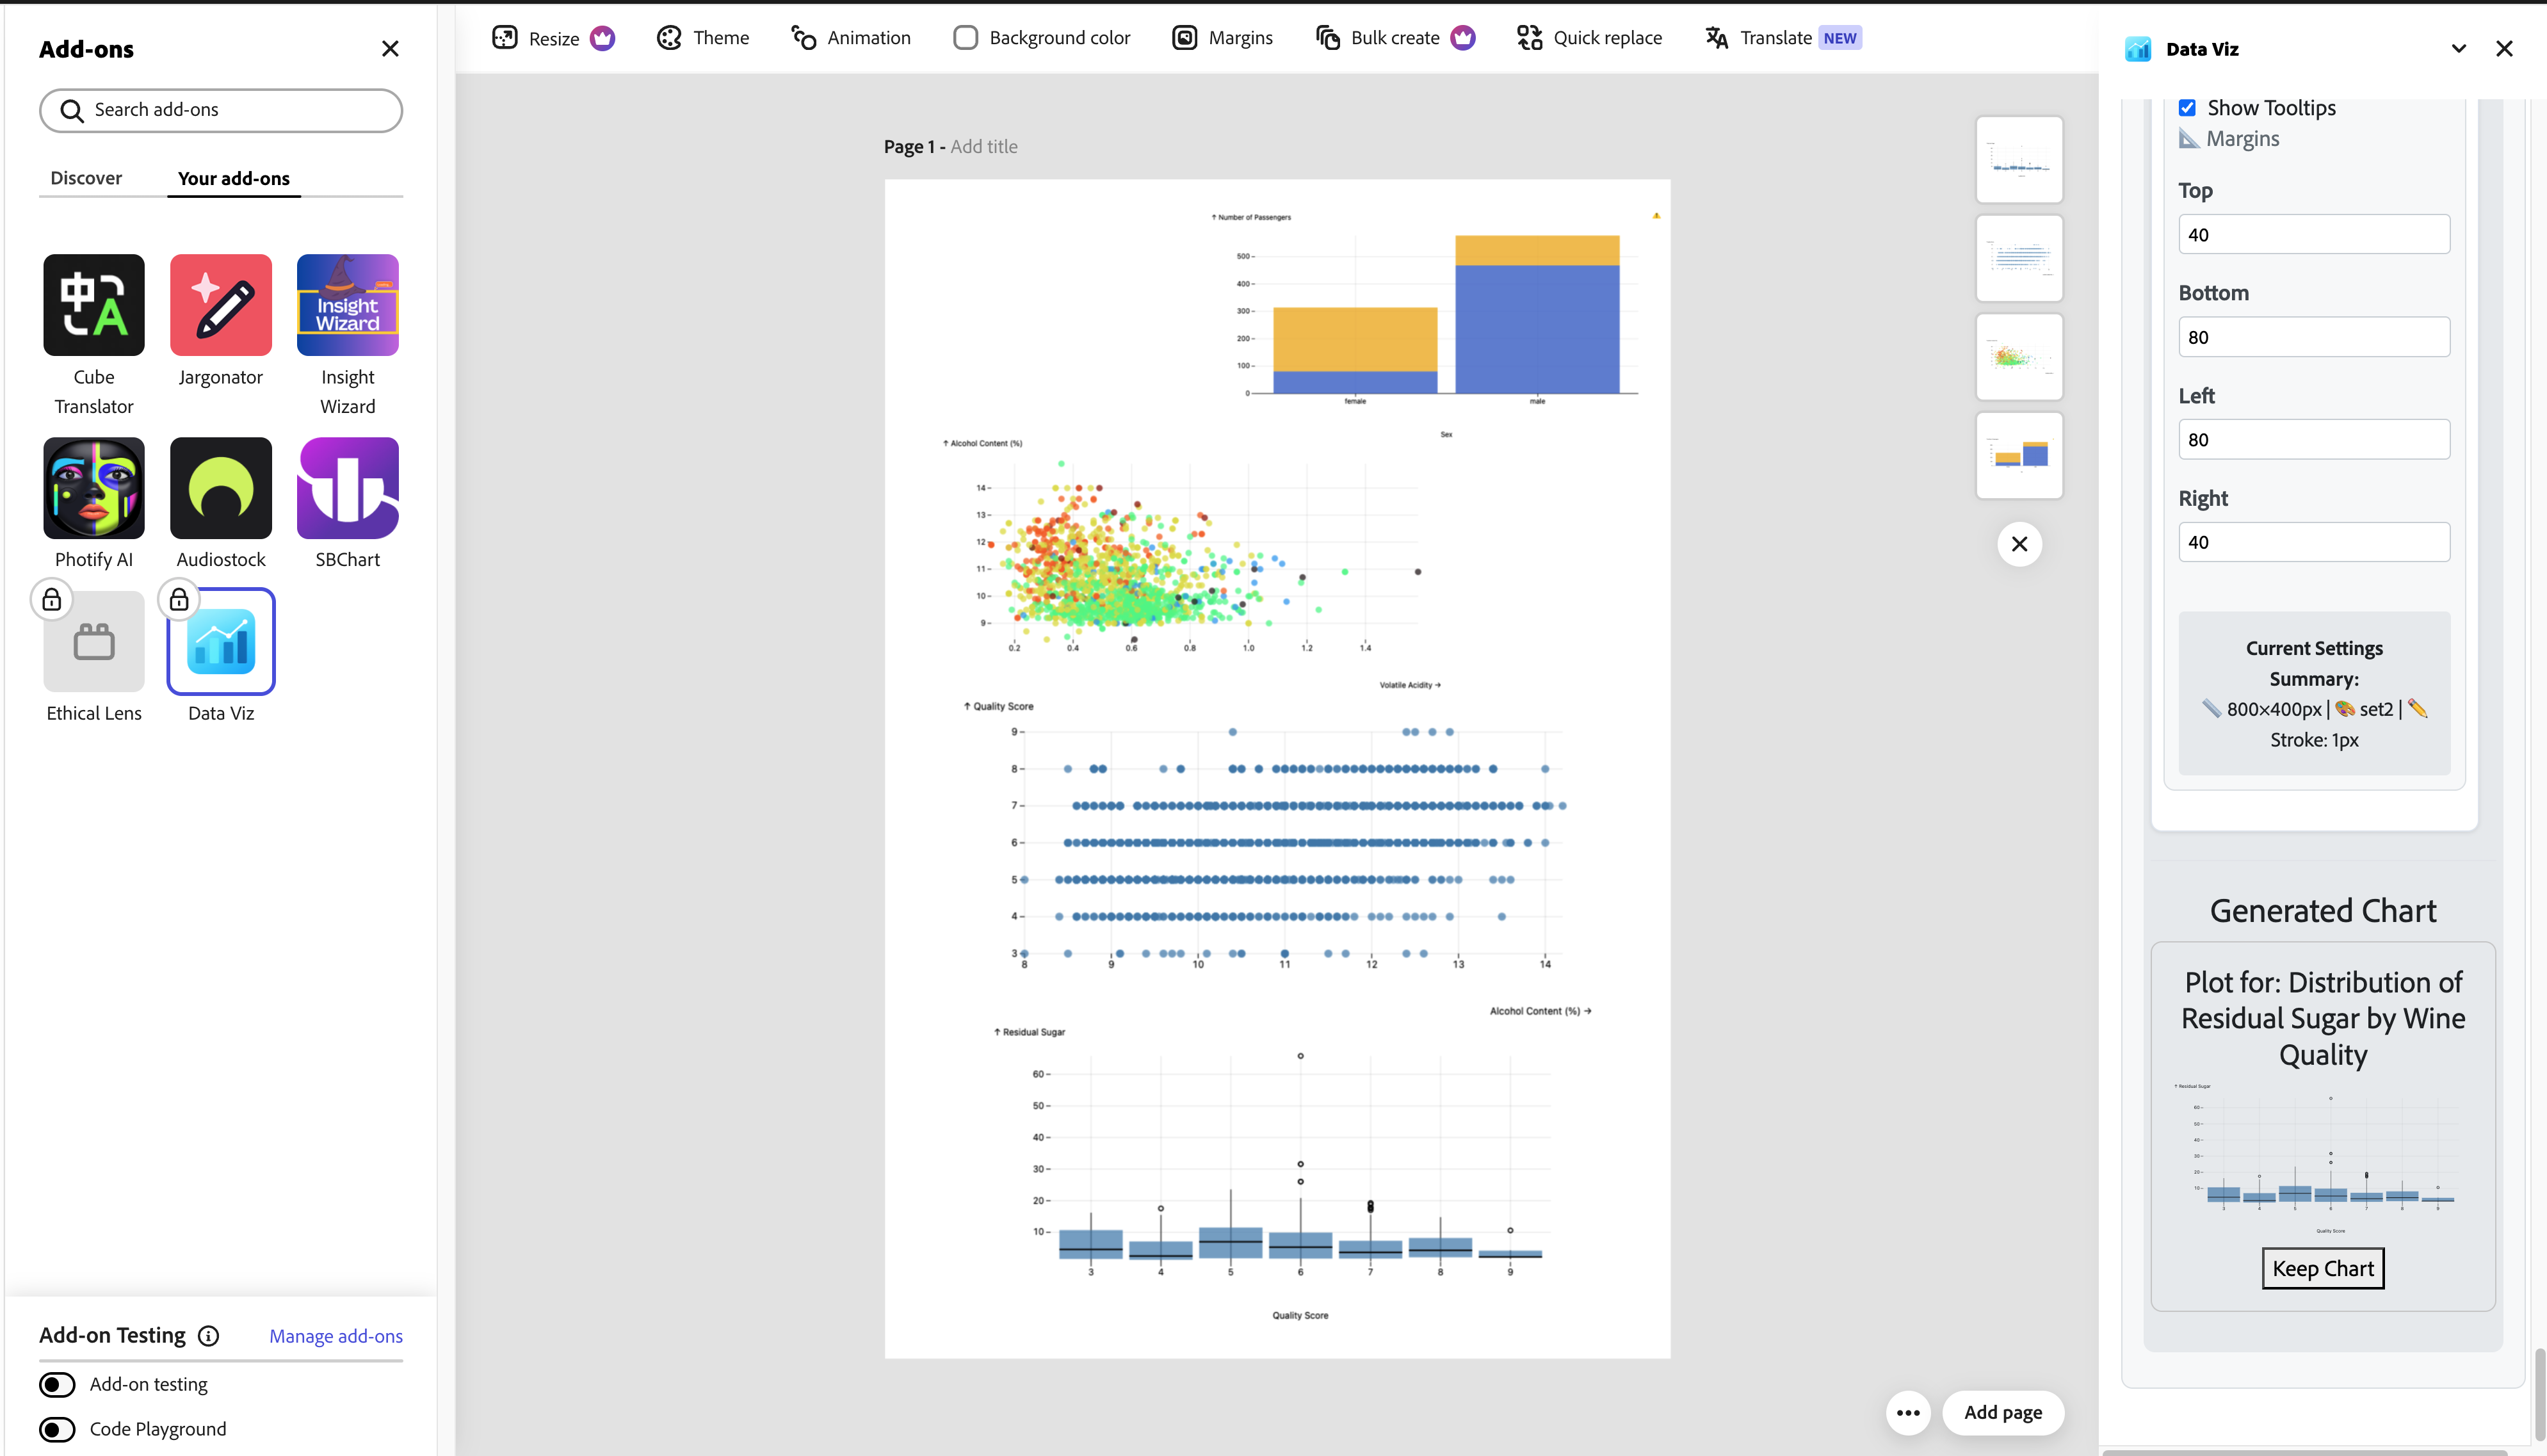
more plots
-
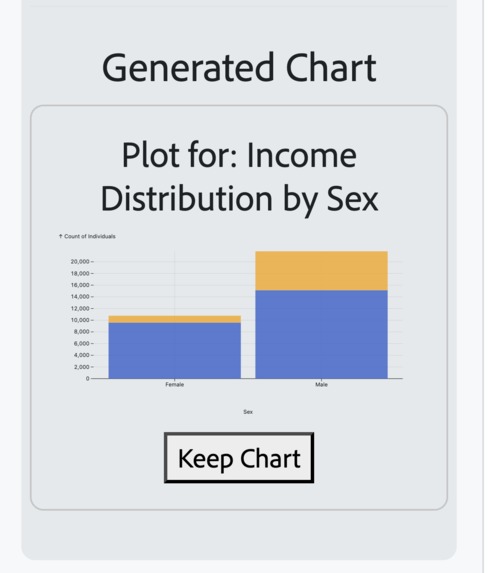
bar plolt
-

bar plot
-
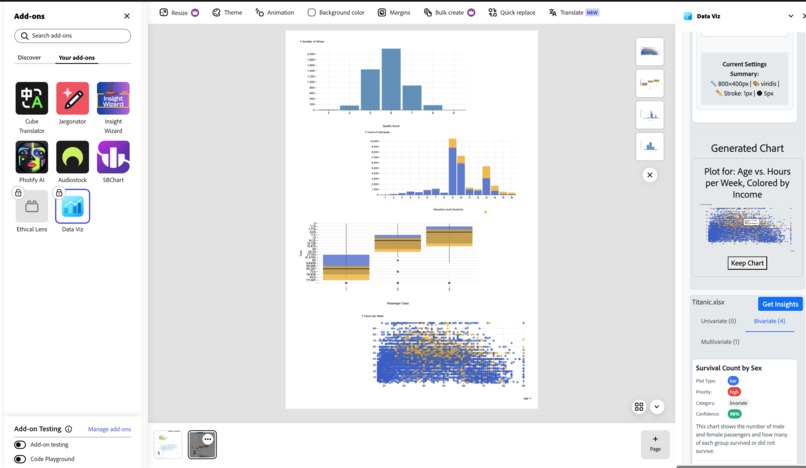
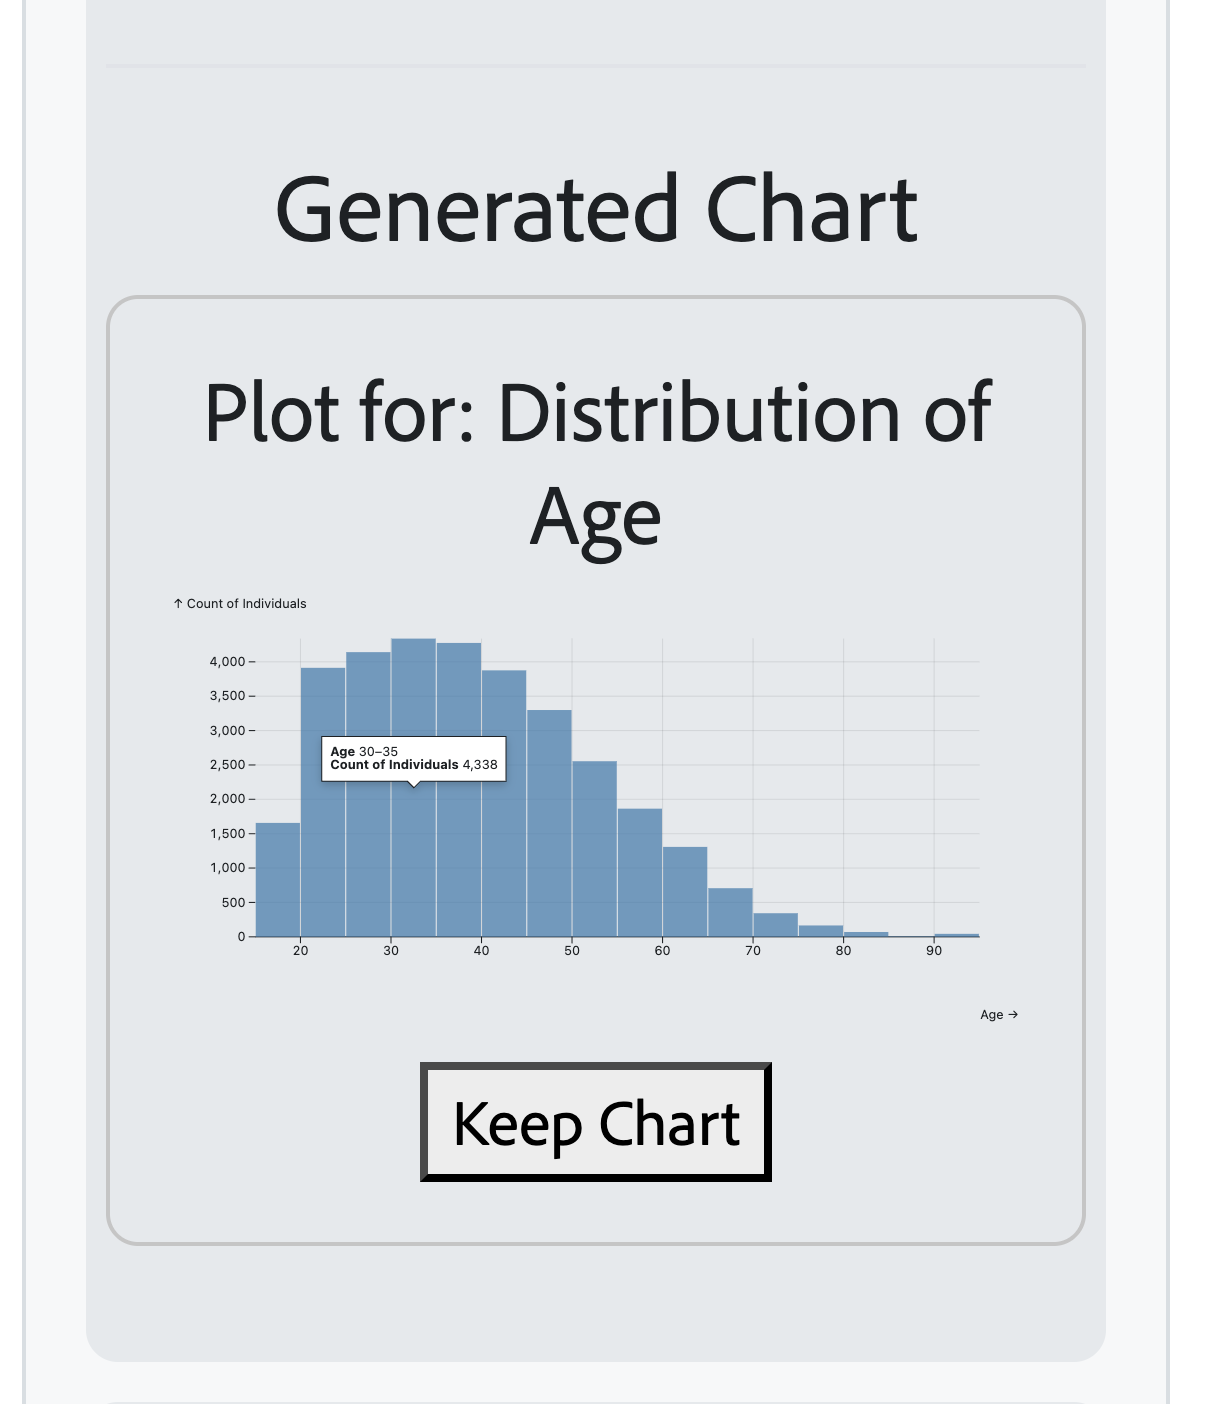
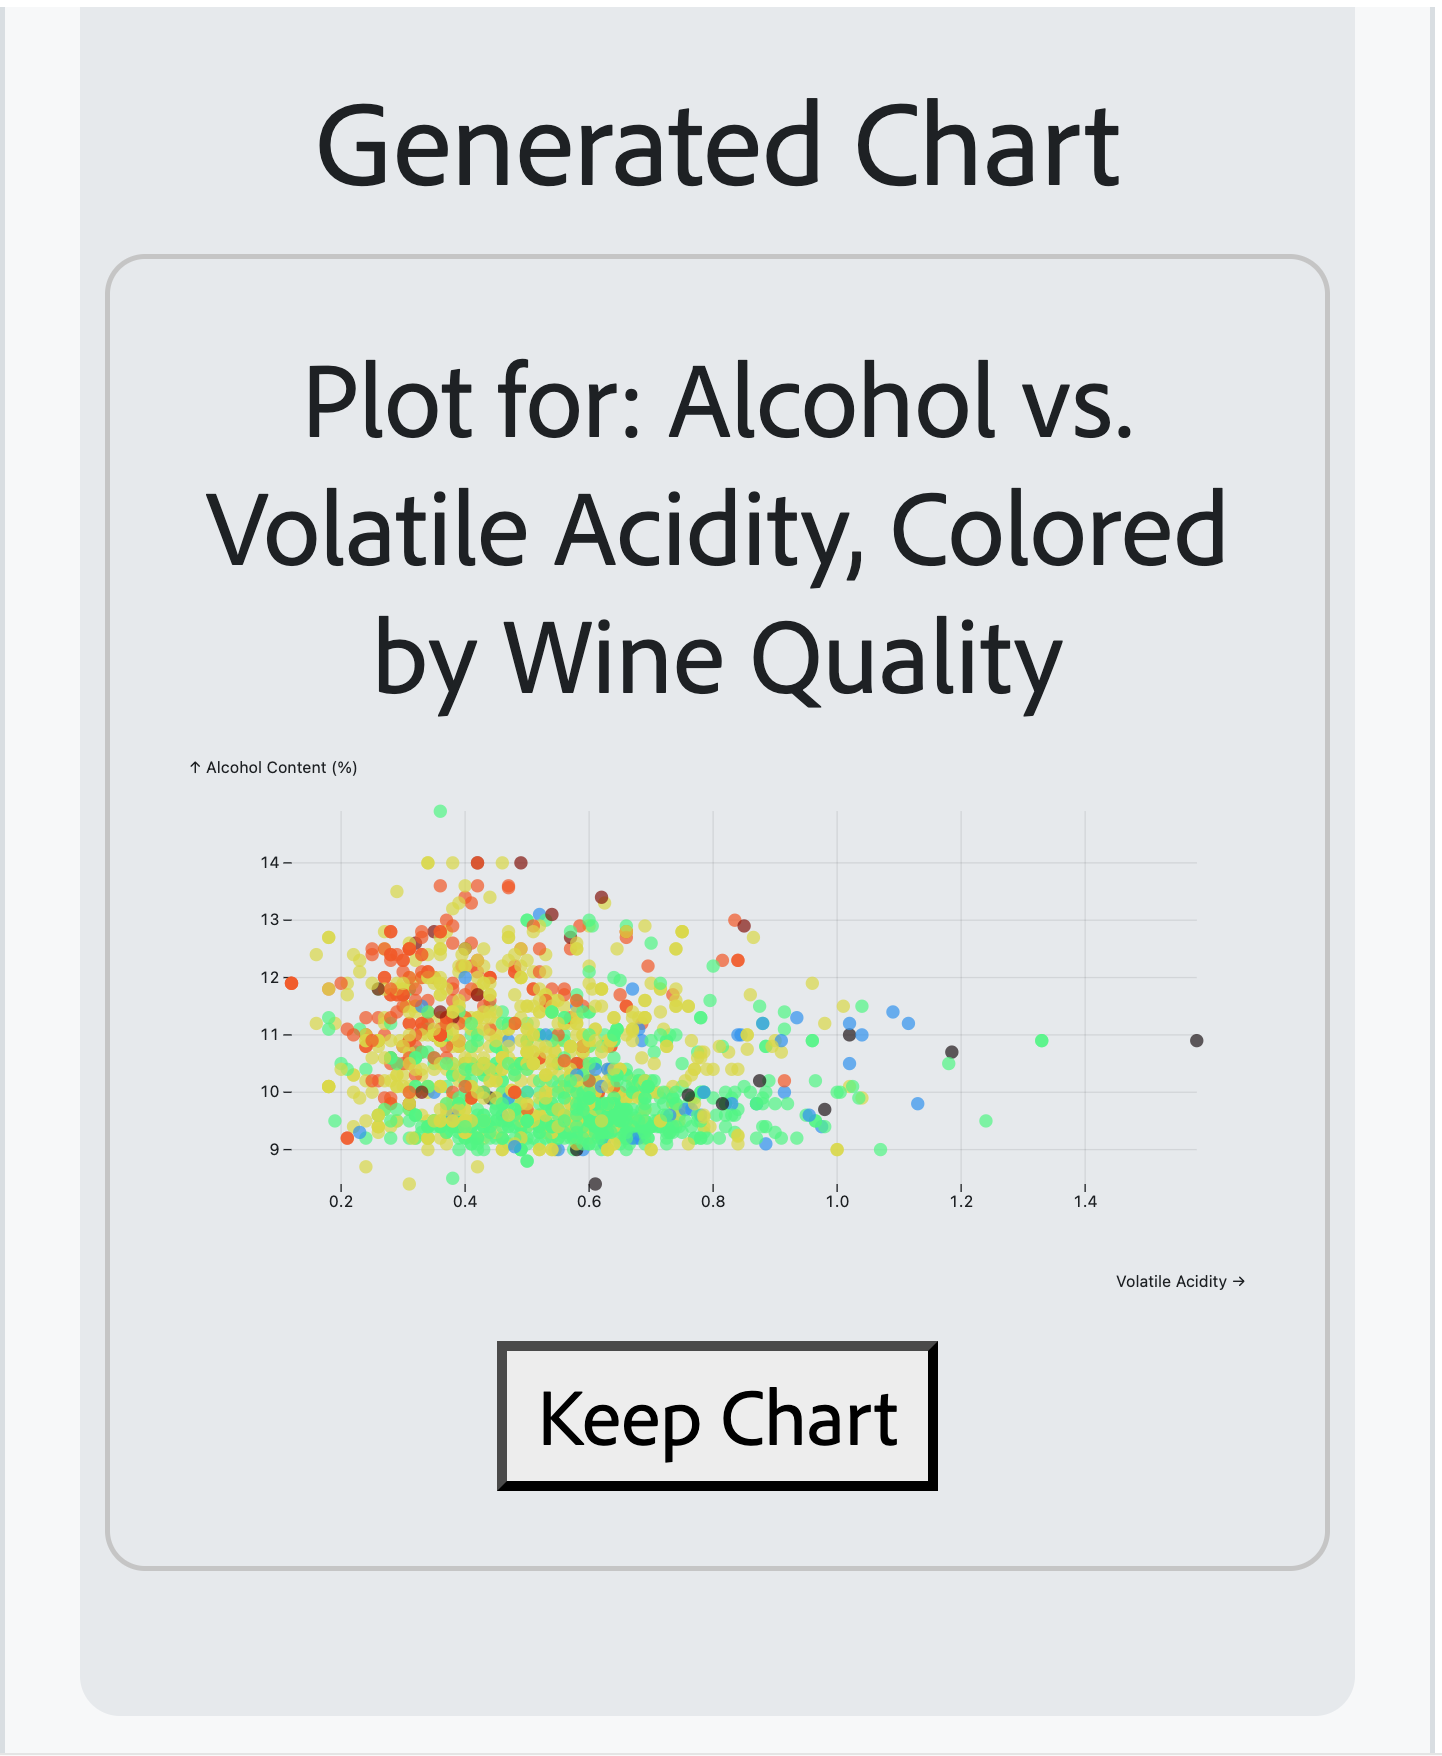
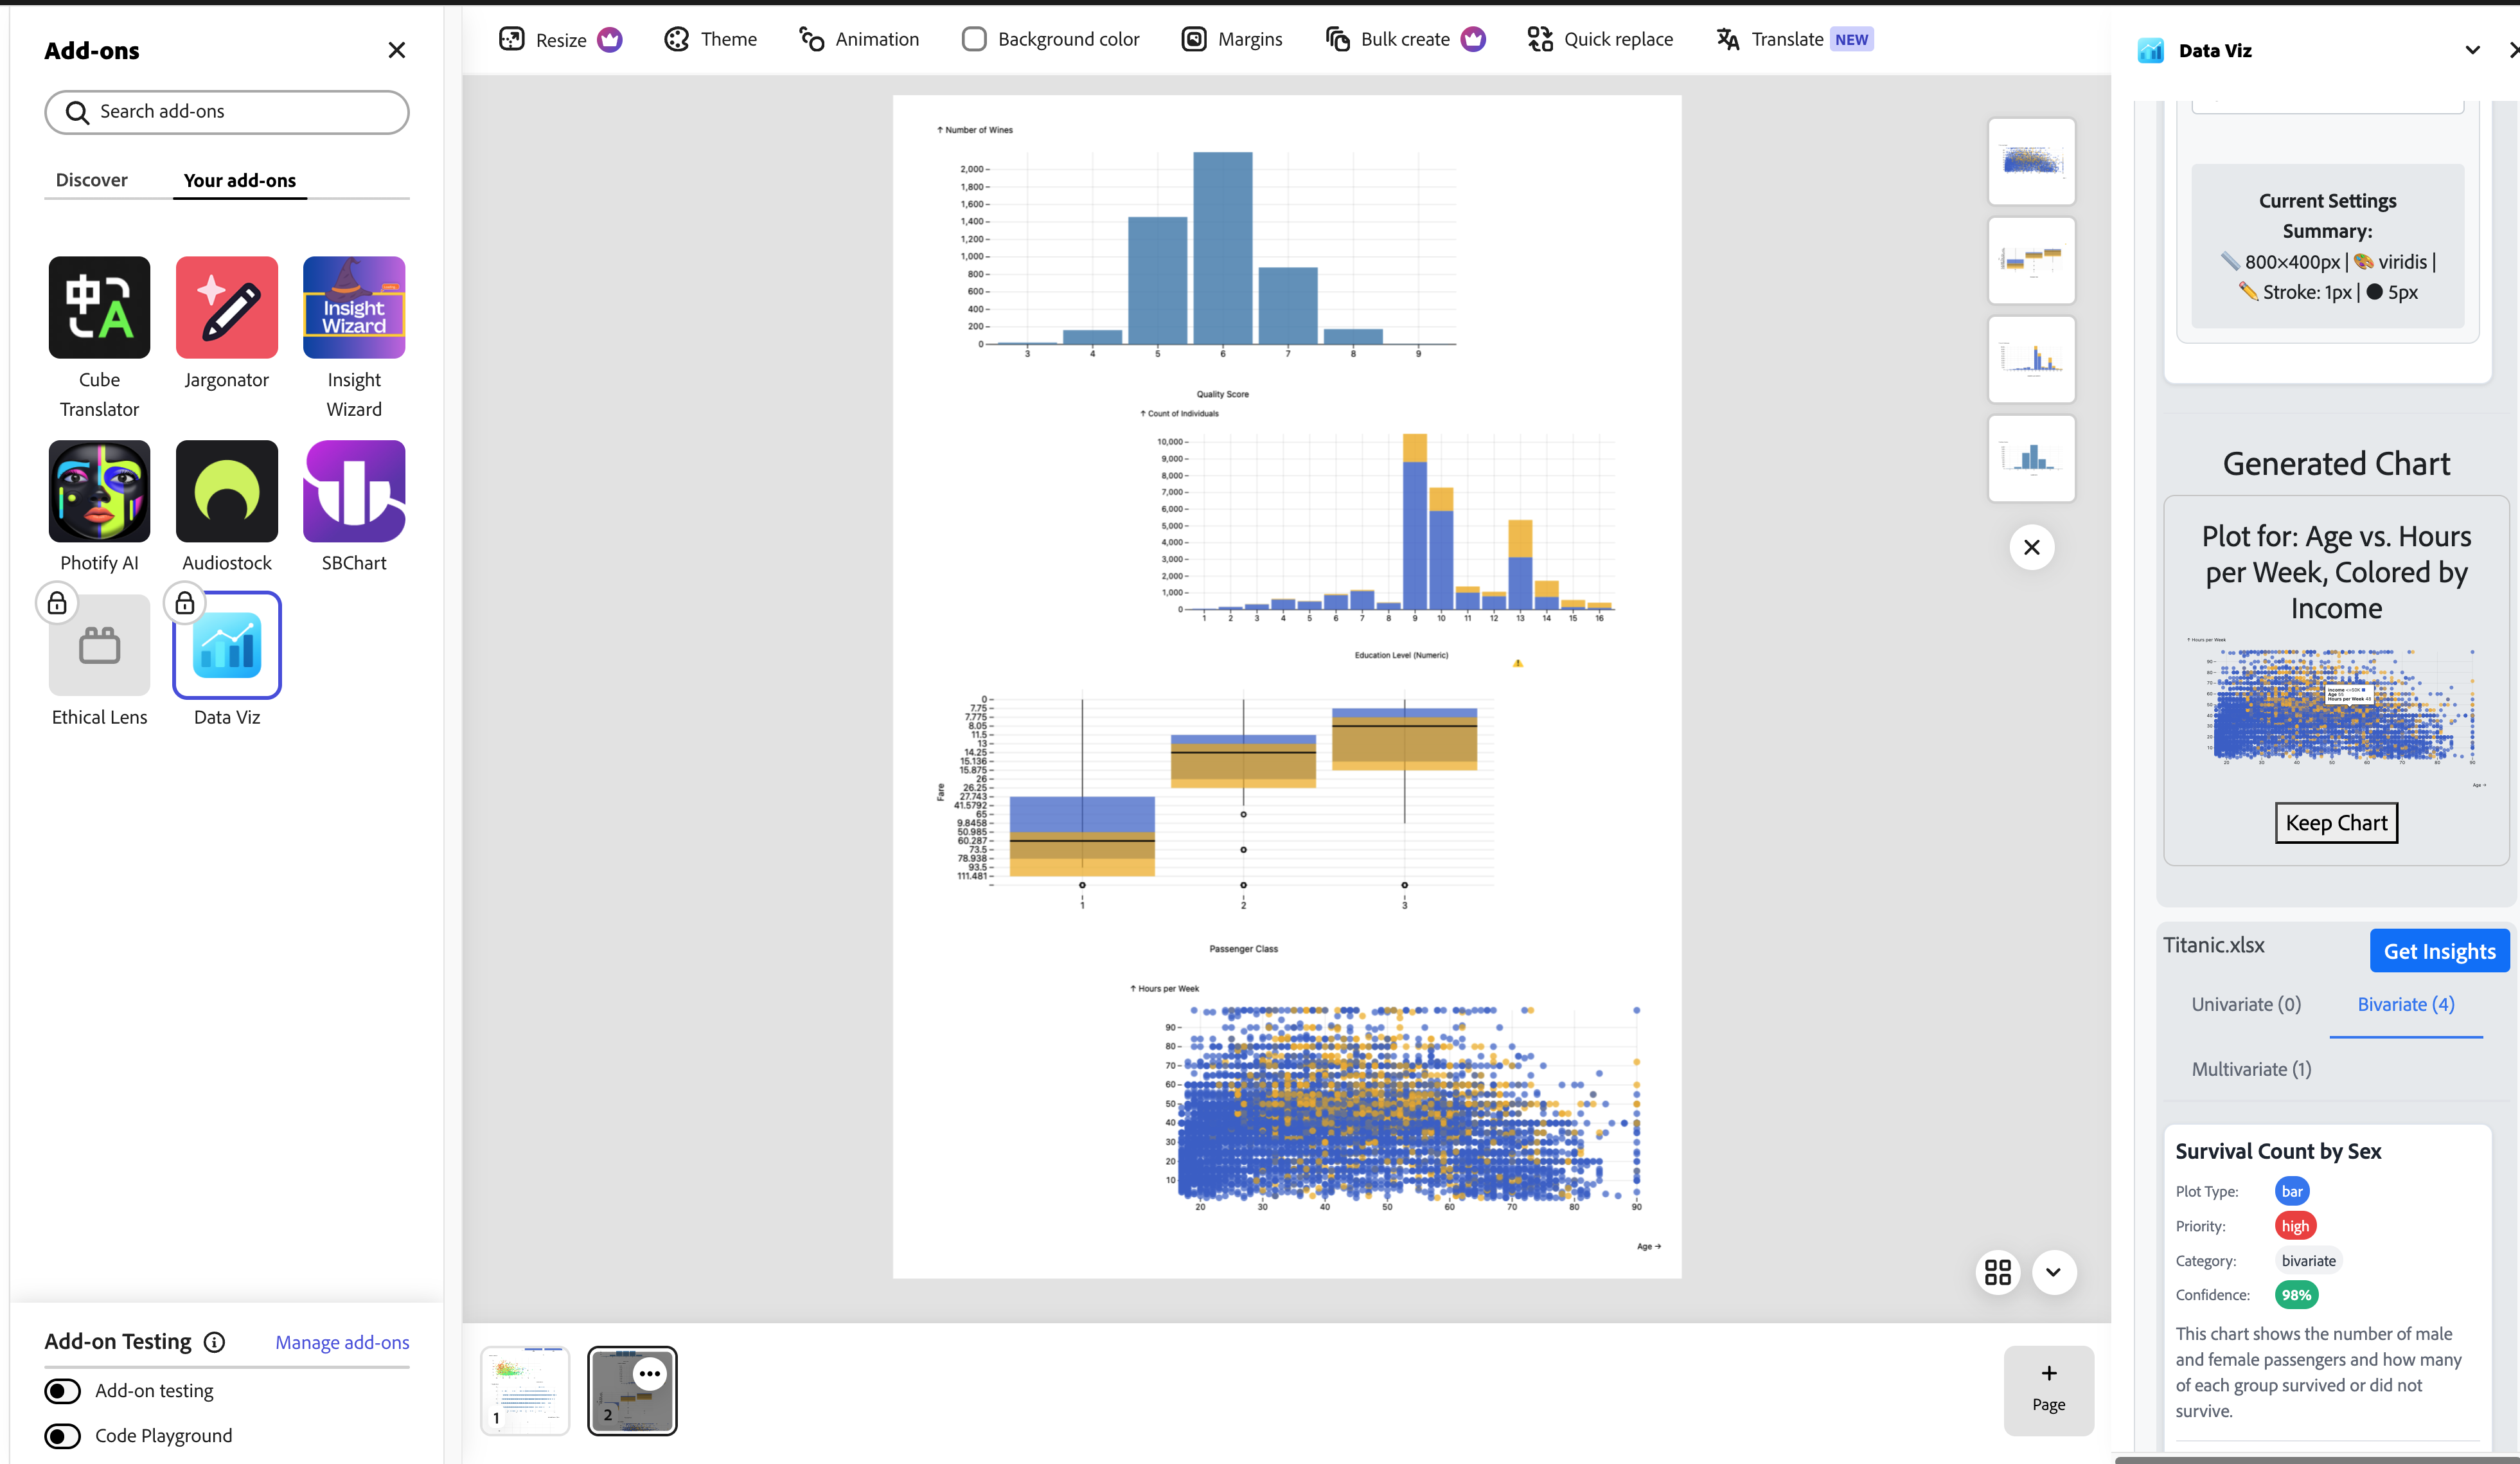
more plots
-
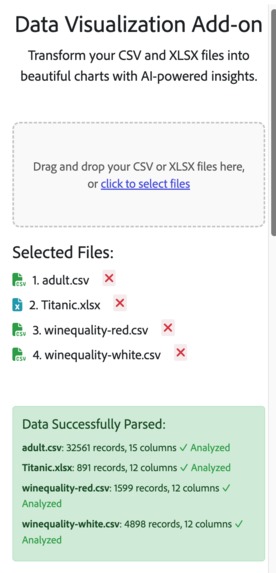
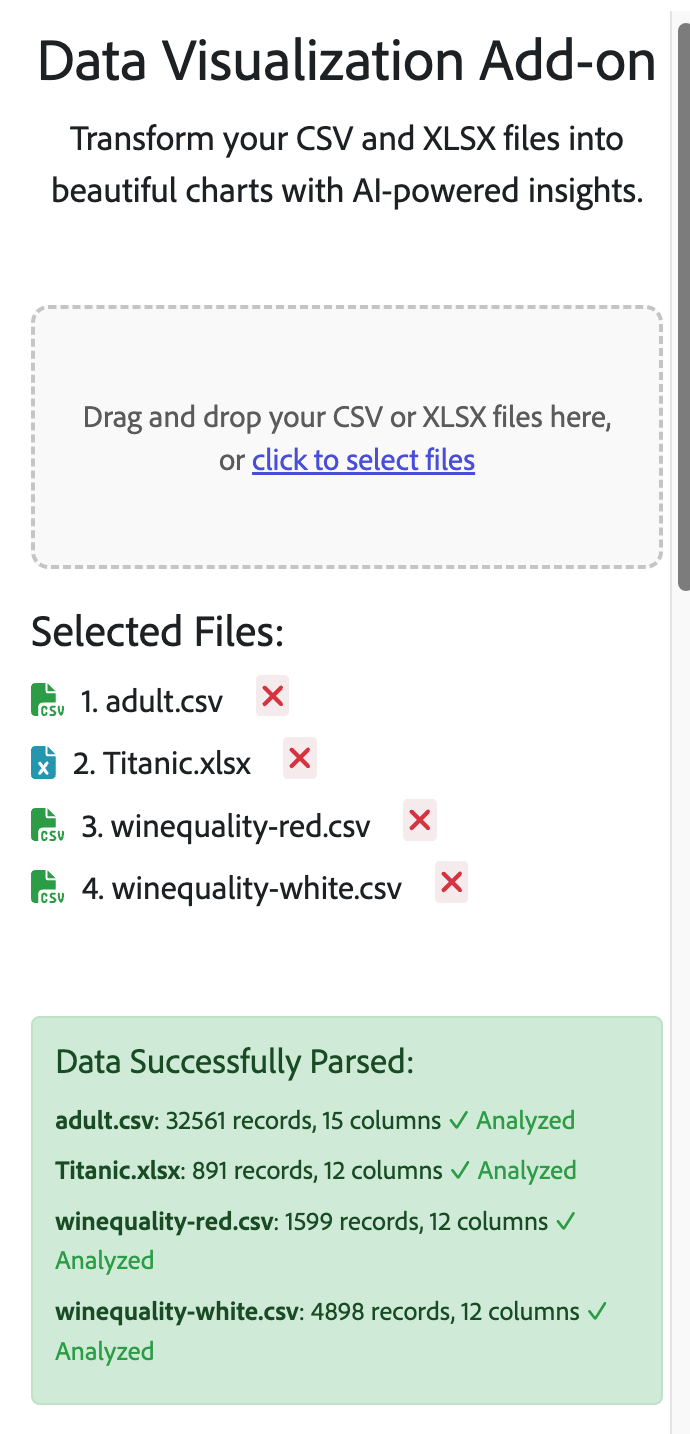
file submission / multi file submission
-
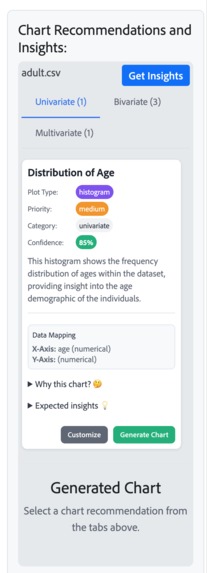
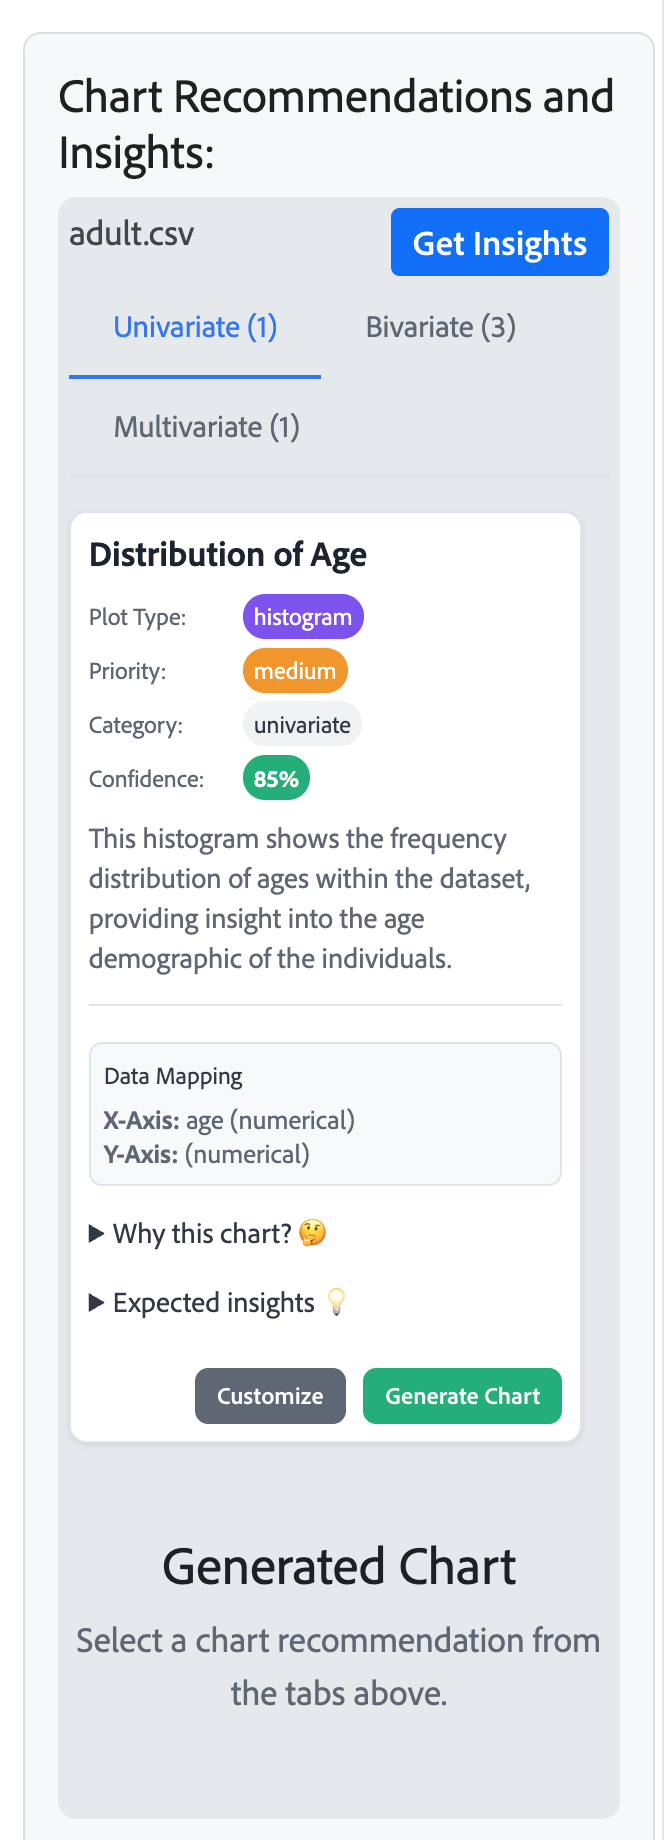
insights from the file / click on get insights to get more detail
-

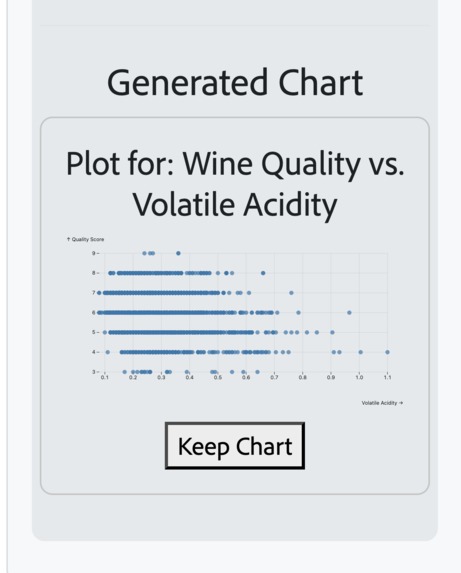
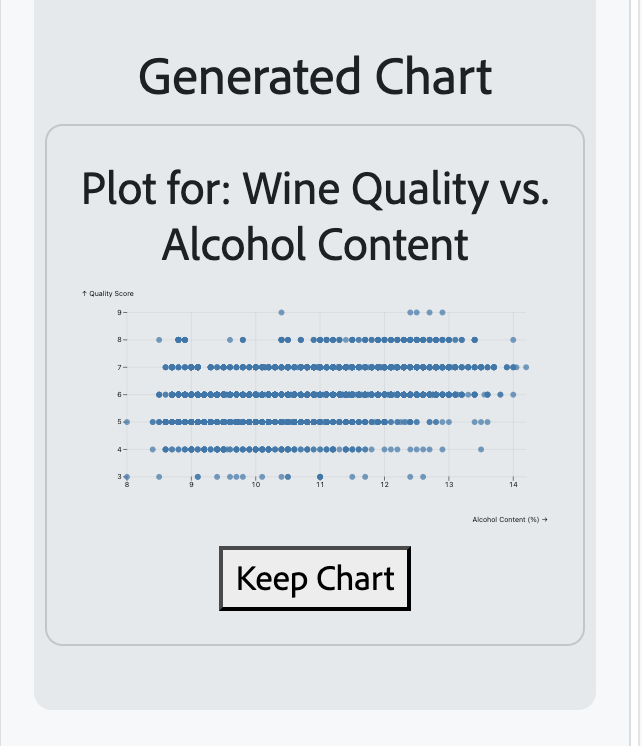
scatter plot
-
differents plots we can generate
-
differents plots we can generate

Inspiration
- Frustrated by manual chart creation in design tools
- Designers struggle with data visualization in Adobe Express
- Time-consuming workflow: create externally → import → format
- Envisioned AI-powered solution within Adobe Express
- Goal: Democratize data storytelling for all skill levels
What it does
- File Upload: Drag & drop CSV/XLSX files
- AI Analysis: Intelligent chart recommendations (univariate, bivariate, multivariate)
- Interactive Charts: Observable Plot with real-time customization
- Style Controls: Colors, dimensions, margins, live preview
- Adobe Integration: Direct insertion as PNG images
- Workflow: Upload → Analyze → Visualize → Insert (all in Adobe Express)
How we built it
Tech Stack:
- Frontend: React 18+ with hooks optimization
- File Processing: Papa Parse (CSV) + SheetJS (Excel)
- AI: Custom LLM for data analysis & recommendations
- Charts: Observable Plot (7+ chart types)
- Adobe API: Document Sandbox Runtime
- Performance: useCallback, useMemo for efficiency
Architecture:
- Modular React components
- Canvas-based SVG to PNG conversion
- Real-time style updates
- Robust error handling
Challenges we ran into
- LLM Structure: Getting consistent, structured chart recommendations from AI
- SVG → PNG: Converting interactive charts to static images for Adobe documents
- Color Management: Observable Plot's complex color scaling for different data types
- Adobe SDK: Learning Document Sandbox Runtime API and security model
- File Compatibility: Handling various CSV/Excel formats and encodings
Accomplishments that we're proud of
- ✅ Multi-format Support: CSV + Excel with auto data detection
- ✅ AI Intelligence: Smart chart recommendations based on data analysis
- ✅ 7+ Chart Types: Bar, line, scatter, histogram, area, box, heatmap
- ✅ Real-time Styling: Instant preview with dynamic customization
- ✅ Native Integration: Seamless Adobe Express workflow
- ✅ Performance: Optimized for large datasets with React hooks
- ✅ Error Handling: Robust validation and edge case management
- ✅ Professional UI: Intuitive interface for all skill levels
What we learned
Technical Skills:
- Adobe SDK architecture and Document Sandbox Runtime API
- LLM integration with structured data analysis
- Observable Plot mastery and interactive visualizations
- Advanced React patterns (useCallback, useMemo, custom hooks)
- Client-side file processing (Papa Parse, SheetJS)
- Canvas API and SVG-to-PNG conversion
- Performance optimization for data visualization
Domain Knowledge:
- Data visualization principles and best practices
- Chart type selection for different data scenarios
- Accessible and meaningful visualization design
What's next for Data Viz
Immediate Goals (August 2025)
- 🏆 Hackathon Win: Secure funding & Adobe mentorship
- 👥 Community Building: User feedback & product iterations
- 📈 AI Enhancement: Improved recommendation accuracy
- 🔧 Production Ready: Stability & performance optimization
- 🖥️ Full-Screen Mode: View and compare charts in expanded interface
- 📊 More Chart Types: Additional visualization options and styles
- ⚡ Performance Boost: Faster file processing and quicker LLM responses
- 📖 Chart Insights: AI-generated chart details and data stories in documents
Long-term Vision (2026+)
- 🌍 Market Leader: Primary data viz solution for Adobe Express
- 🤝 Enterprise: Advanced analytics & team collaboration
- 🔄 Integrations: Google Sheets, Airtable, BI platforms
- 🎓 Education: Tools for educators & students
Feature Pipeline
- 🔍 Advanced Analytics: Statistical analysis & predictive models
- 📋 Templates: Pre-built visualization library
- 🎬 Animations: Chart transitions & presentation modes
- ♿ Accessibility: Screen readers & high-contrast support
- 📱 Mobile: Optimized mobile data visualization experience
- 🖼️ Multi-Window Support: Full-screen live preview, chart interaction & comparison tools

Log in or sign up for Devpost to join the conversation.