-
-
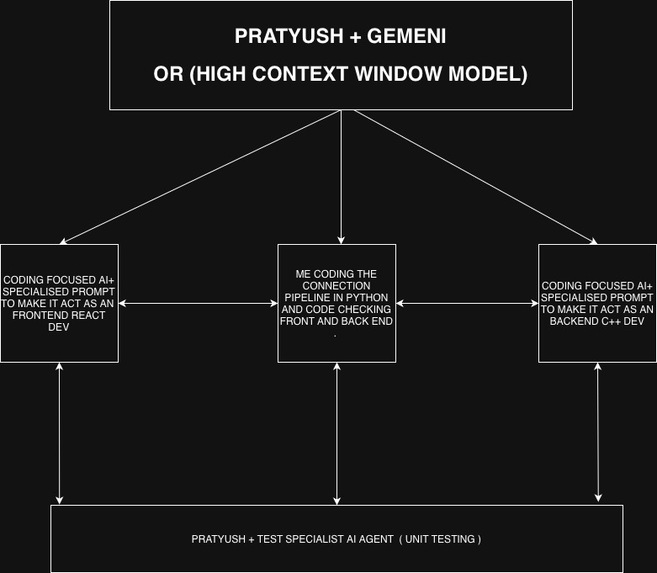
workload distribution
-
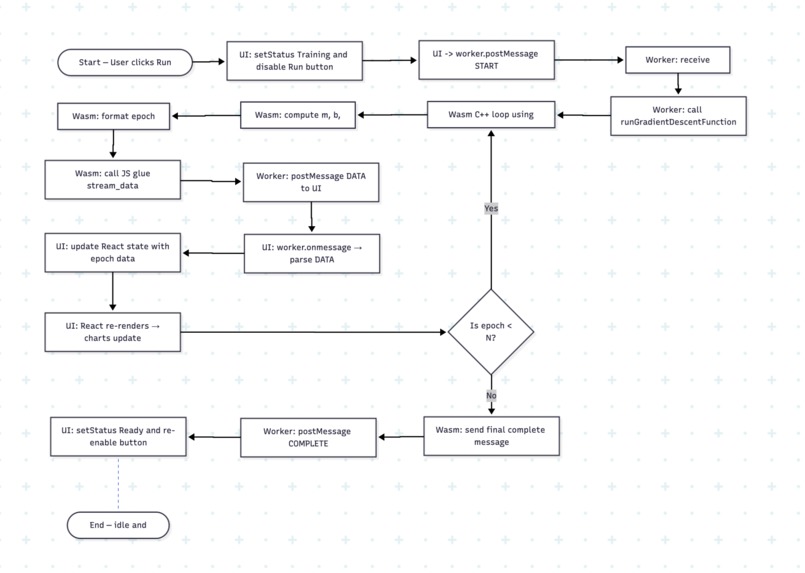
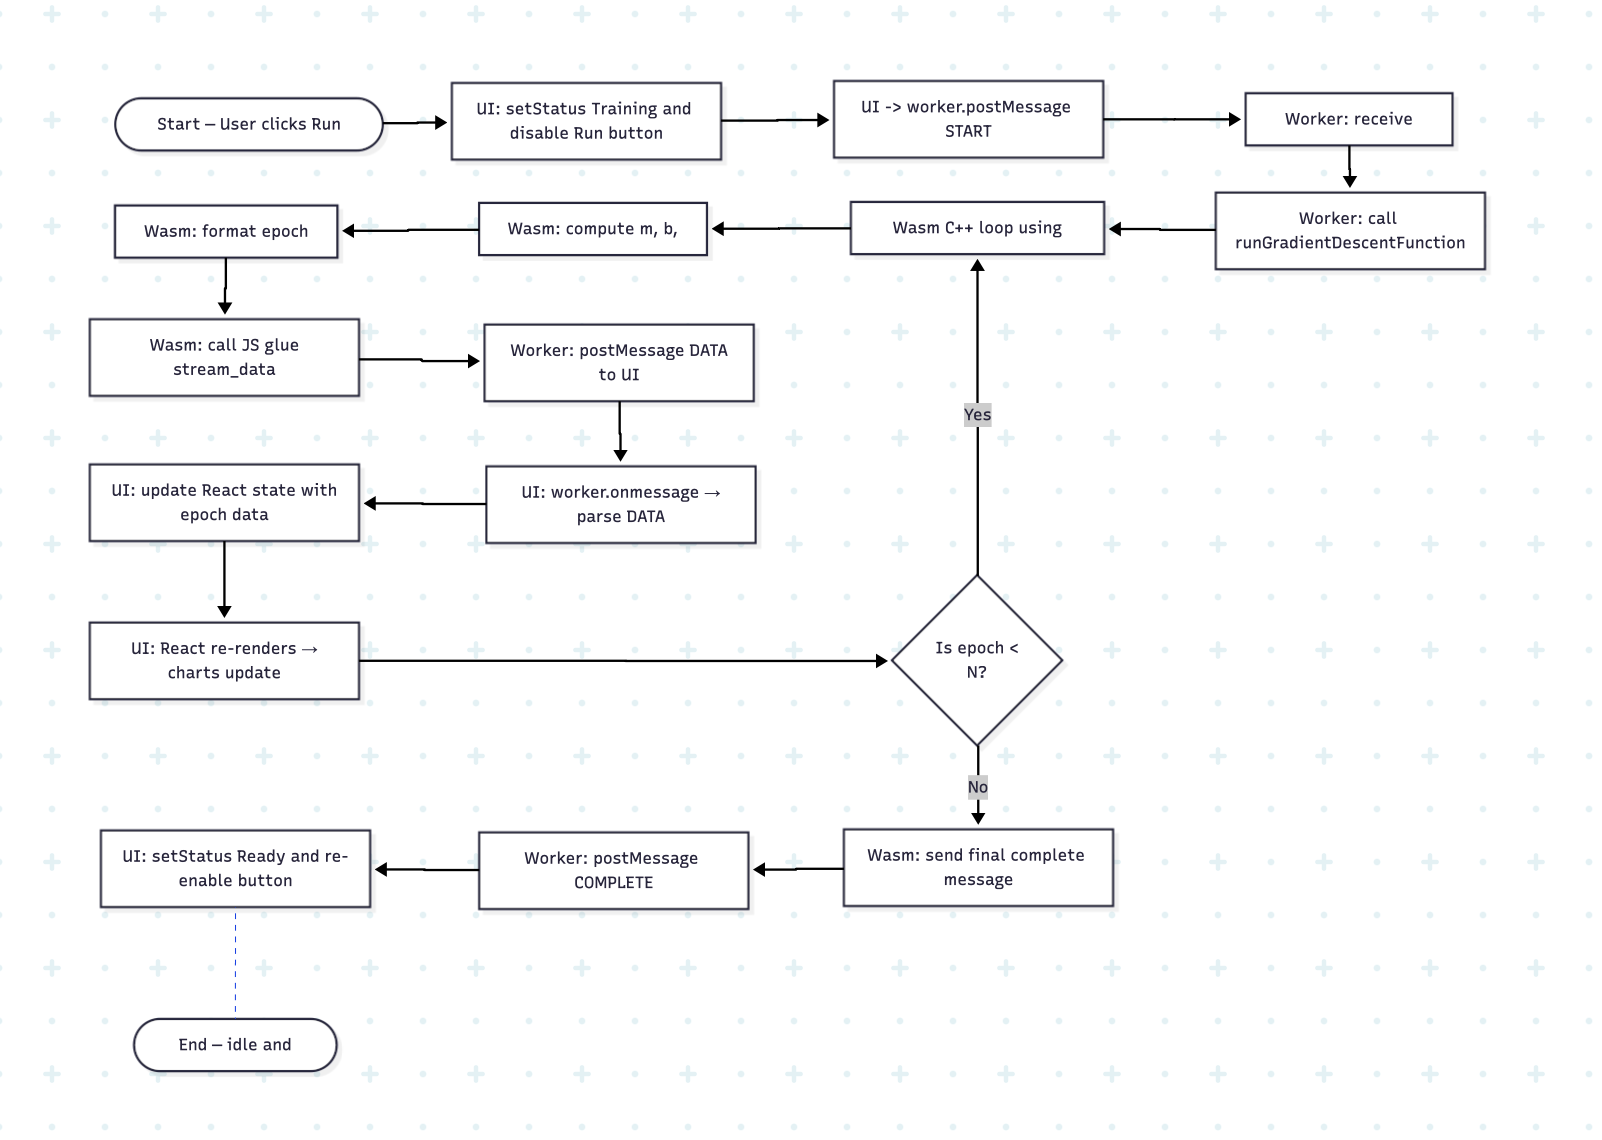
systemflow ( simple streamline)

Inspiration- I was just bored of going to probability classes with no awesome visuals to build intuitive understanding . (this goal was not achieved) And wanted to build something which works like a tracing tool but for data .
What it does- - This is a real-time computation visualization platform.
-It lets a user land on the site, change a parameter (like a "learning rate") for a complex algorithm, and click "Run". -The platform then runs a heavy computation (like "Gradient Descent") and streams the results back to a chart in real-time, giving the user an intuitive "wow" moment.
How we built it- -used a high-performance "Hybrid Compute" Model.
-Frontend: The user interface is built in React , using the Recharts library for the live-updating visualizations.( This part is completely Ai based ) -Backend (Compute): Instead of a slow server, we run desktop-grade C++ code directly in the browser by compiling it to WebAssembly (Wasm). We used the Emscripten toolchain for this. Performance: To prevent the app from freezing, i ran the Wasm computation inside a Web Worker. The React app sends a postMessage to the worker to start, and the worker postMessage-s the data back to update the chart, frame by frame. Server: A lightweight Python Flask server is used to serve the final built React application


Log in or sign up for Devpost to join the conversation.