-
data visualization
Inspiration-The curiosity and interest in data science and machine learning.
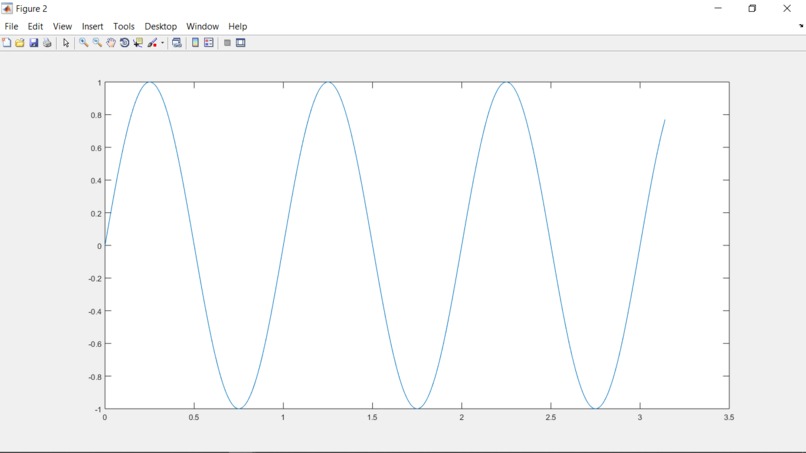
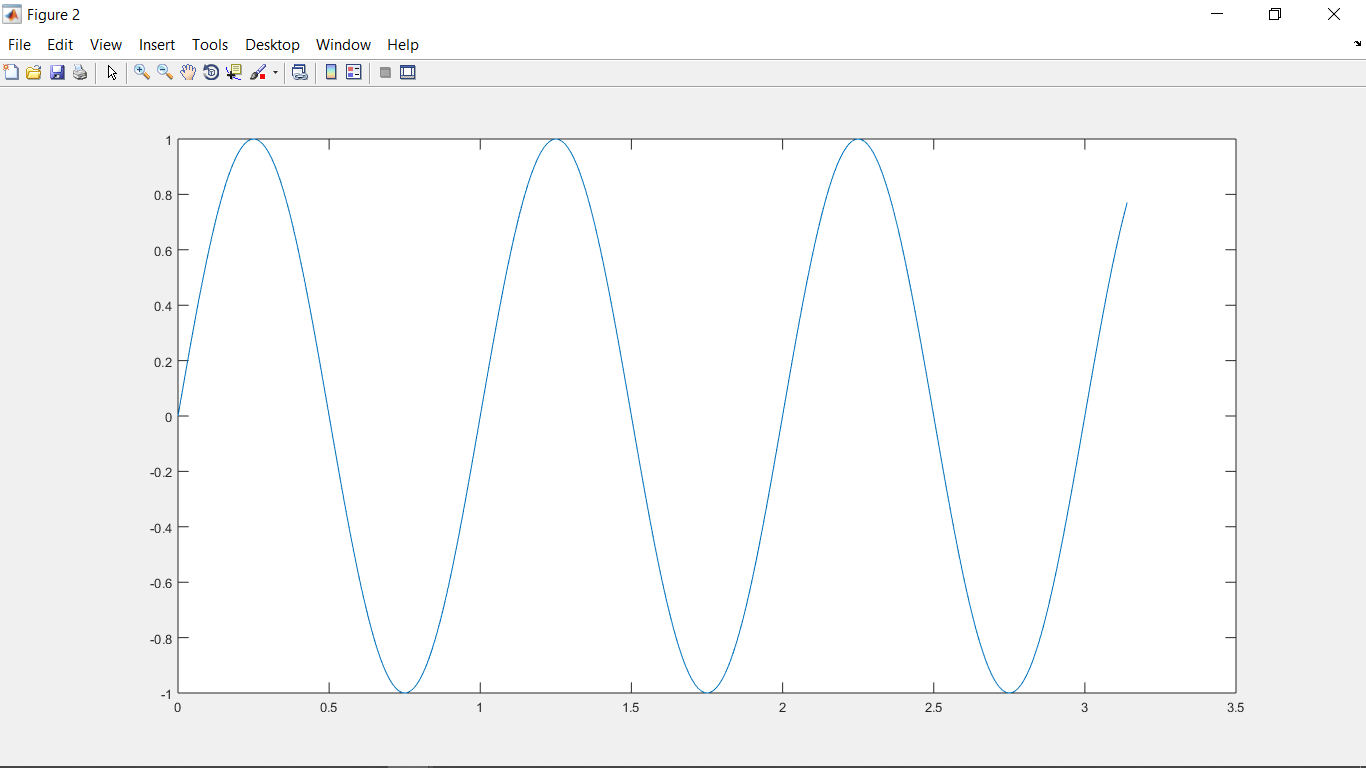
What it does-This is data visualization of a simple train data done in Matlab.
How we built it-I have used the in-build commands of Matlab to visualize the data and the output is in the form of a sine graph.
Challenges we ran into-I had to learn and revise Matlab and also solve a few errors and the installation process was very long.
Accomplishments that we're proud of-I completed this task and received the desired output.
What we learned-I learnt how can we use Matlab effectively to visualize data.
What's next for Data Visualization with Matlab by Chayanika-We can use data visualization in many other fields of research and study and also in AI and ML to analyze our results easily.

Log in or sign up for Devpost to join the conversation.