-
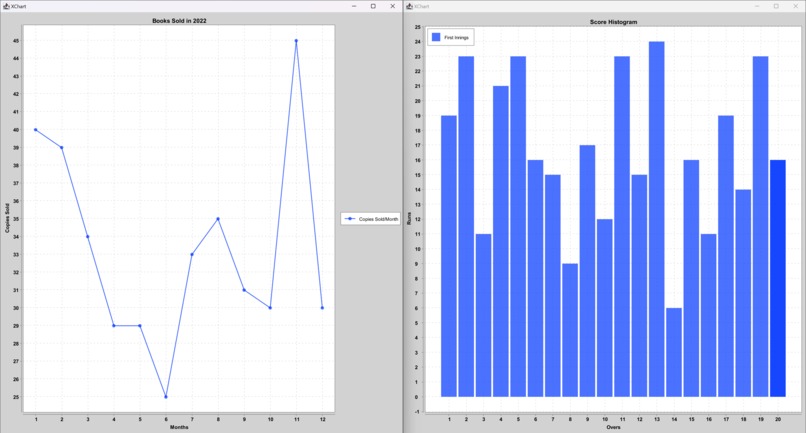
Two different datasets using Line graph and Bar chart

What it does
The project aims to represent datasets using Line graphs and Bar charts visually.
How we built it
Java is used for the codebase, and the charts are generated using the XChart library. Apache Maven is used for the build process.
Accomplishments that I'm proud of
Being able to represent boring alphanumeric data into classic pictorial UI was my biggest accomplishment.
What I learned
Got to learn a new library, XChart, and see its amazing potential!
What's next for Data Visualization with Java
There will be more types of graphs and charts and options to choose from in the near future.

Log in or sign up for Devpost to join the conversation.