-
Barchart

Inspiration
Learning Python to visualize data
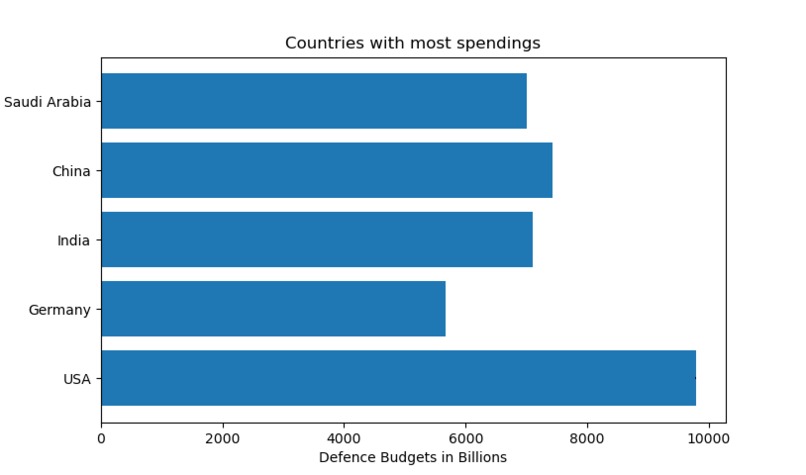
What it does
Plots graph to visualize data from a random number function
How we built it
Using Matplotlib
Challenges we ran into
I am a newbie in python space so yes it was a bit difficult to understand!
Accomplishments that we're proud of
Learnt Matplotlib
What we learned
Learnt Matplotlib
What's next for Data Visualization using Python
Moving From Functions to actual Databases

Log in or sign up for Devpost to join the conversation.