-
1>>
-
2>>
-
3>>
-
4>>
-
5>>


Inspiration
It is a challenge from GHW data week.
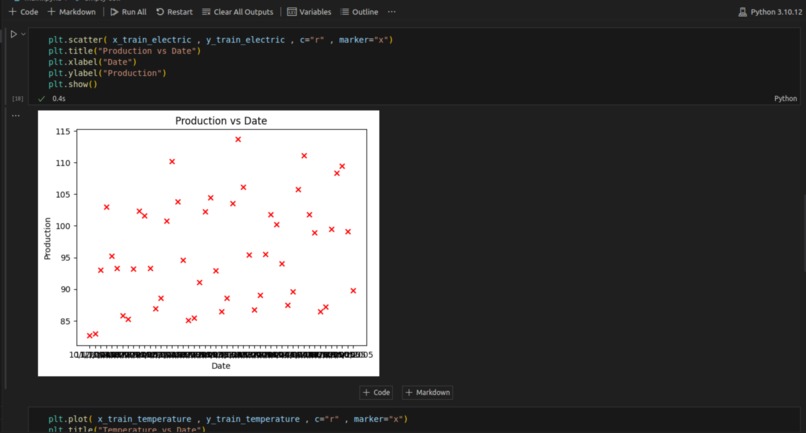
What it does
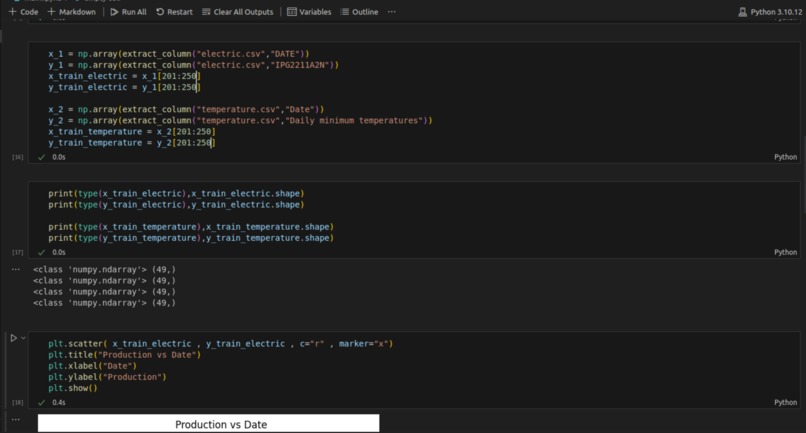
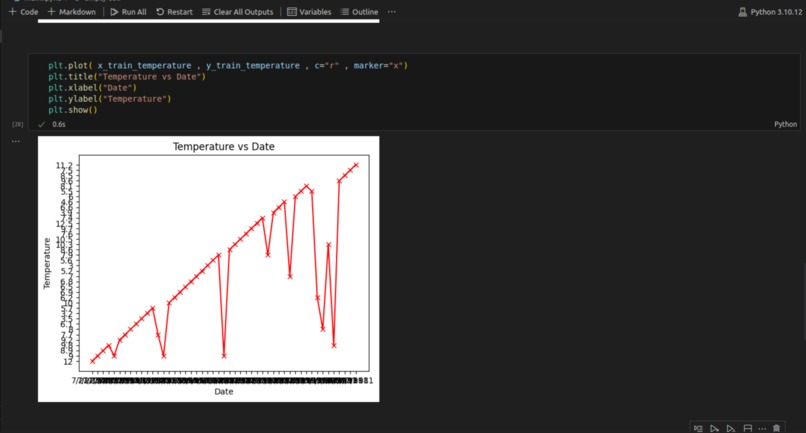
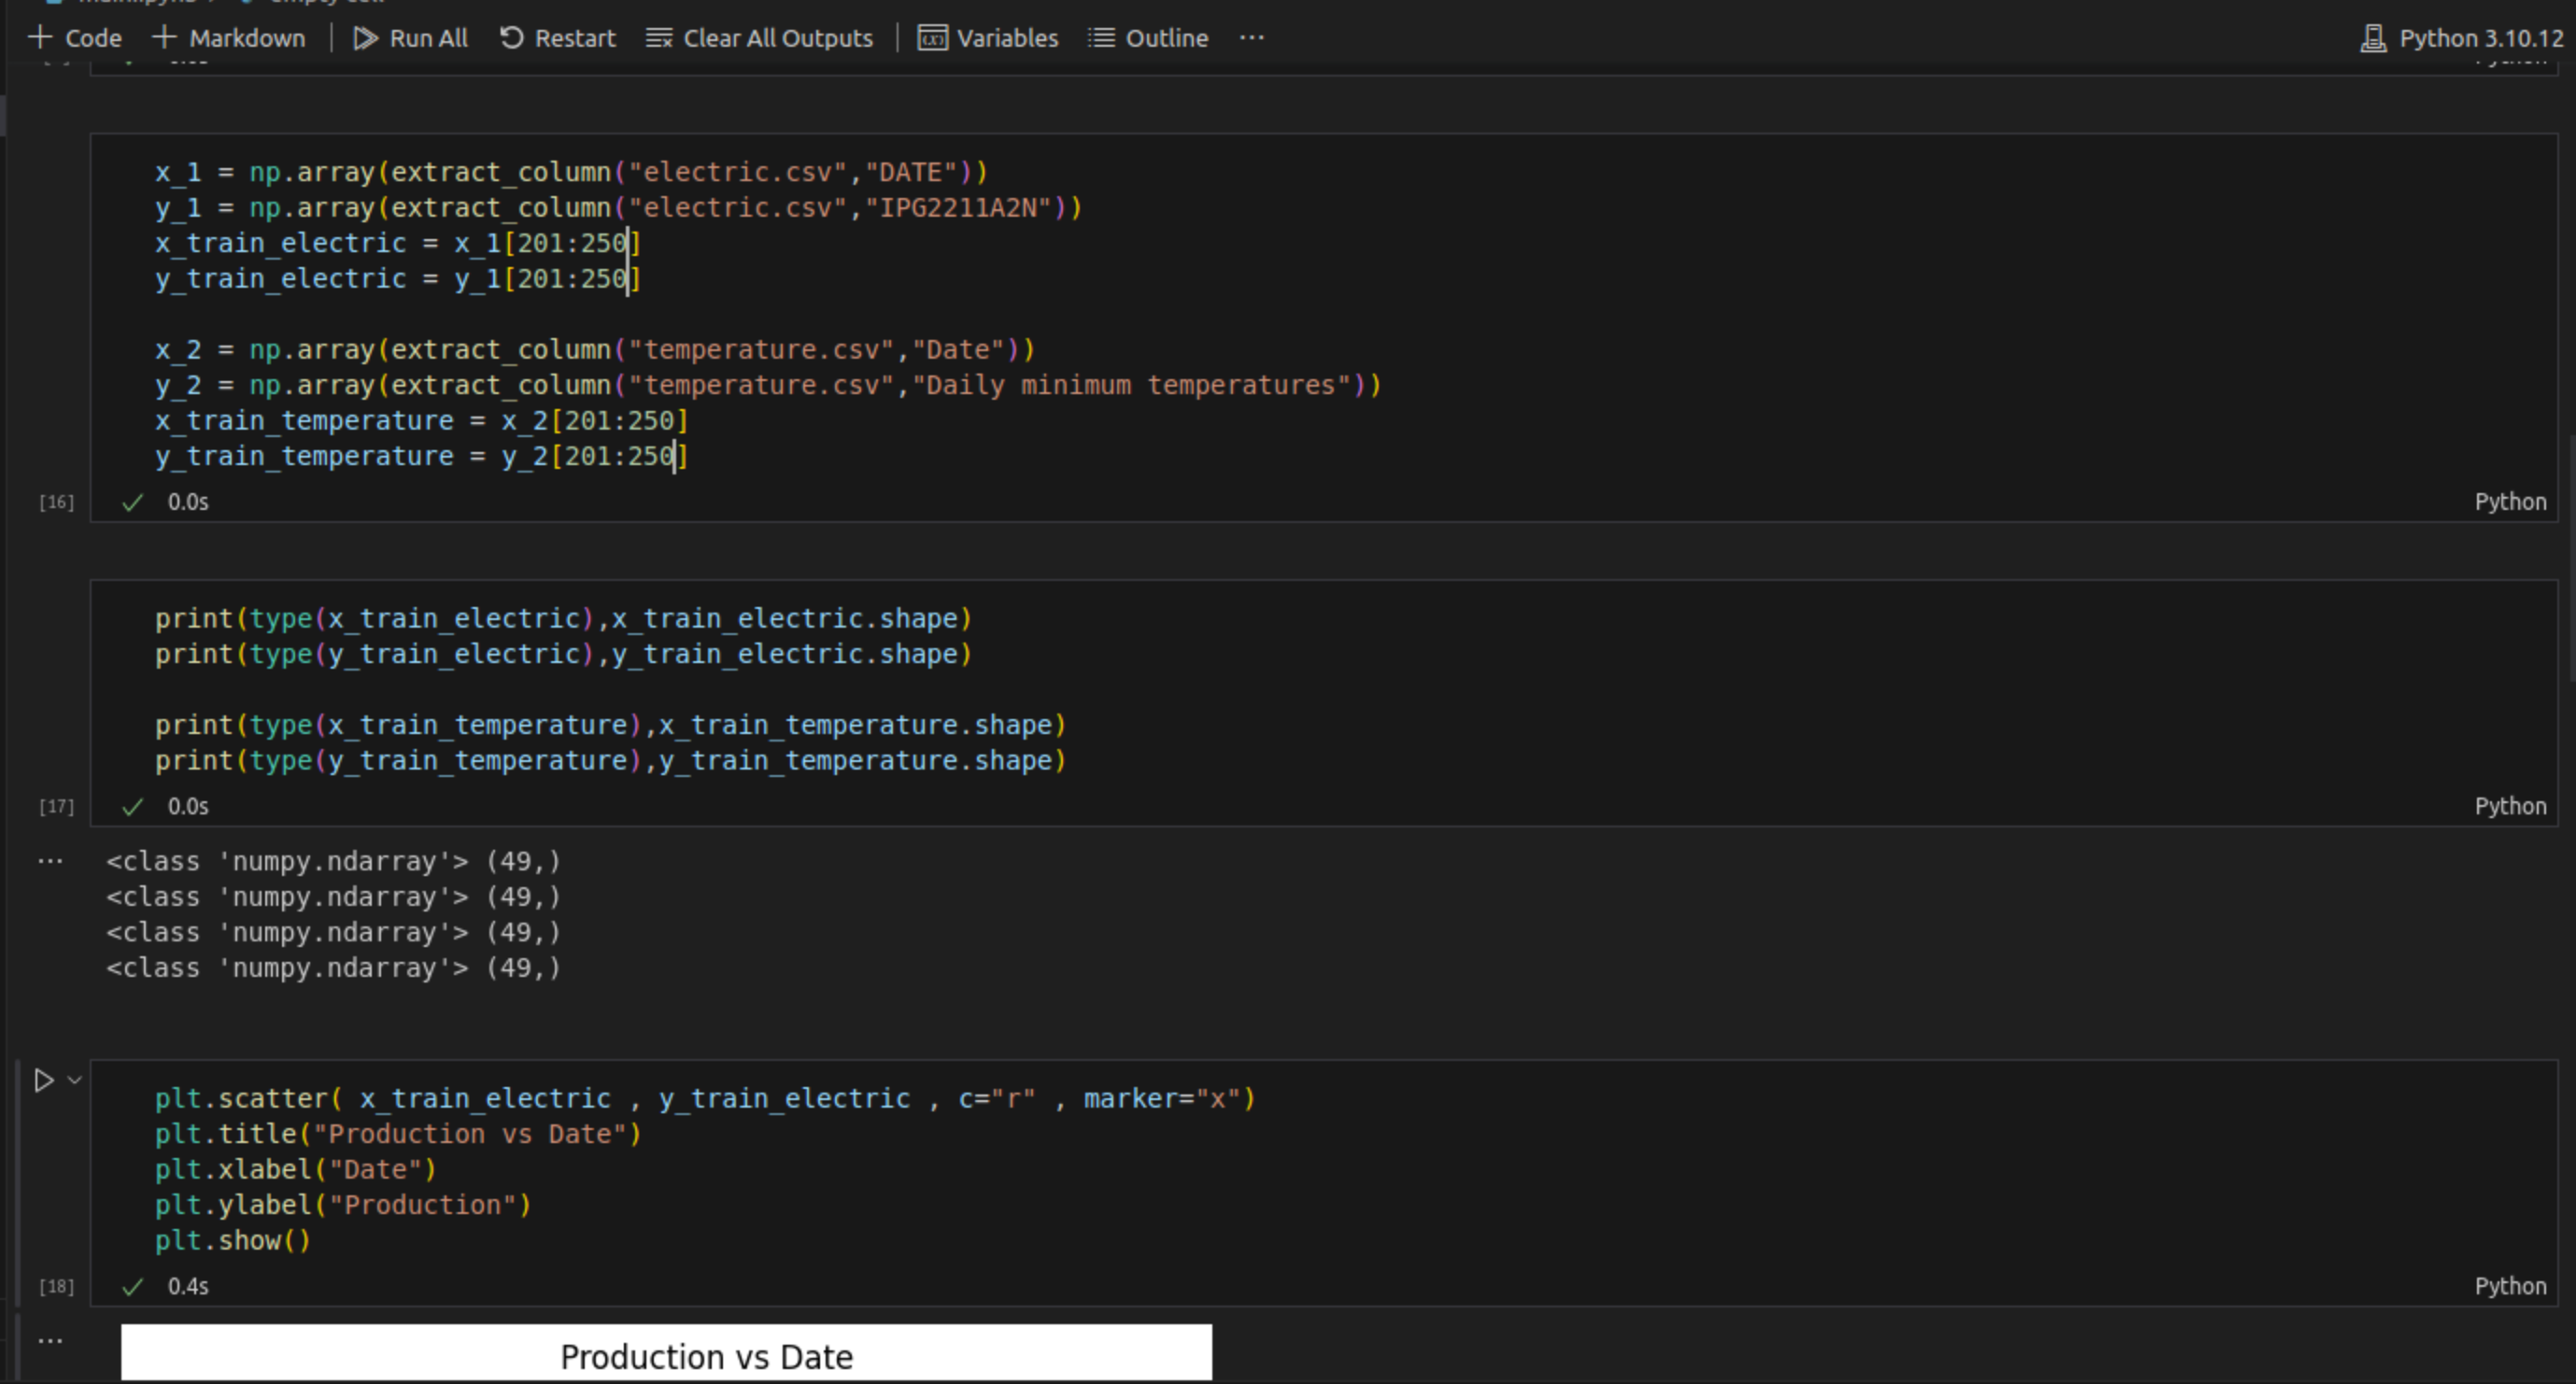
It visualize given dataset and output meaningful data.
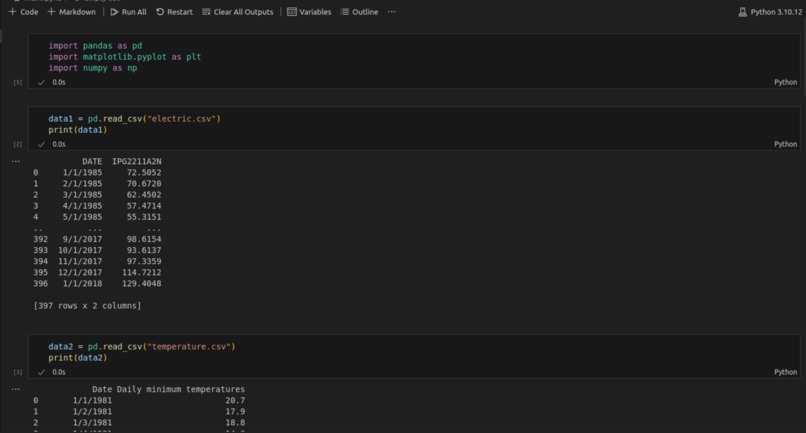
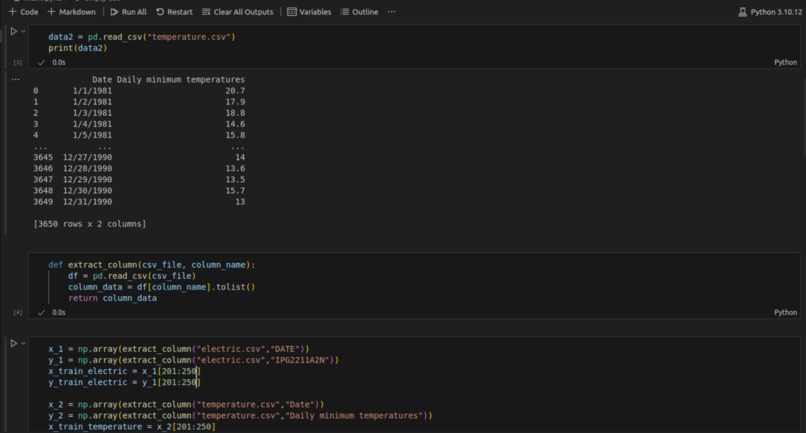
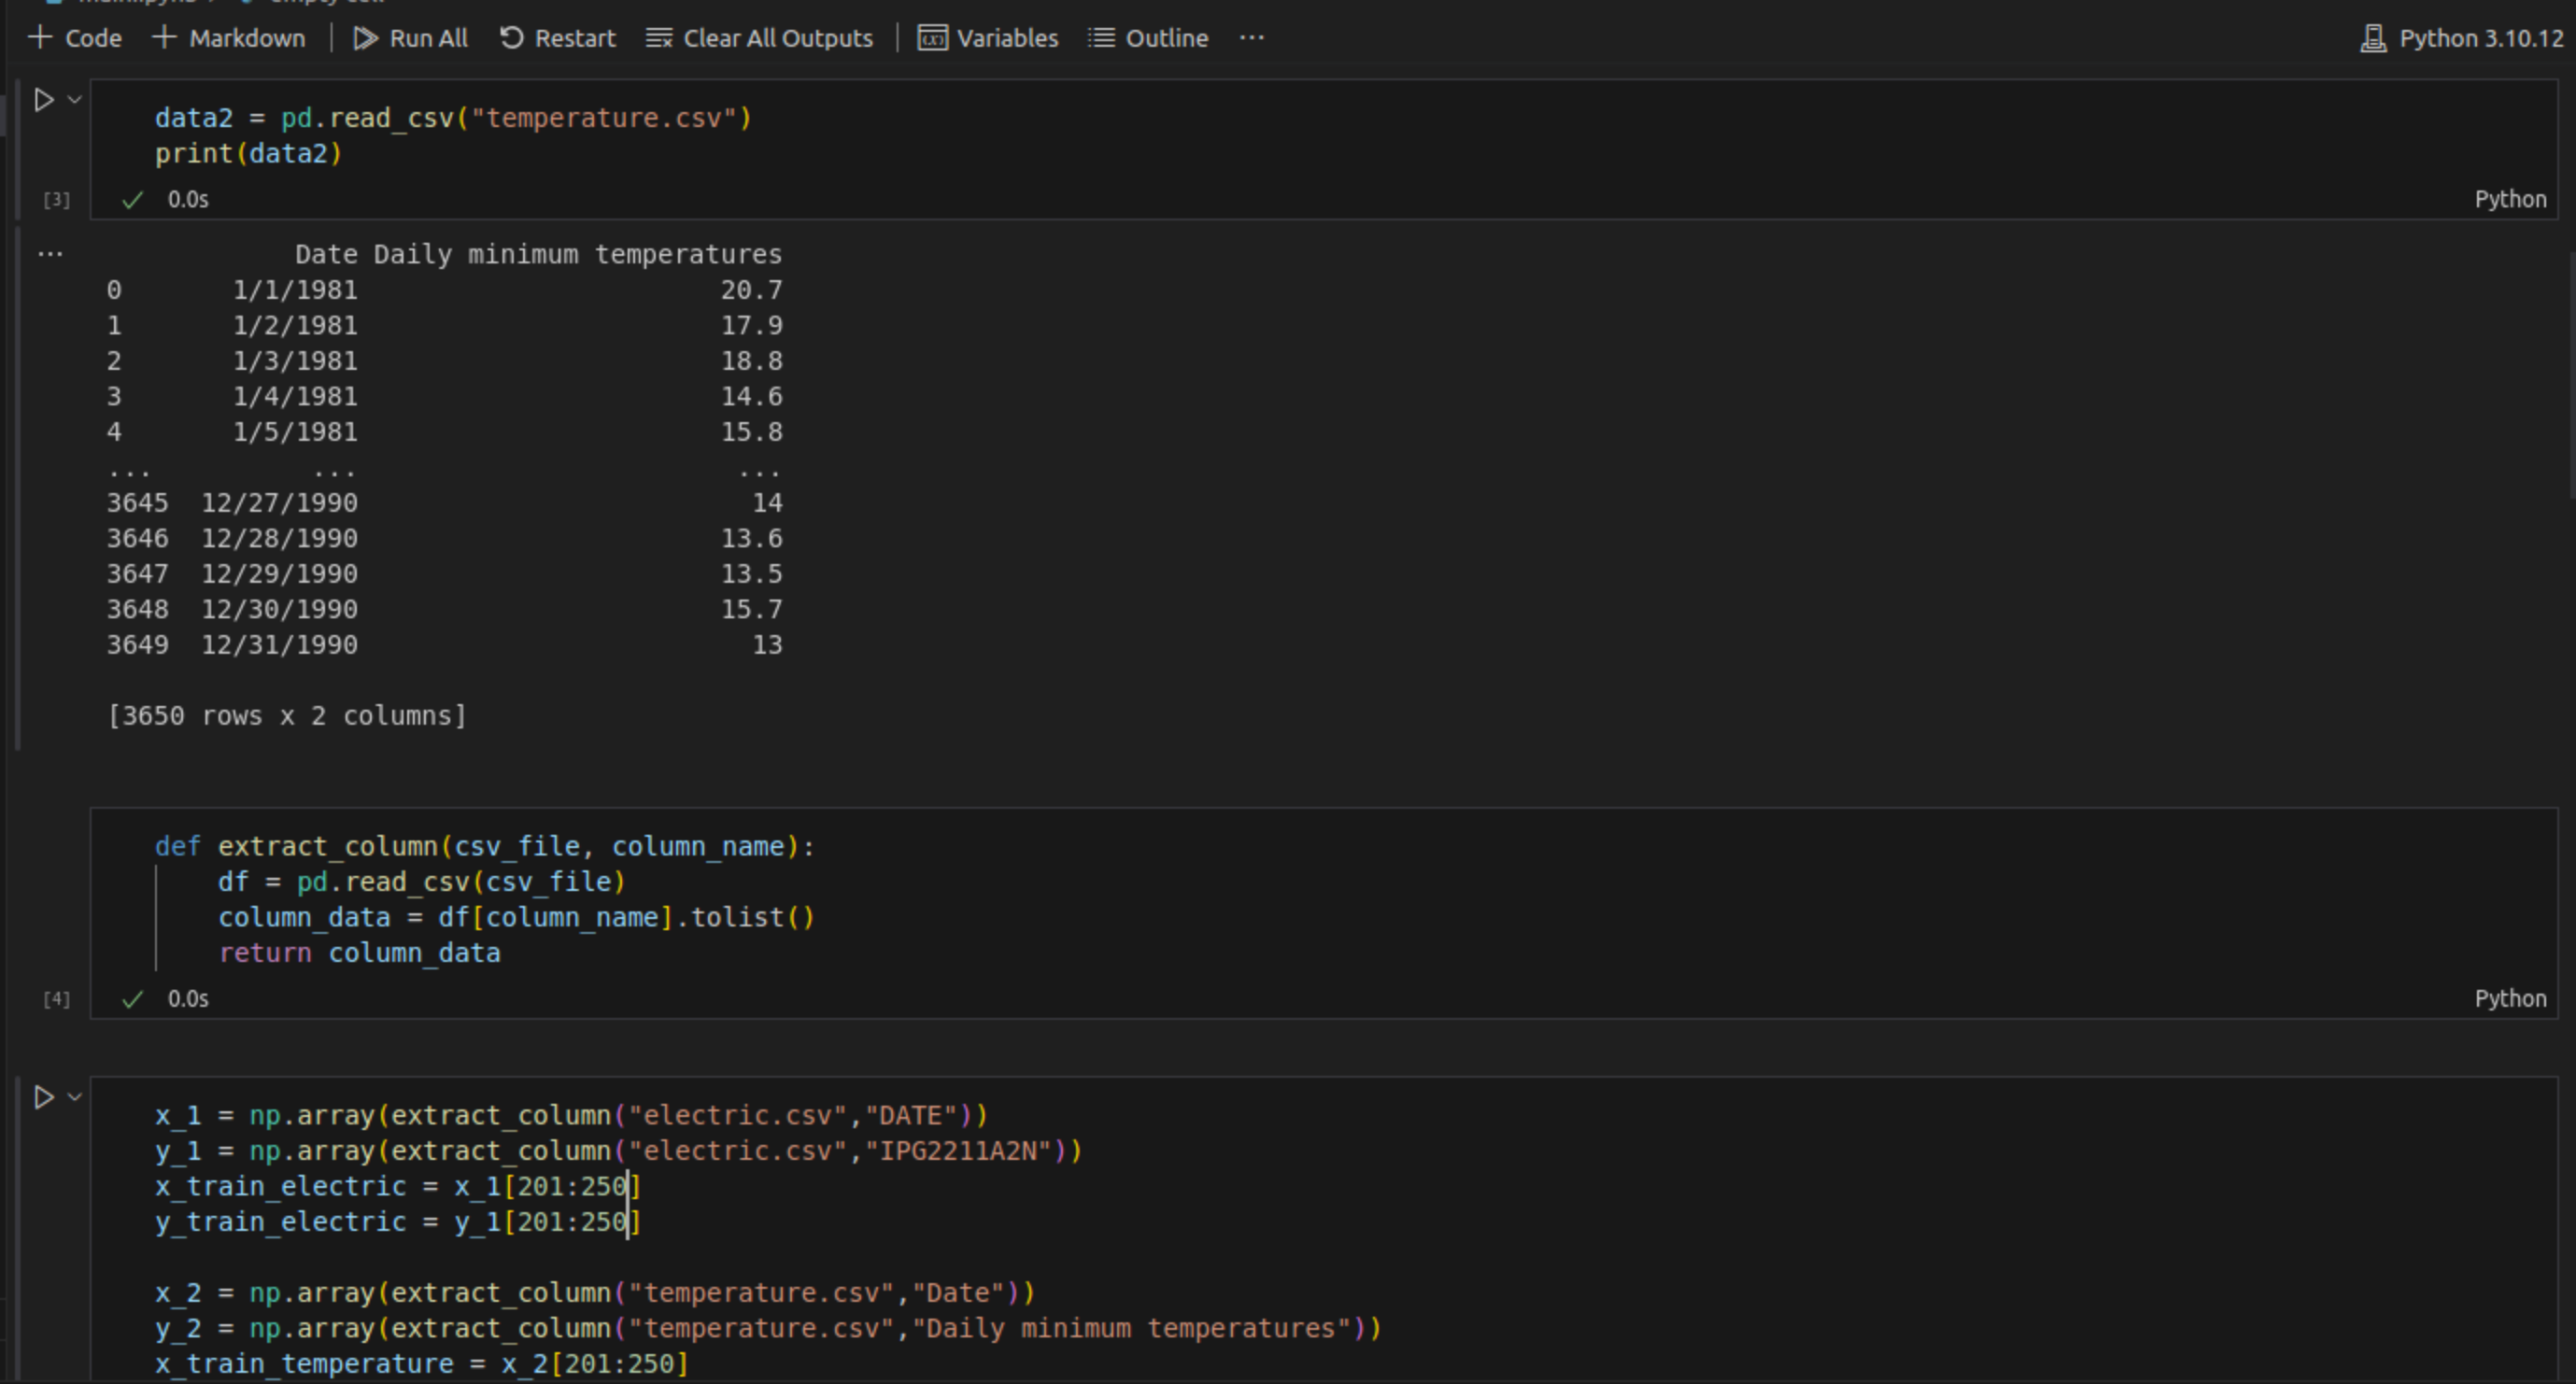
How we built it
I have built it on VS code kernel or we can do it on Jupyter notebook as well. I have downloaded datasets from kaggle and then imports it using pandas library.i have used matplotlib library for visualization.
Accomplishments that we're proud of
Explore new libraries and used jupyter notebook.
What we learned
I have learn basics of data visualization.
What's next for Data Visualization
We can use this for ML models.

Log in or sign up for Devpost to join the conversation.