Inspiration
The challenge mhl
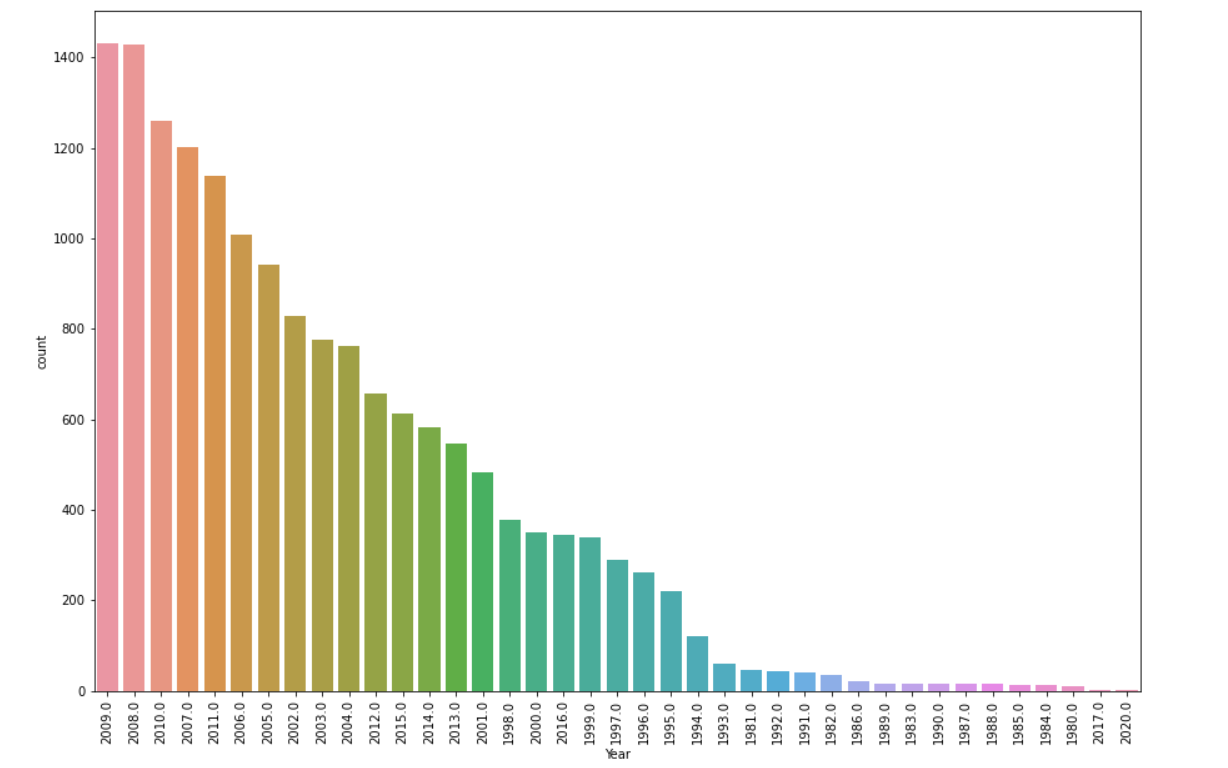
What it does
it shows how many games were sold per year through a Histogram
How we built it
Using Kaggle datasets and notebook
Challenges we ran into
learning the platform
Accomplishments that we're proud of
the final result
What we learned
data vizualisation
What's next for Data visualization
other representations of future datasets

Log in or sign up for Devpost to join the conversation.