-
Code
-
Code
-
Code
-
Code
-
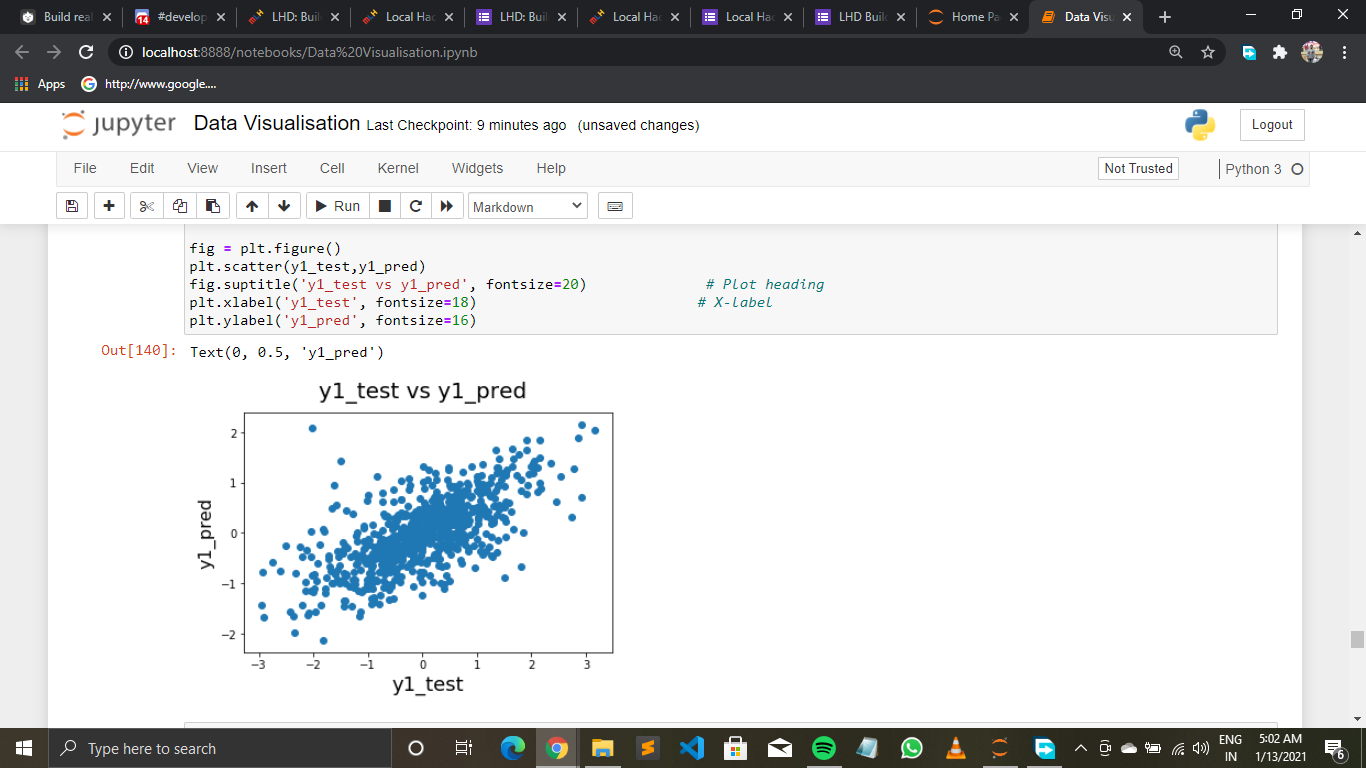
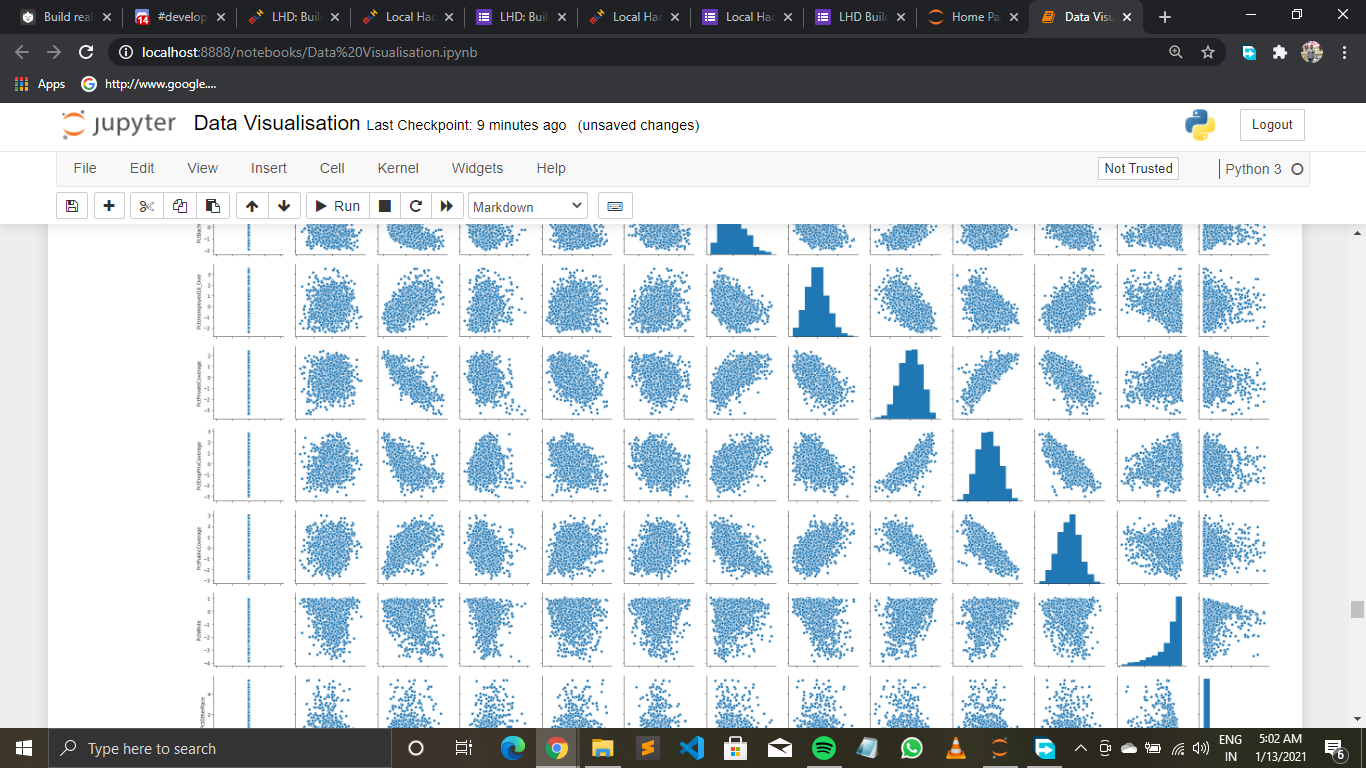
Plotting data
-
Plotting data
-
Plotting data
-
Plotting data
-
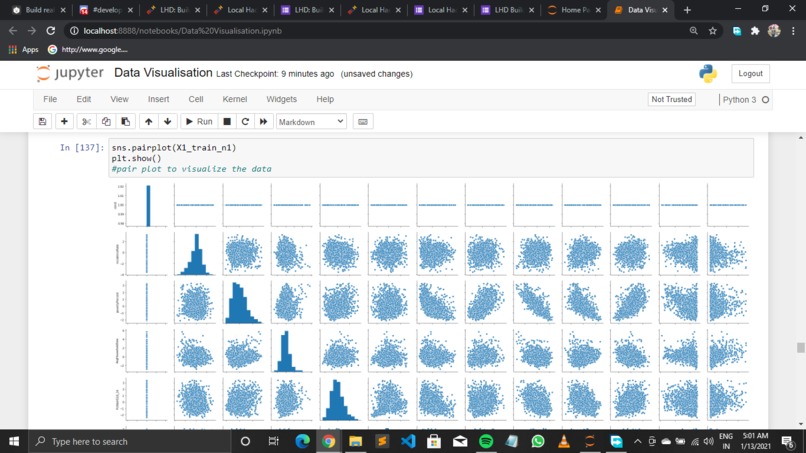
Plotting data


Inspiration
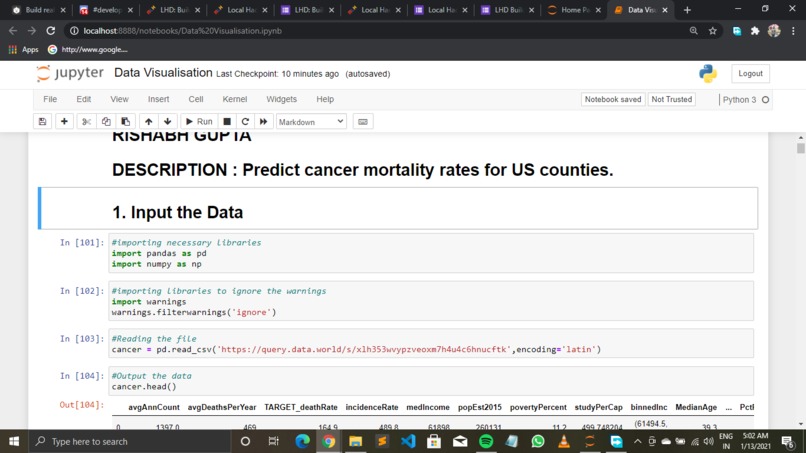
I want to be a Data Scientist.
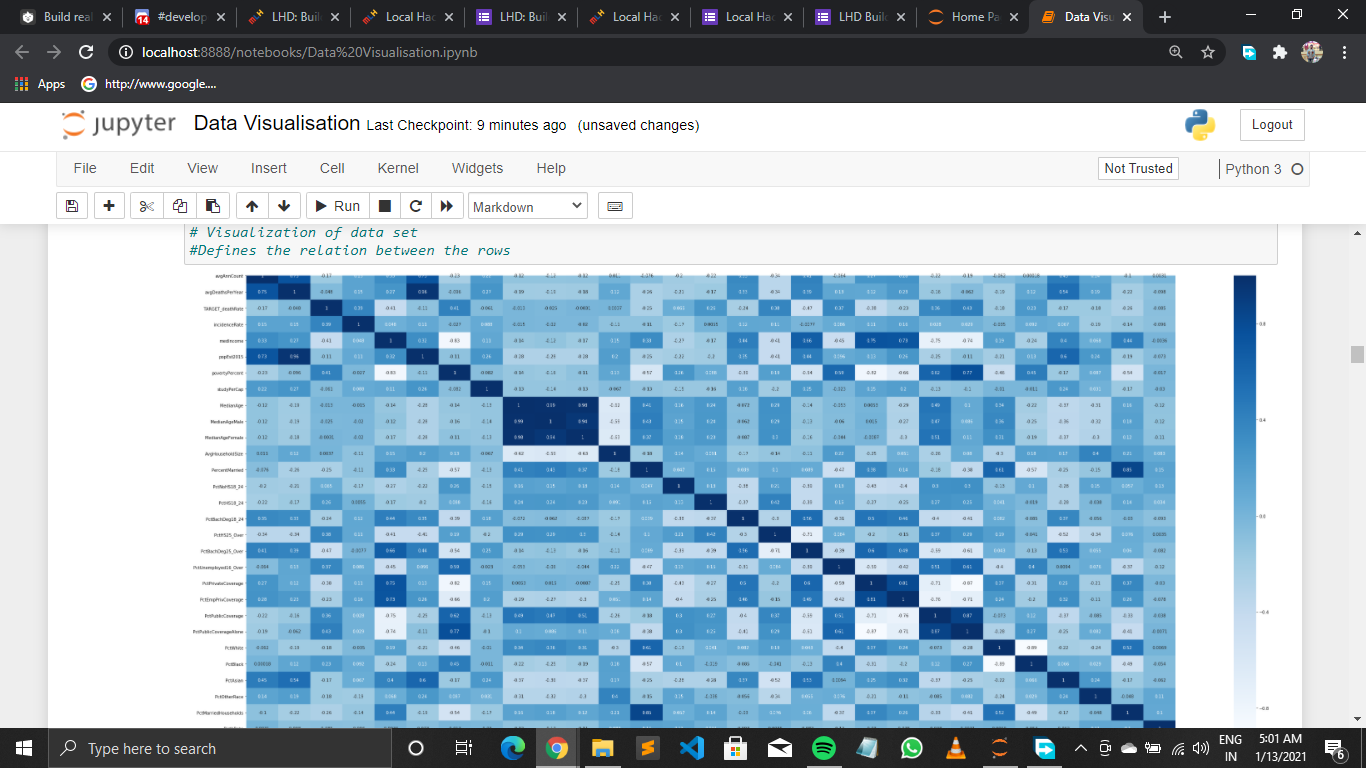
What it does
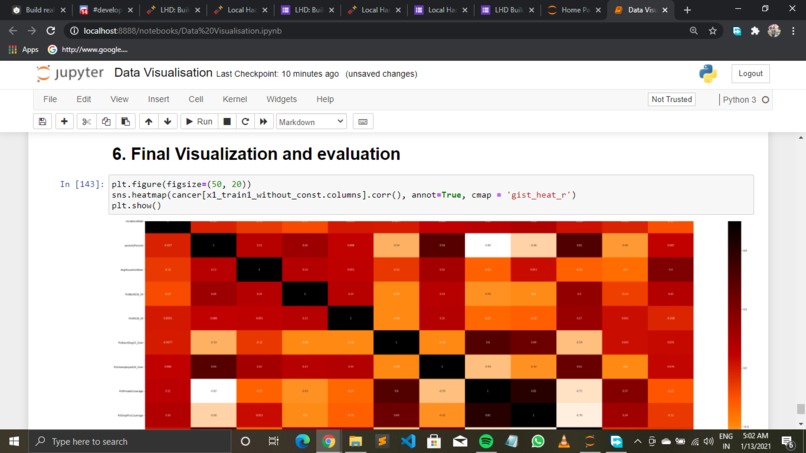
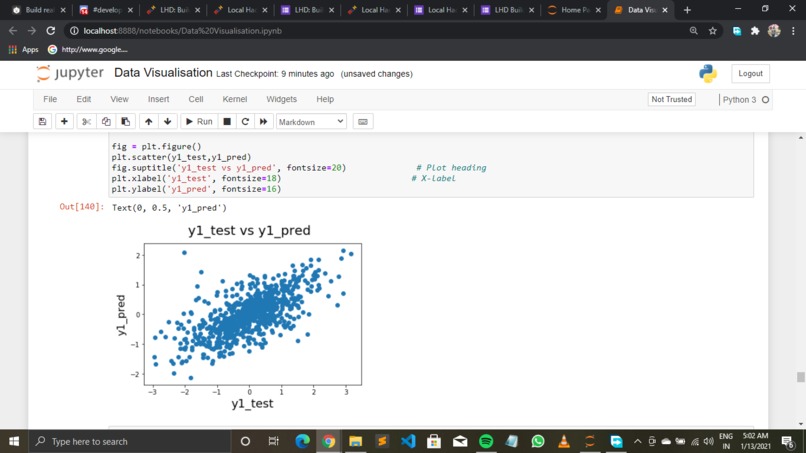
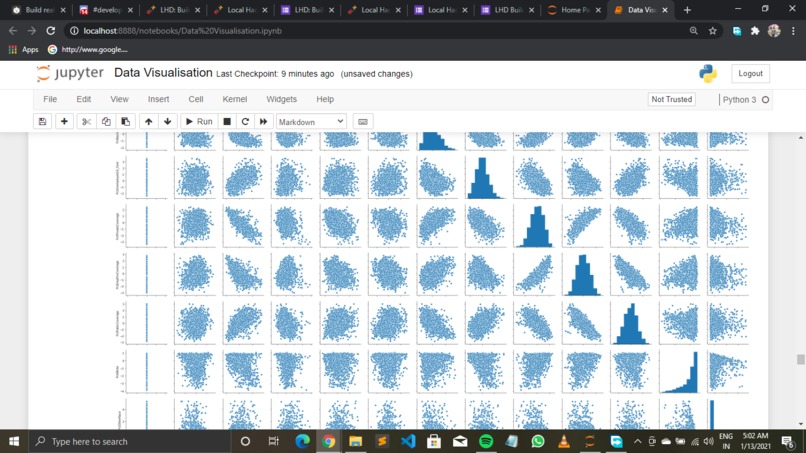
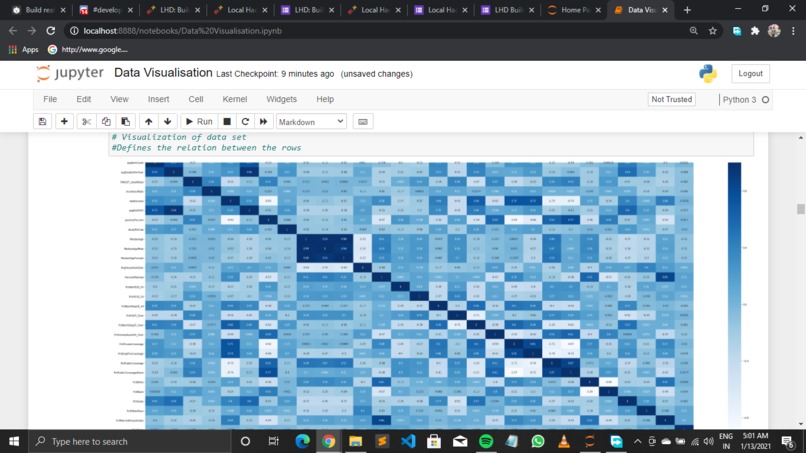
Visualizes the data in the form of heat maps, violin maps, bars, graphs, and many more.
How we built it
I have imported python libraries like Matplotlib and Seaborn to visualize the data imported in csv format.
Challenges we ran into
The attributes mismatch resulted in Traceback of function calls.
Accomplishments that we're proud of
Figuratively visualization of data in the form of heat maps, bars, graphs, violin maps, and many more.
What we learned
I am able to visualize the data graphically.
What's next for Data Visualization Project
Model building and apply machine learning algorithms.
Built With
- matplotlib
- python
- seaborn


Log in or sign up for Devpost to join the conversation.