Data Visualization on US Census Data 1994
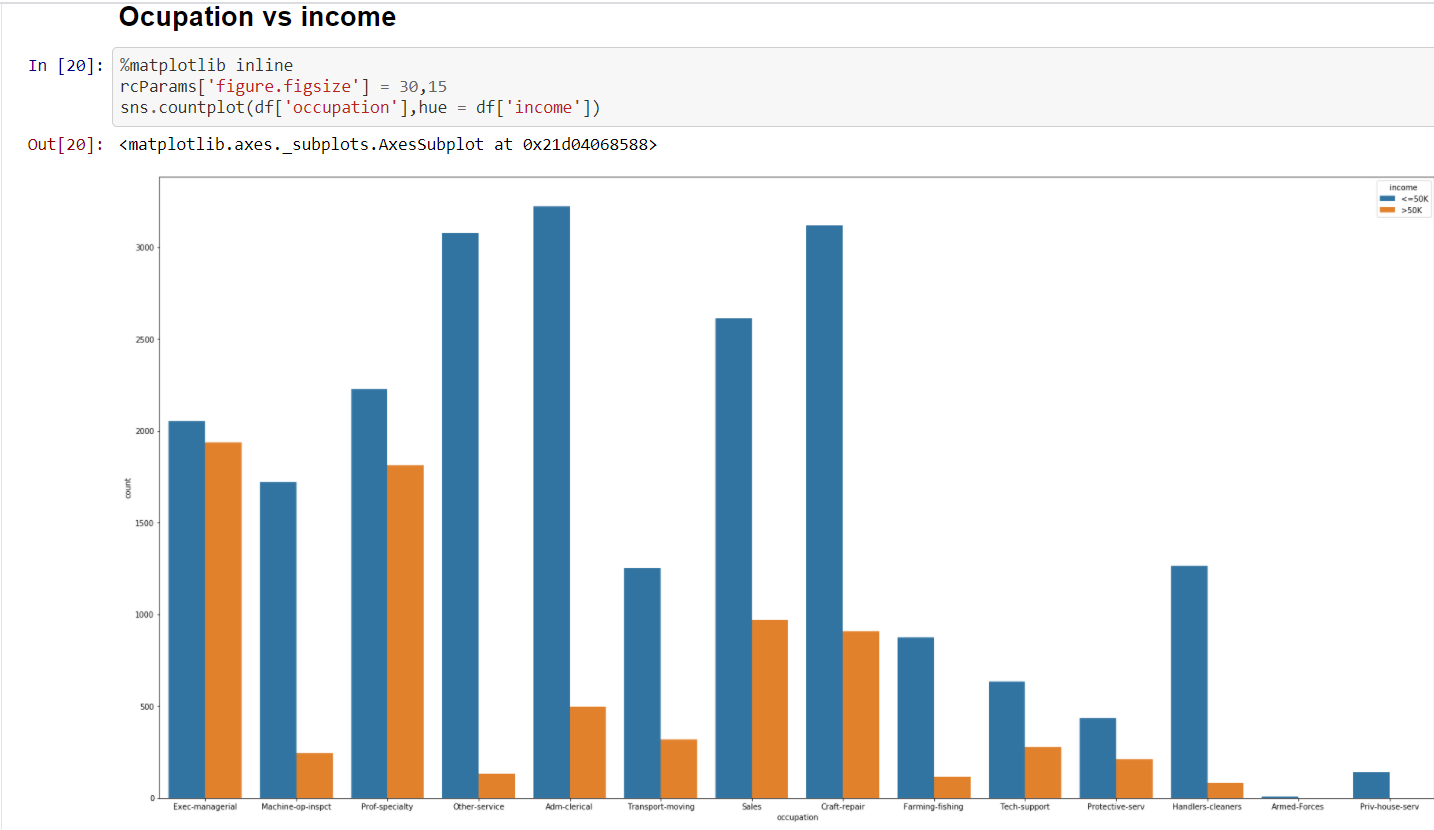
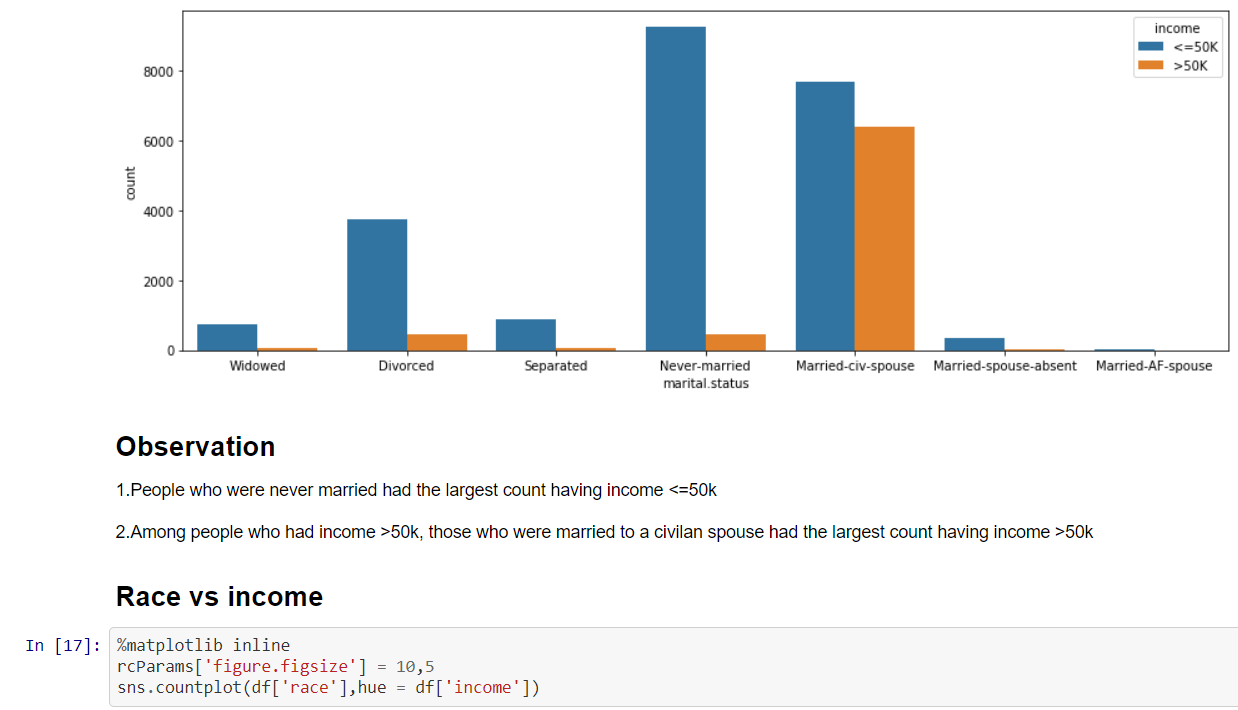
The main aim of study was to analyze people who earned income greater than $50k vs people who earned income less than or equal to $50k

Updates

Leave feedback in the comments!
The main aim of study was to analyze people who earned income greater than $50k vs people who earned income less than or equal to $50k

Leave feedback in the comments!
Log in or sign up for Devpost to join the conversation.