Inspiration
To understand Data
What it does
It helps you understand trends in dataset of passengers
How we built it
Numpy, Pandas, Matplotlib, Seaborn libraries of Python
Challenges we ran into
Deriving conclusions
Accomplishments that we're proud of
We were able to Visualize Data
What we learned
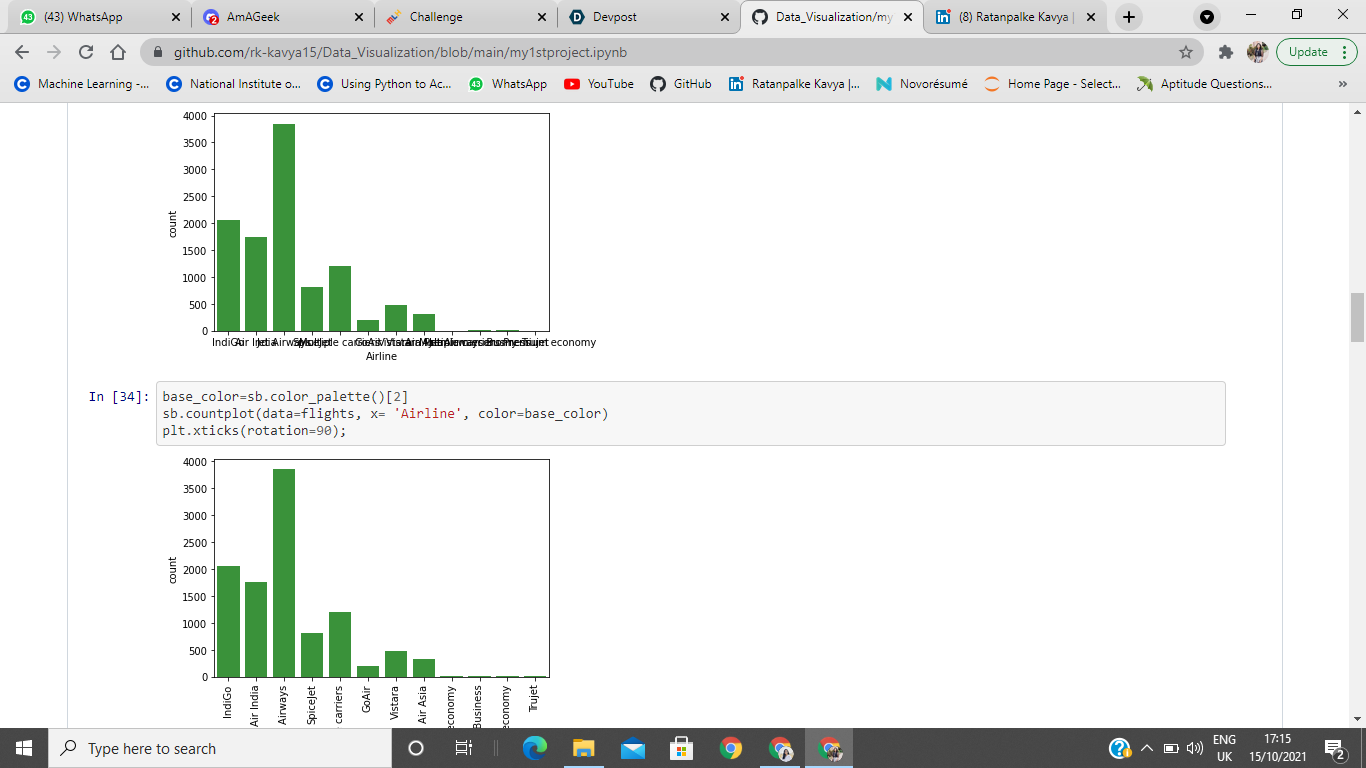
Visualizing Flights Datasets by plotting different features in Bar charts, Pie charts, Histograms, doing modifications, counting missing data

Log in or sign up for Devpost to join the conversation.