-
-
-
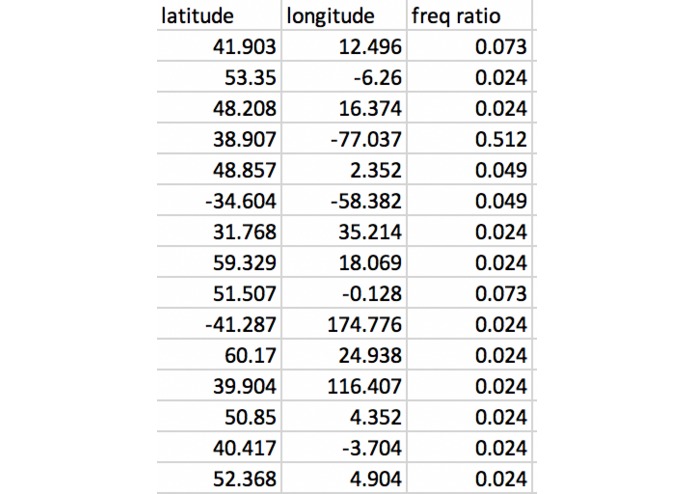
Dataset
-
Inspiration
We were inspired by Google Earth.
What it does
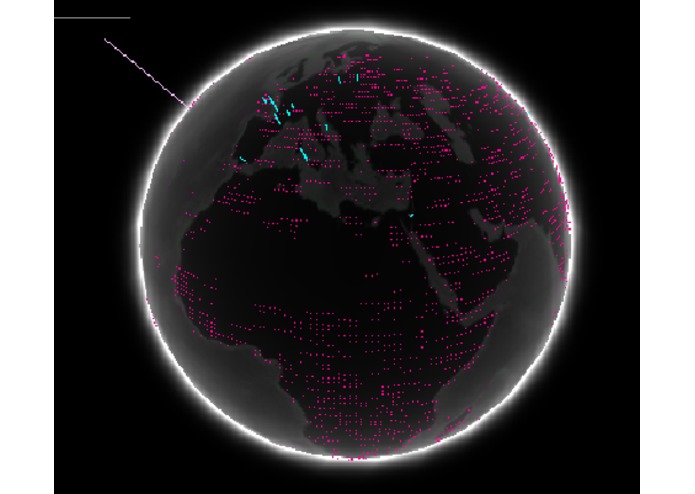
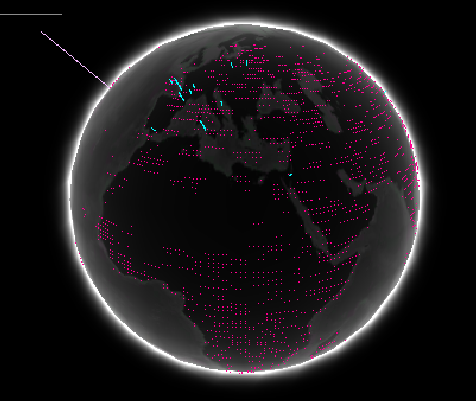
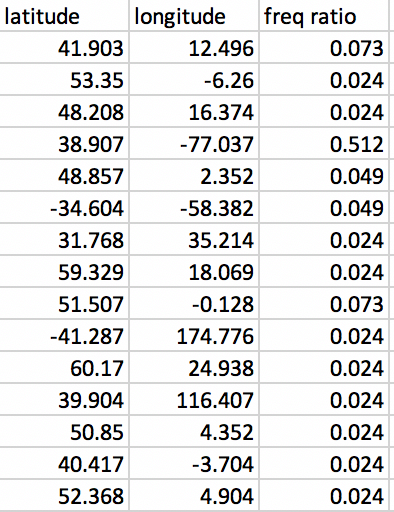
We take the number of price clicks, the number of page views, the number of hotel website clicks, and number of bookings in total and visually show the number on a 3D globe with respect to the location of the corresponding users.
How we built it
We built it using Unity and C#. We used Matlab and python for data calculation and collection.
Challenges we ran into
Because there were a bunch of data, it was difficult to decide on which correlation to make between the user data and the hotel data.
Accomplishments that we're proud of
We're glad we've finished!
What we learned
Prior to this hackathon, we did not know how to deal with data, but now we are able to investigate correlation between some given data and even visualize them!
What's next for Data Visualization on 3-Dimensional Globe
We can apply this project with various combinations of the user data and the hotel data, which will ultimately help TripAdvisor and the hotel to predict and analyze their clients' decisions. We have used the total number of page views and clicks, the country / region the users came from, and the hotel name & location for the 3D globe visualization, but we can also implement this with other data like devices used by the users, dates, and more in the future.


Log in or sign up for Devpost to join the conversation.