-
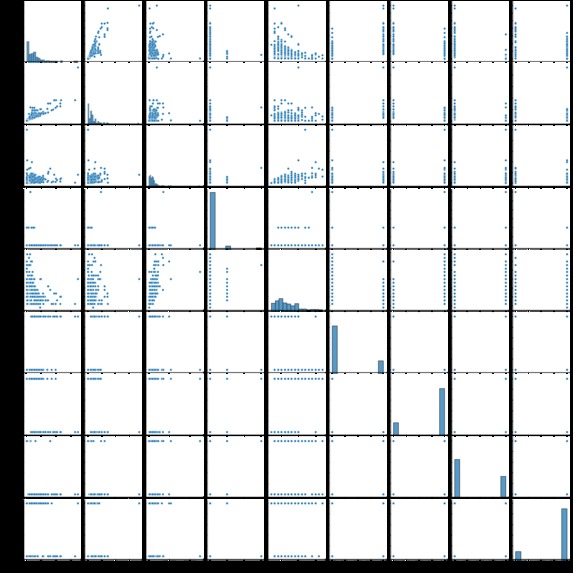
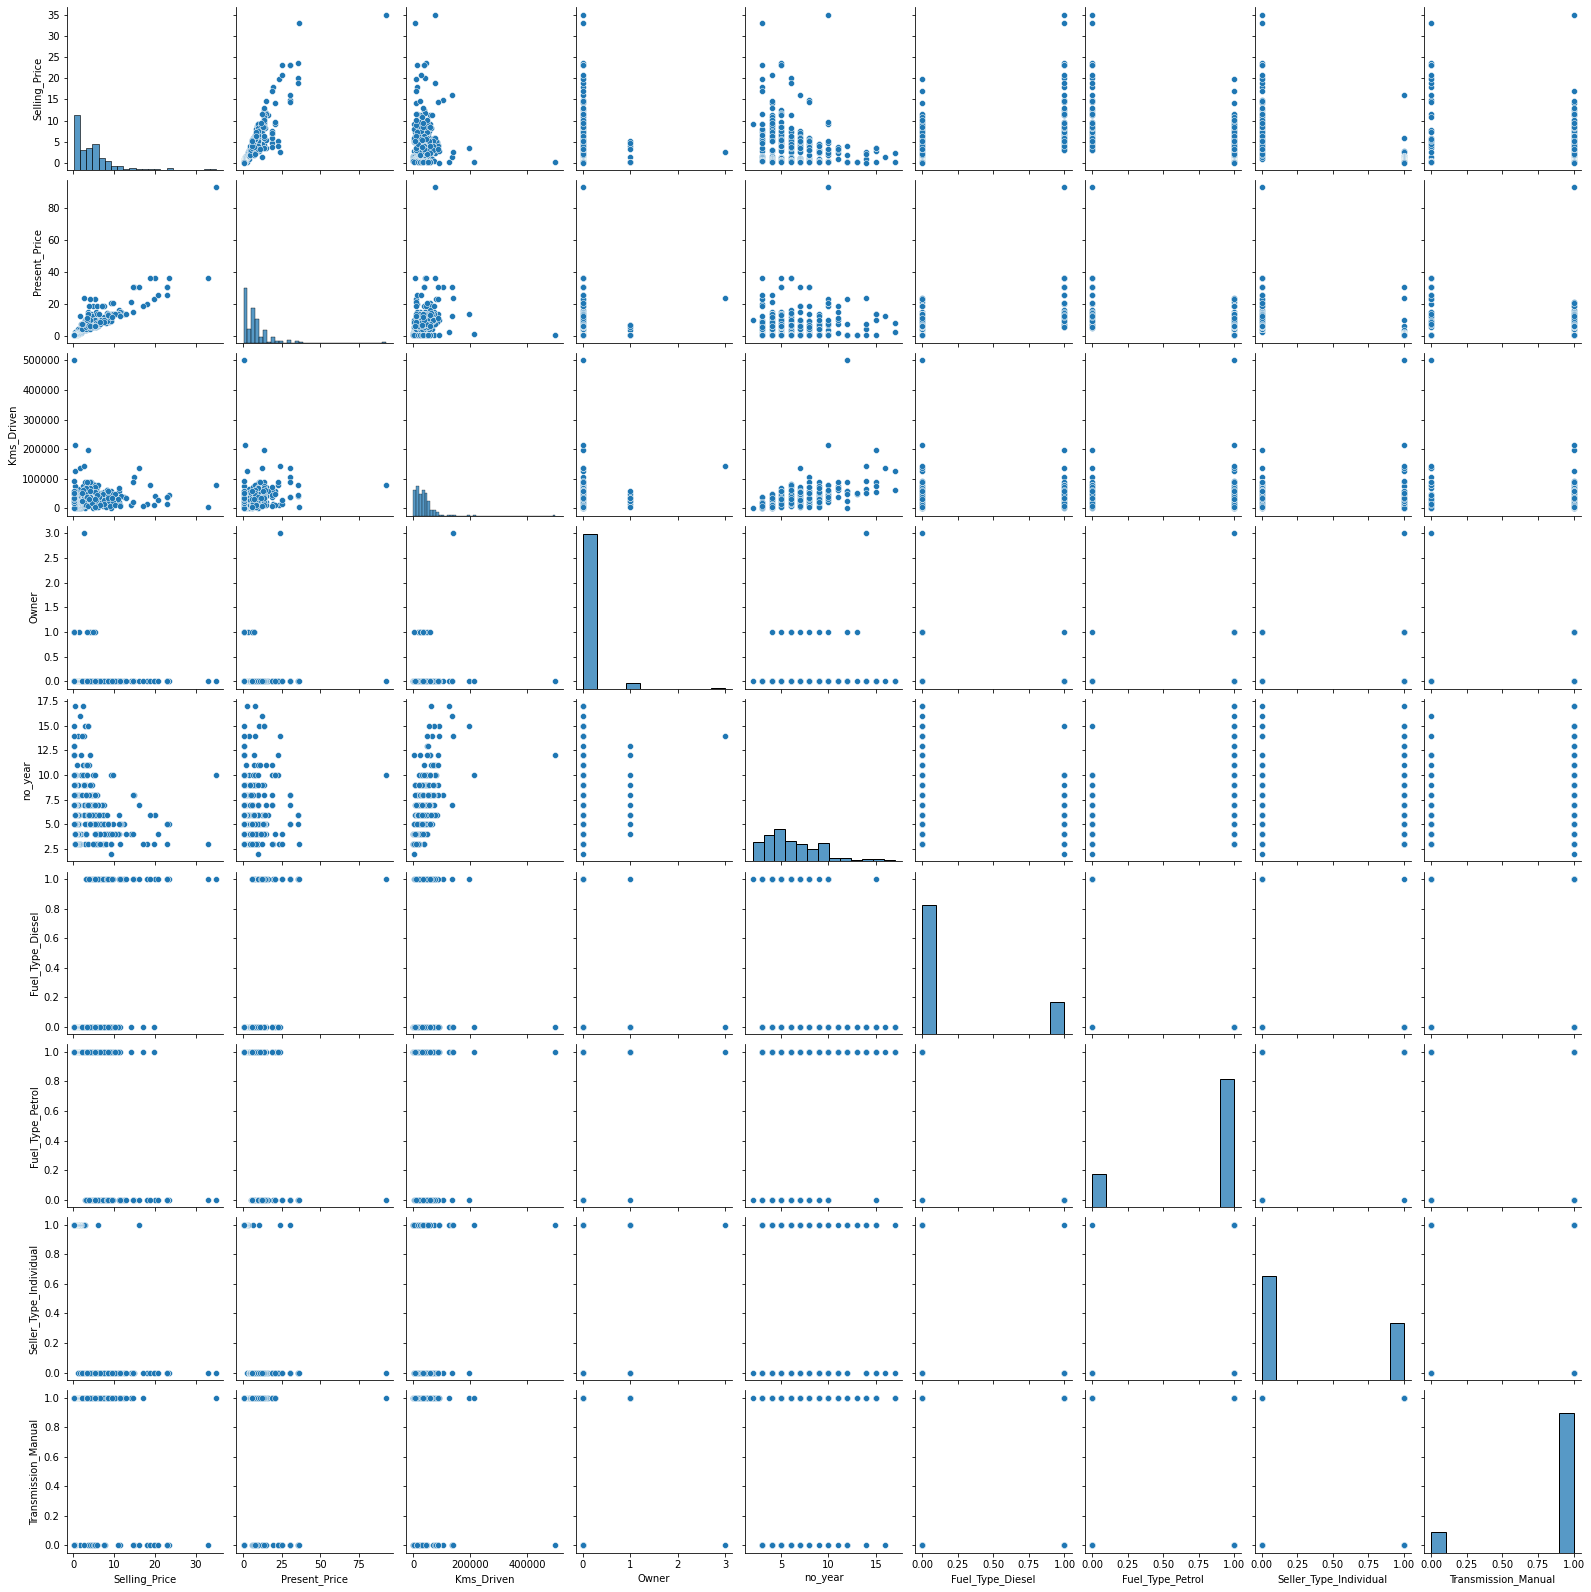
PairPlot
-
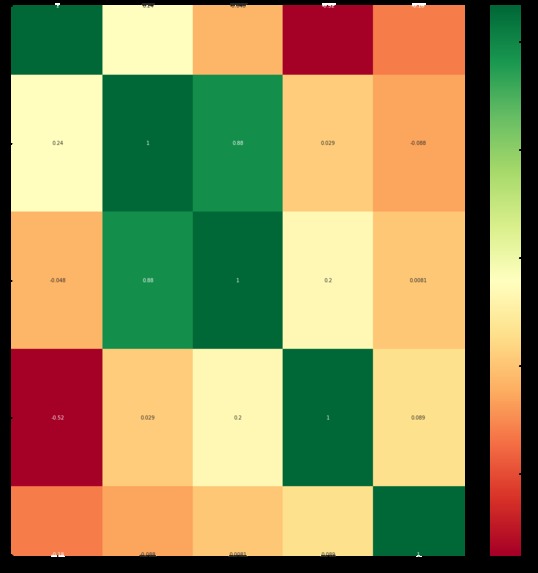
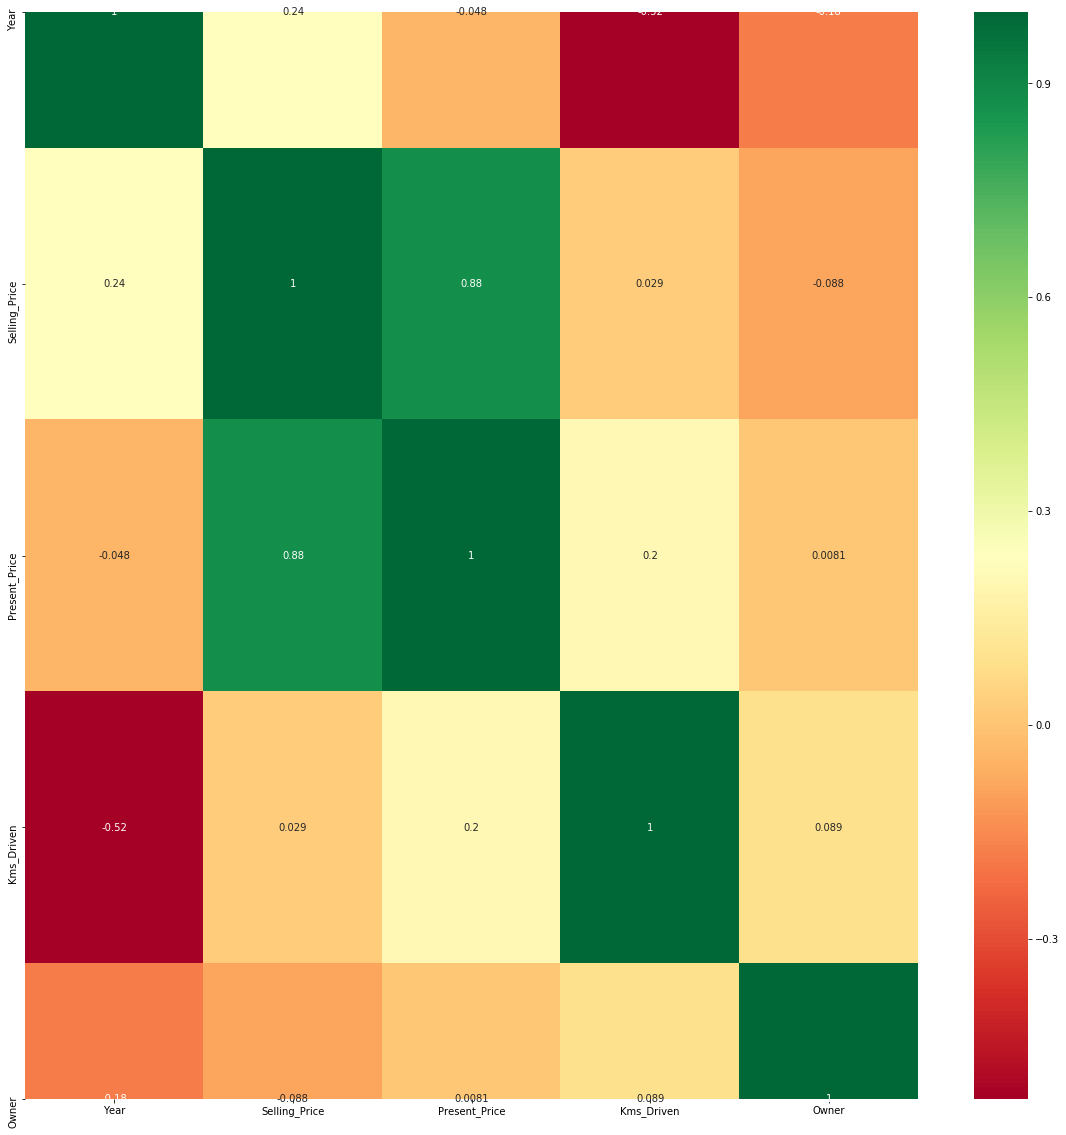
HeatMap
-
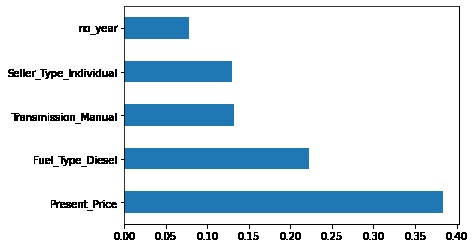
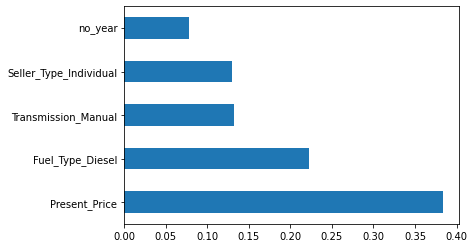
BarGraph
To Complete the day 3 challenge of data visualization of Local Hack day
Visualizes some of the important aspects of DataSet
Using Sklearn, Seaborn and Matplotlib libraries
Cleaned up the data in trainable form for ML Algorithms
It can be further visualized using different type of Data Visualization Libraries.
Built With
- matplotlib
- python
- seaborn
- sklearn

Log in or sign up for Devpost to join the conversation.