-

Data visualization
Data visualization in python
This is the challenge for day 3 of MLH INIT
import numpy as np
import seaborn as sns
# Selecting style as white,
# dark, whitegrid, darkgrid
# or ticks
sns.set( style = "white" )
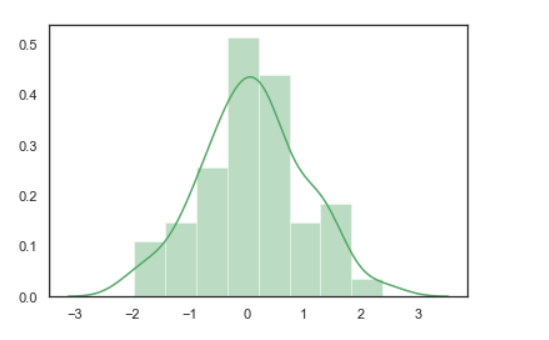
# Generate a random univariate
# dataset
rs = np.random.RandomState( 10 )
d = rs.normal( size = 50 )
# Plot a simple histogram and kde
# with binsize determined automatically
sns.distplot(d, kde = True, color = "g")

Log in or sign up for Devpost to join the conversation.