-
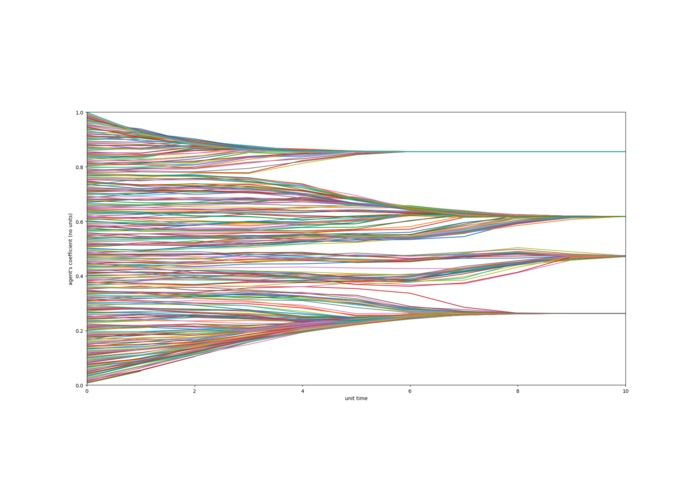
An example of opinion polarization

Inspiration
In this program we aim to simulate different models of opinion formation within an interacting population.
What it does
We consider each individual, or agent, in the population to have some opinion between 0 and 1 which they update based on the opinions of all other agents in the population. To normalize this updating each agent has a weight associated with all other agents such that agent i's
How we built it
We mainly used python to visualize the data, using different libraries to graph multiple complex plots in a simple and visually appealing manner.
Challenges we ran into
Understanding where to visualize data using different python libraries.
Accomplishments that we're proud of
Understanding complex mathematical models and knowing how to display them in a visually appealing manner. Implementing the limitations and being aware of its parameters and how it affects the data.
What we learned
A lot of numerical analysis and its limitations.
What's next for Data Visualization of Opinion Polarization
Implementing an improved user interface in order to make it more user-friendly. Use other models so that we can easily generate simulations that are easy to compare with each other.

Log in or sign up for Devpost to join the conversation.