Inspiration
Topographical properties and statistics can help researchers in knowing about the history of a planet.
What it does
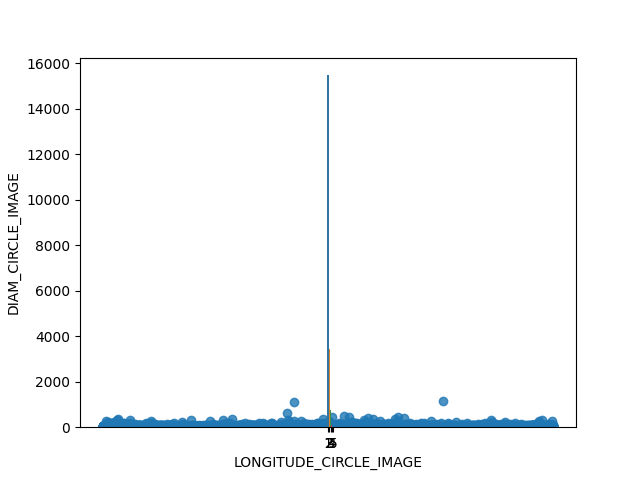
It plots the data about number of layers and the frequency of craters, along with a scatter plot for diameter and longitude.
How we built it
Using Python, Pandas, Seaborn
What's next for Data Visualization of Martian Craters
We can add some Inferential analysis to it!

Log in or sign up for Devpost to join the conversation.