-
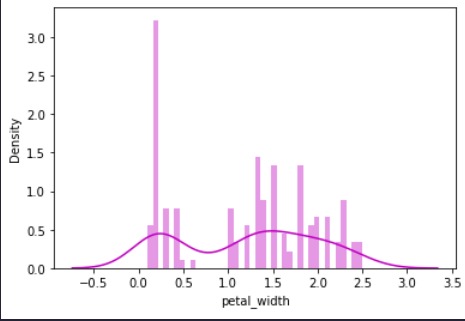
Histogram
-
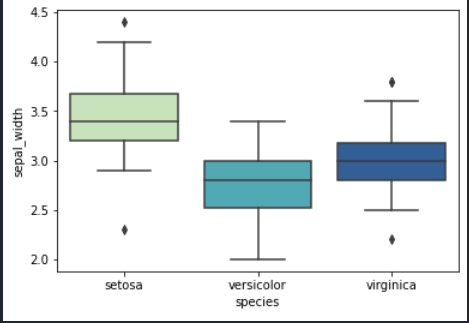
Box Plot
This is a data visualization using the Iris dataset, inbuilt in Seaborn
Built With
- python
- seaborn
This is a data visualization of the iris dataset

Histogram
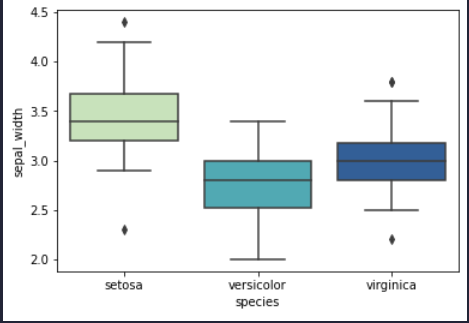
Box Plot
This is a data visualization using the Iris dataset, inbuilt in Seaborn

Leave feedback in the comments!

Log in or sign up for Devpost to join the conversation.