-

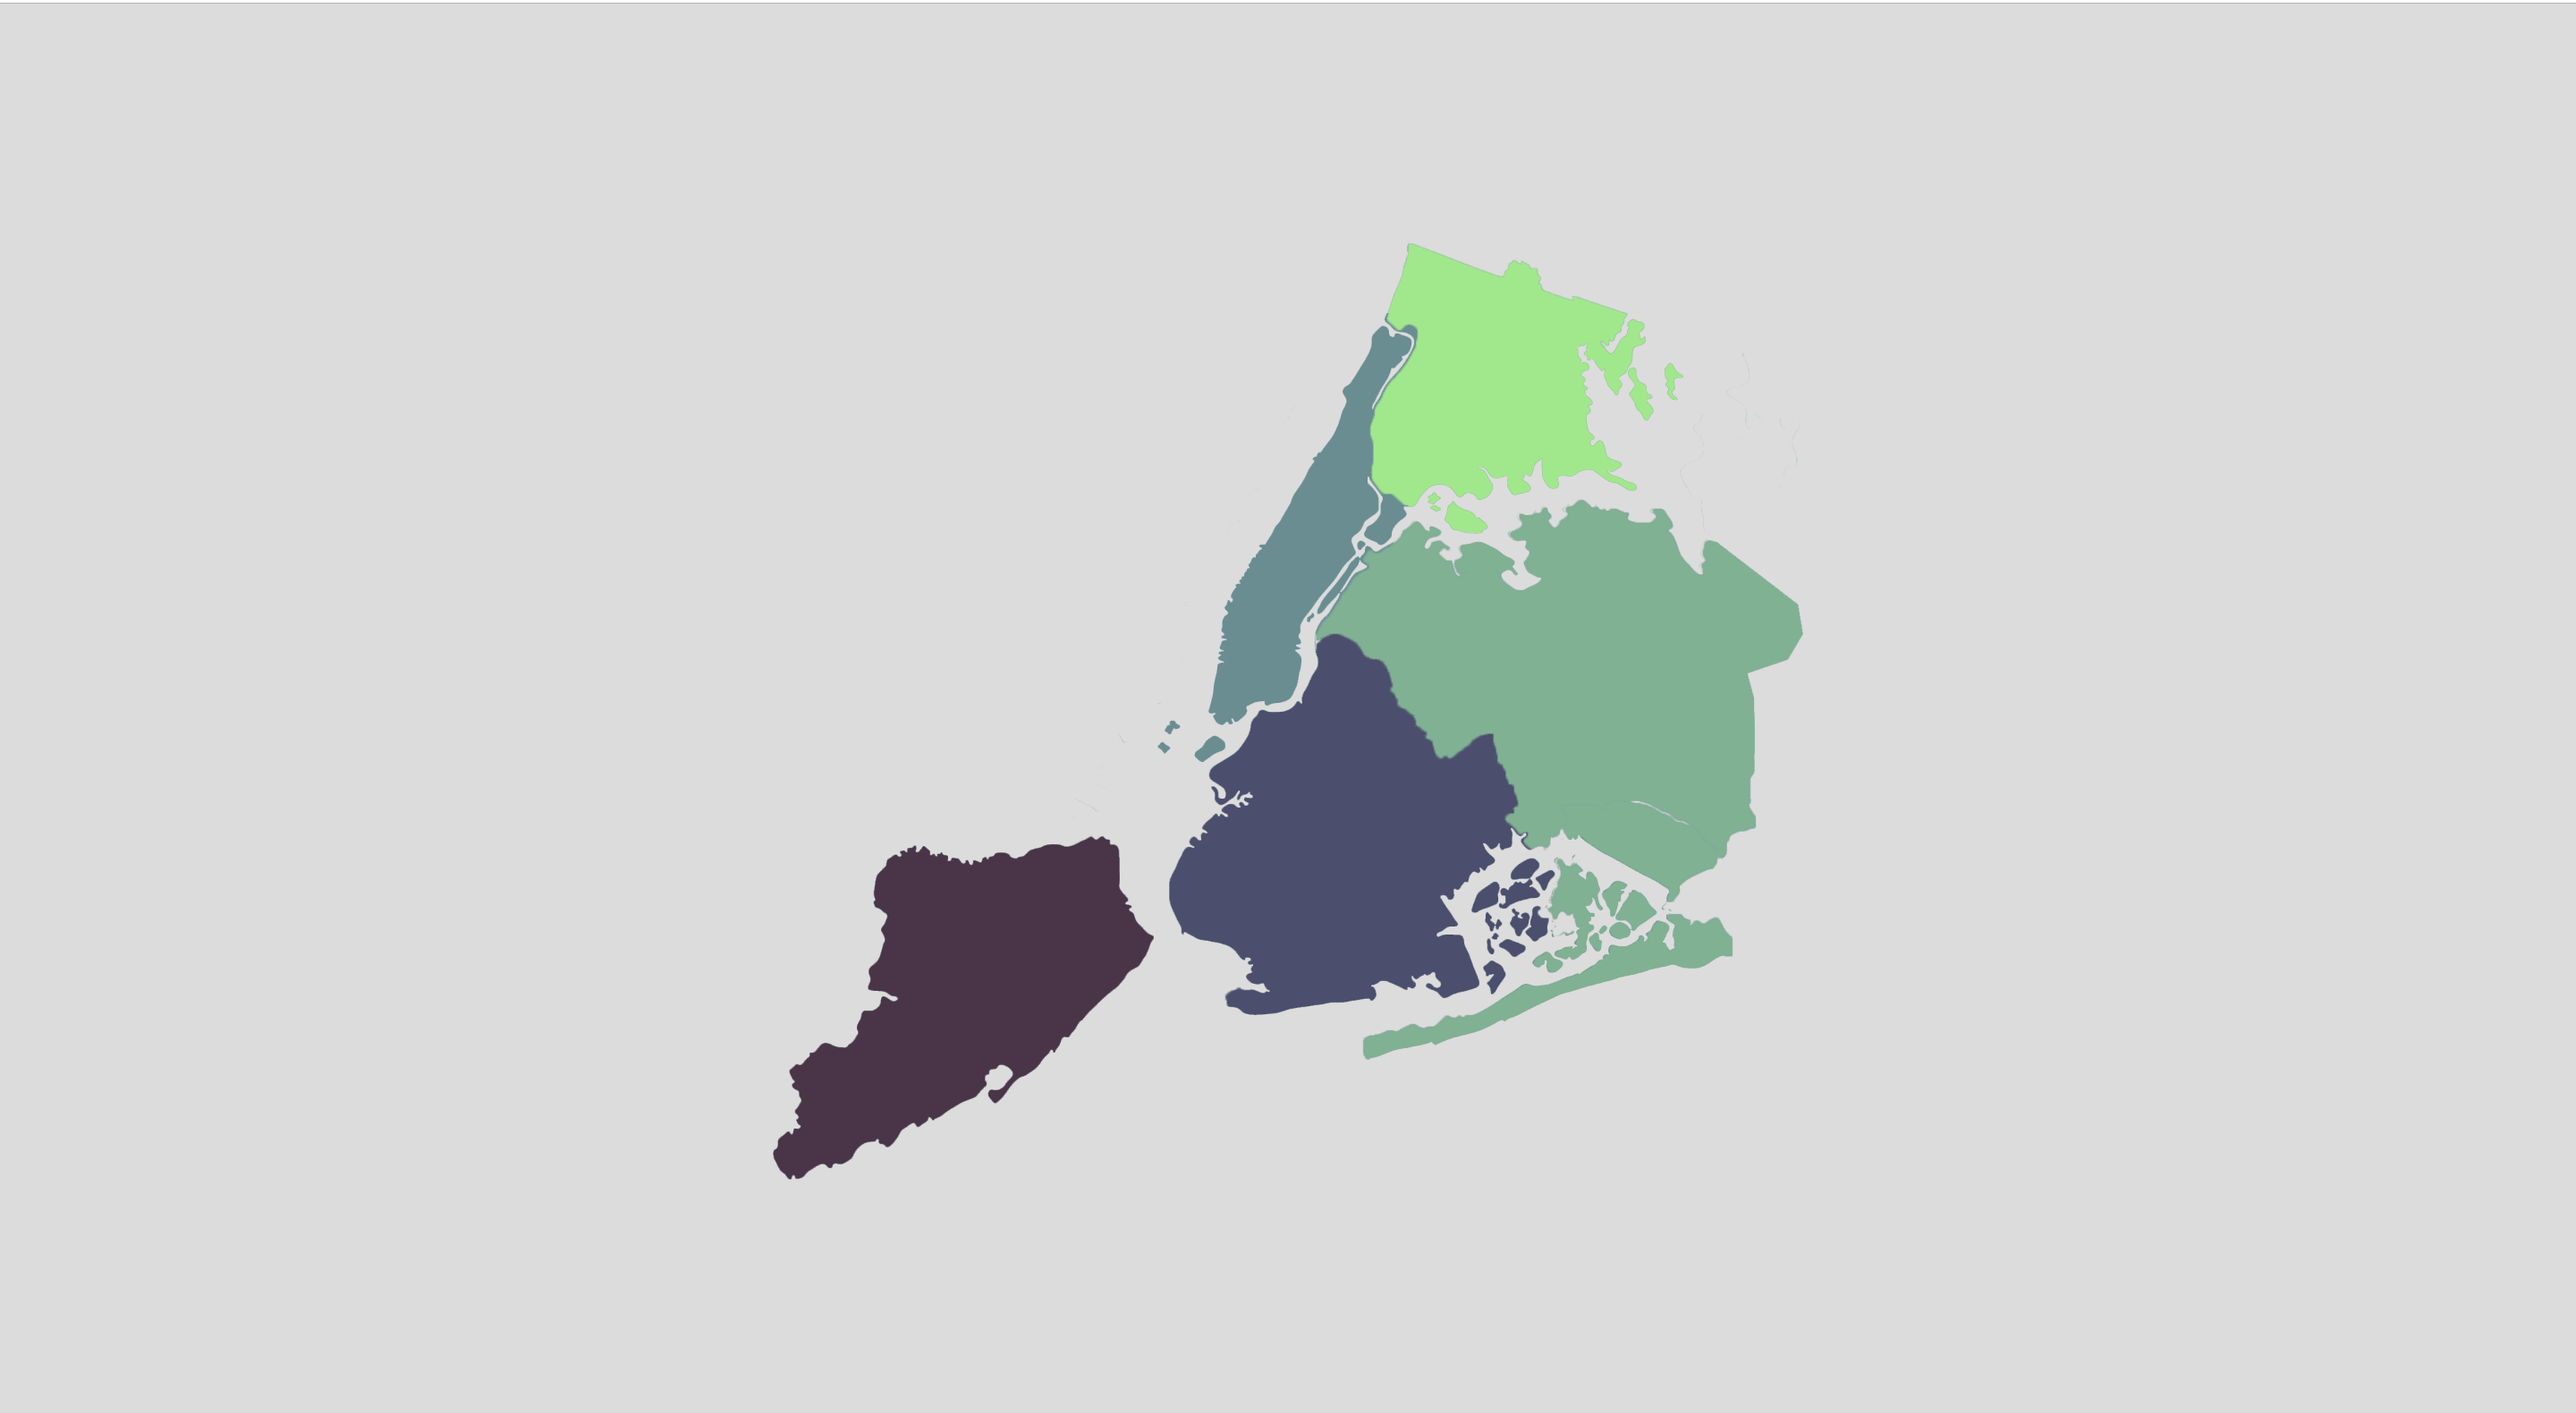
Current progress in the Data Visualization
-

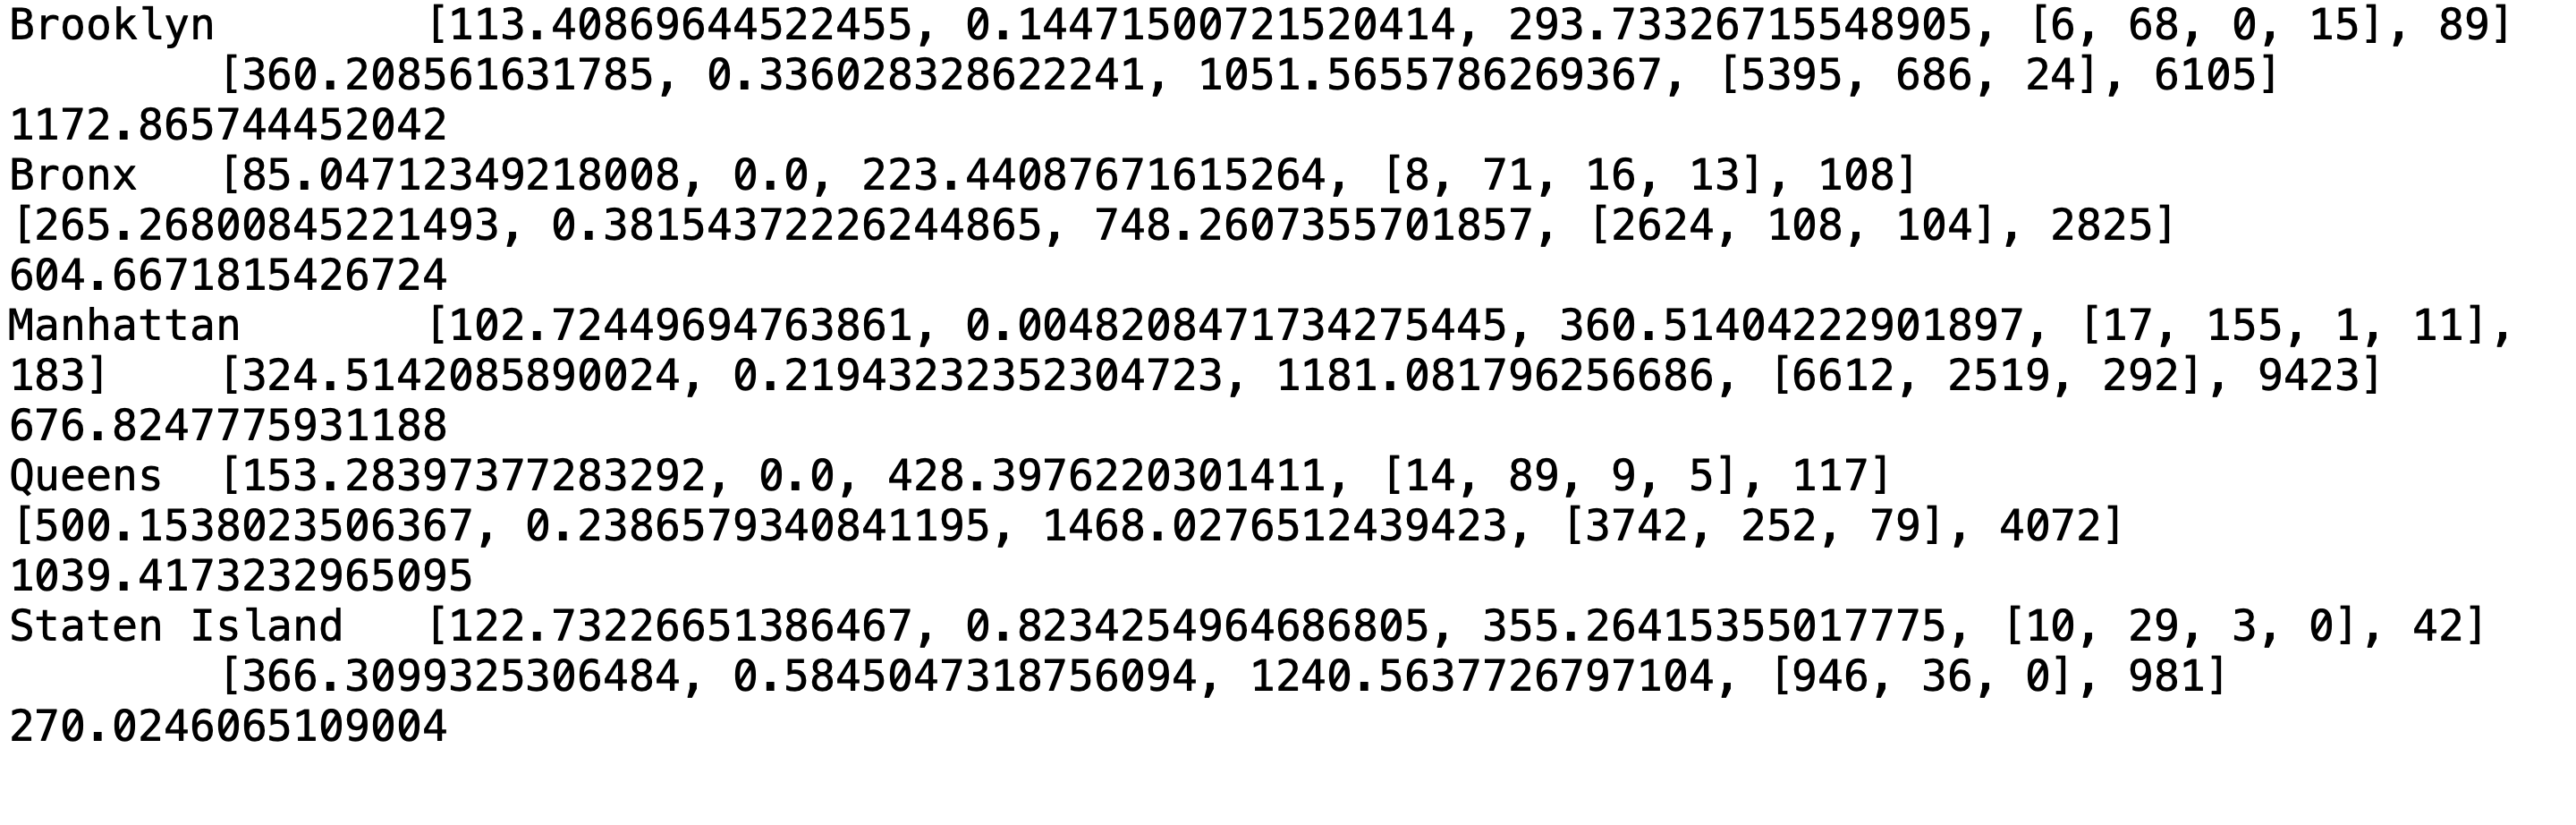
Results.txt
Inspiration
Two years ago, I studied the distribution of public trash and recycling bins in disadvantaged neighborhoods throughout New York City using GIS Software. I wanted to continue this study using more updated NYC Open Data.
How I built it
I took 3 data sets from NYC Open Data and analyzed them in python. I created txt file which I am then reading in javascript on the web to create visualization in p5.js.
Challenges I ran into
Time Constraints
Accomplishments that I'm proud of
Being able to still present despite being able to finish my project


Log in or sign up for Devpost to join the conversation.