-
Data Visualization

Inspiration
Data Visualization plays one of the main roles in Data Science and contributes to an understanding of data and its relation with other factors.
What it does
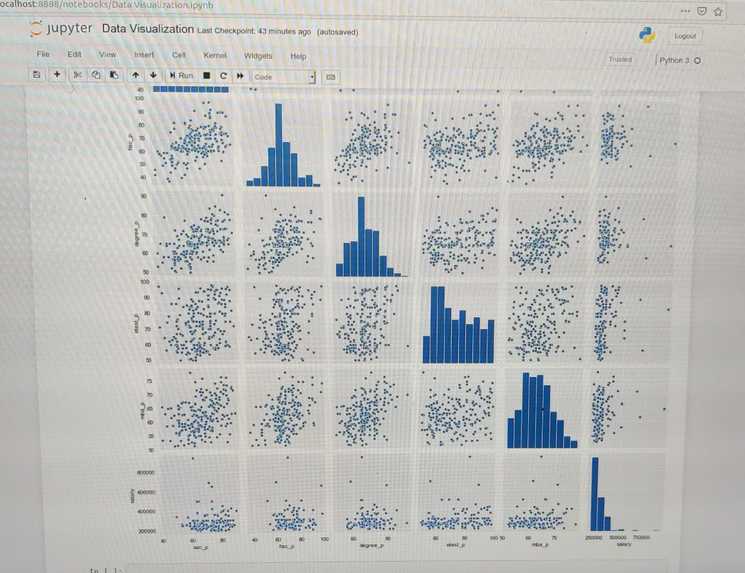
It is the complete visualization of the dataset.
How we built it
The notebook is built in python with libraries like seaborn, matplotlib, and plotly.
Challenges we ran into
To find the right graph for each relation.
Accomplishments that we're proud of
The complete and through visualization of data.
What we learned
In depth knowledge of Seaborn.
What's next for Data-Visualization
Addition of more data to it.

Log in or sign up for Devpost to join the conversation.