Inspiration
Climate Change
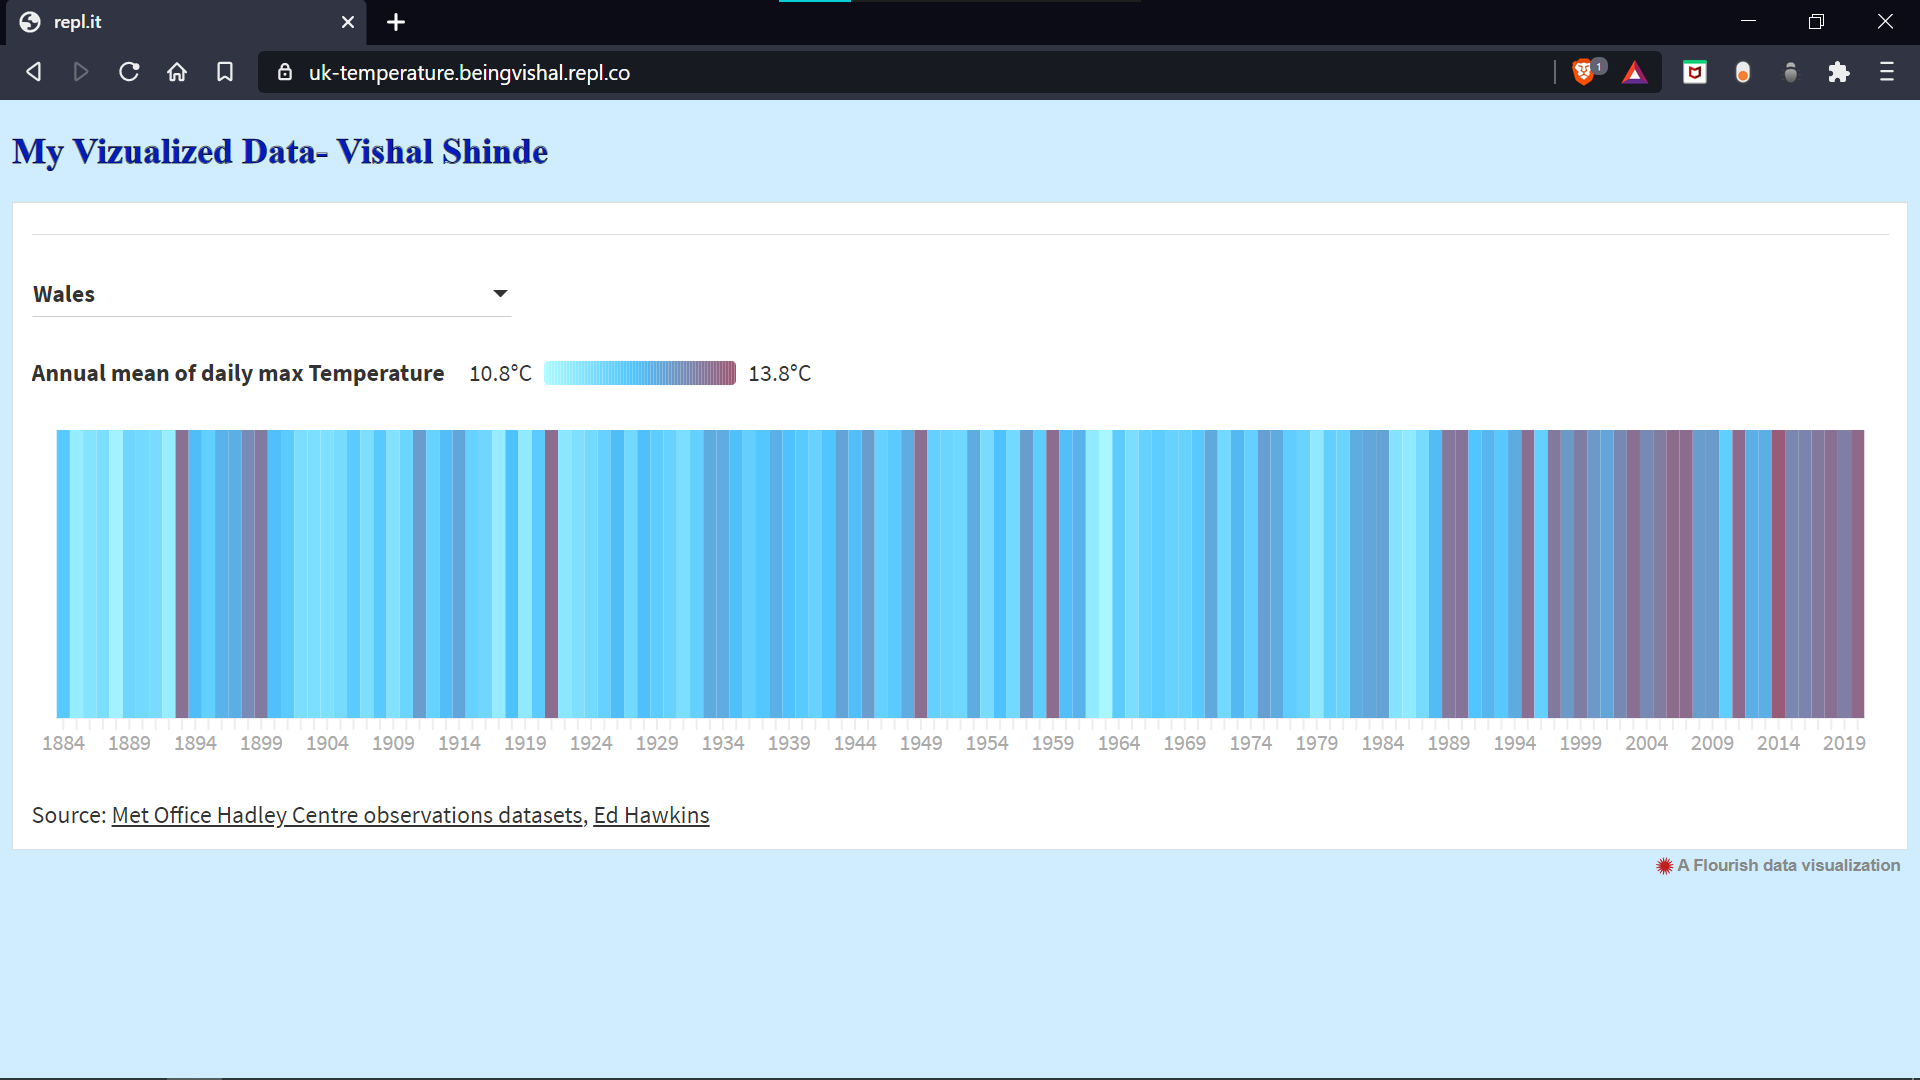
What it does
Visualizes Date into interesting graphs rather than boring excel sheets
How we built it
Using Flourish
Challenges we ran into
Assigning the columns with proper axis
Accomplishments that we're proud of
Made my friends aware about a major reason which contributes to Climate Change
What we learned
To contribute for causes and create awareness with an interesting and fun way
What's next for Data Visualization
Next I am thinking to make a project on deforestation.

Log in or sign up for Devpost to join the conversation.