-
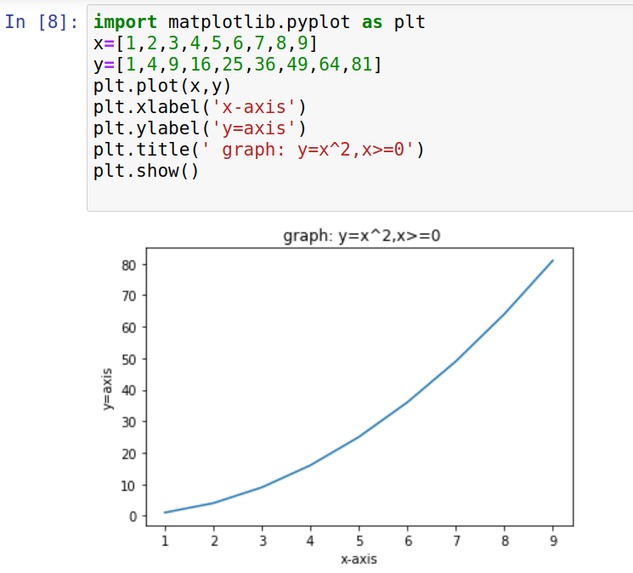
showing graph in jupyter notebook

Inspiration
interest in matplotlib
What it does
visualize data set in a graph
How we built it
using matplotlib (python)
Challenges we ran into
setting up jupyter ide
Accomplishments that we're proud of
created a graph y=x^2
What we learned
plotting a graph using matplotlib
What's next for Data Visualization
plot more complex graphs
Built With
- matplotlib
- python


Log in or sign up for Devpost to join the conversation.