-
-
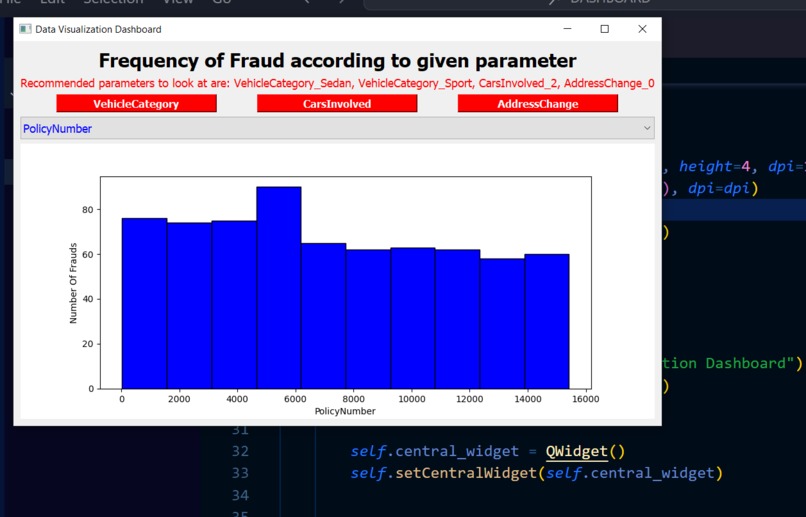
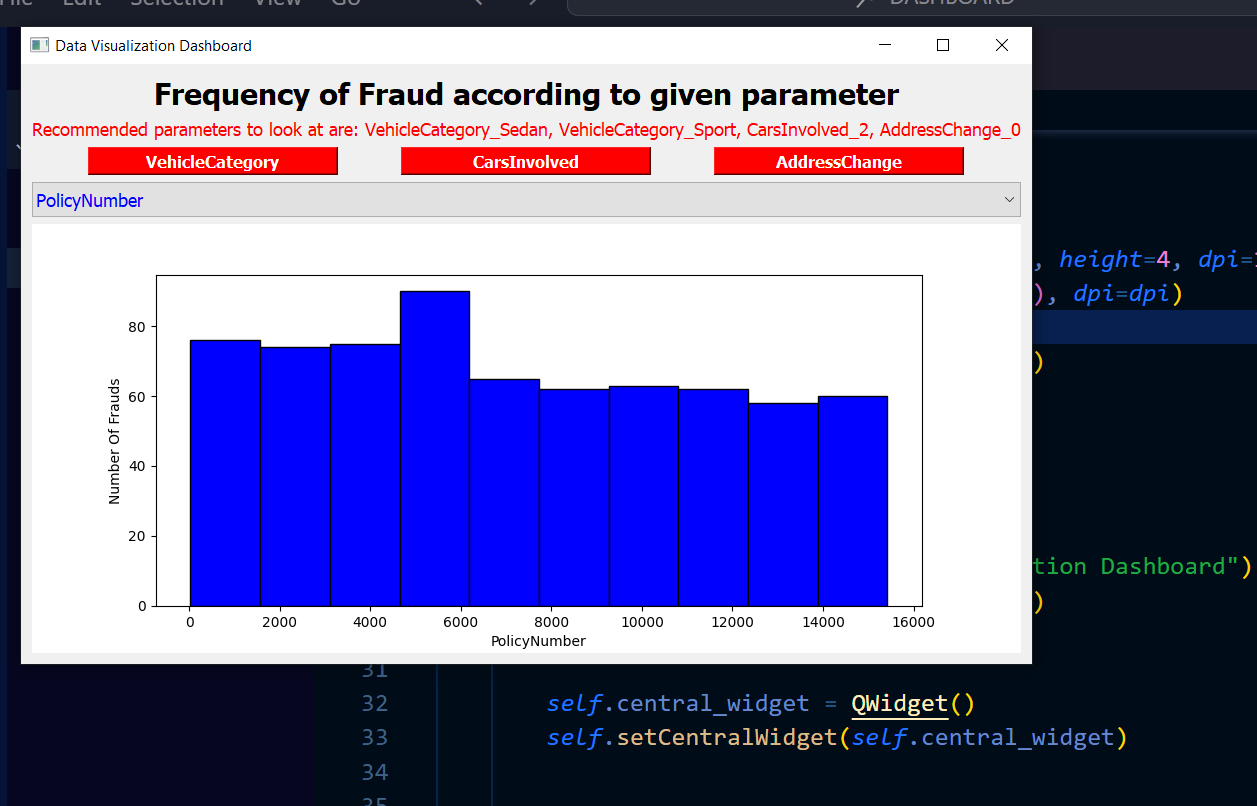
snippet of the interface
Inspiration
Actuaries are highly resistant to adopting ML in their practices, we wanted to attempt to incorporate a part of that into this project. To keep things simple, we start with making a recommendation, and then displaying the corresponding graph for an insurance company. Actuaries will hopefully be able to use this app to explore their data more efficiently.
What it does
This app displays the data in a graph and then recommends a few features the user can focus on, or perform further investigations on. Of course, they are also free to simply use it to visualize their data.
How we built it
This was built in Python. The app was built using PyQt5 and plots generated using matplotlib. Initial exploration of the data can be found in a Jupyter Notebook, which also contains any other Python libraries that were used, namely ones required for PCA and any data preprocessing.
Challenges we ran into
One key challenge was the unintuitive nature of some of the recommendations, caused by the nature of machine learning in general, as no one actually understands how it works. Code integration was also a challenge as always.
Accomplishments that we're proud of
This project! We are proud to have completed a decent project within the given time, showing off what we know! Especially glad we got all the buttons on the interface working as they should i.e. dropdowns, recommendation buttons, etc.
What we learned
We learned a great deal about using PyQt5 and matplotlib within the capacity of app development, as well as gained some insights on automating data cleaning. A lot was also learned about the field itself, as insurance fraud data is unique in that it is highly rare, and this requires special accomodations.
What's next for Data Visualization Dashboard for Insurance Companies
Next goal for this project would be to ensure its practical functionality with other datasets as well, so the user may visualize any dataset they enter, as well as including the corresponding user interface for it. This will require more rigourous preprocessing as data doesn't usually come in a nice format. From there, we want to expand on its current features to perform more actuarial processes and make even better suggestions, or even build models using AI/ML.
Built With
- matplotlib
- pyqt5
- python


Log in or sign up for Devpost to join the conversation.