-
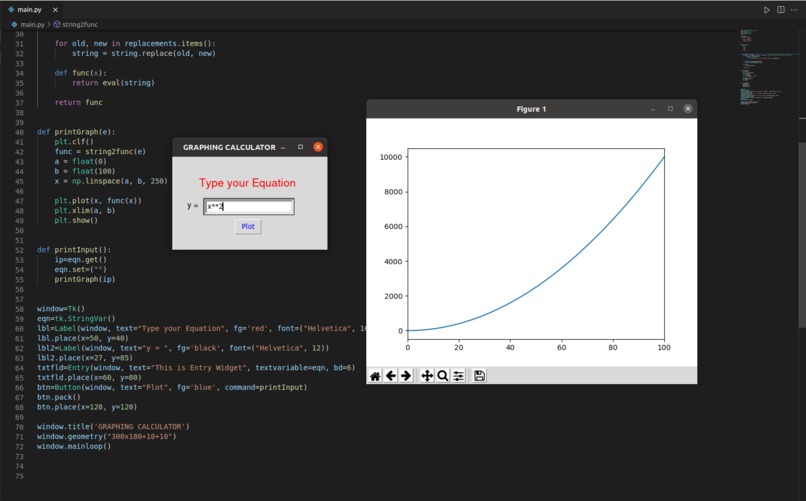
graphing_calci_exp
-
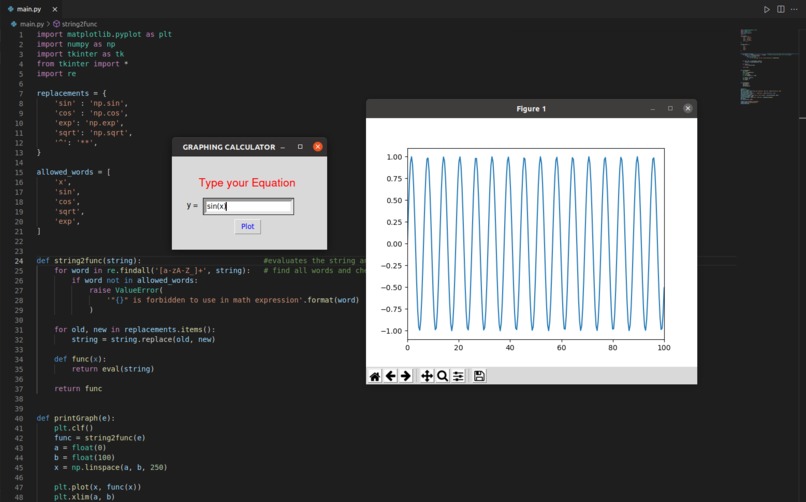
graphing_calci_trig1
Inspiration
Urge for more exploration in the Python language.
What it does
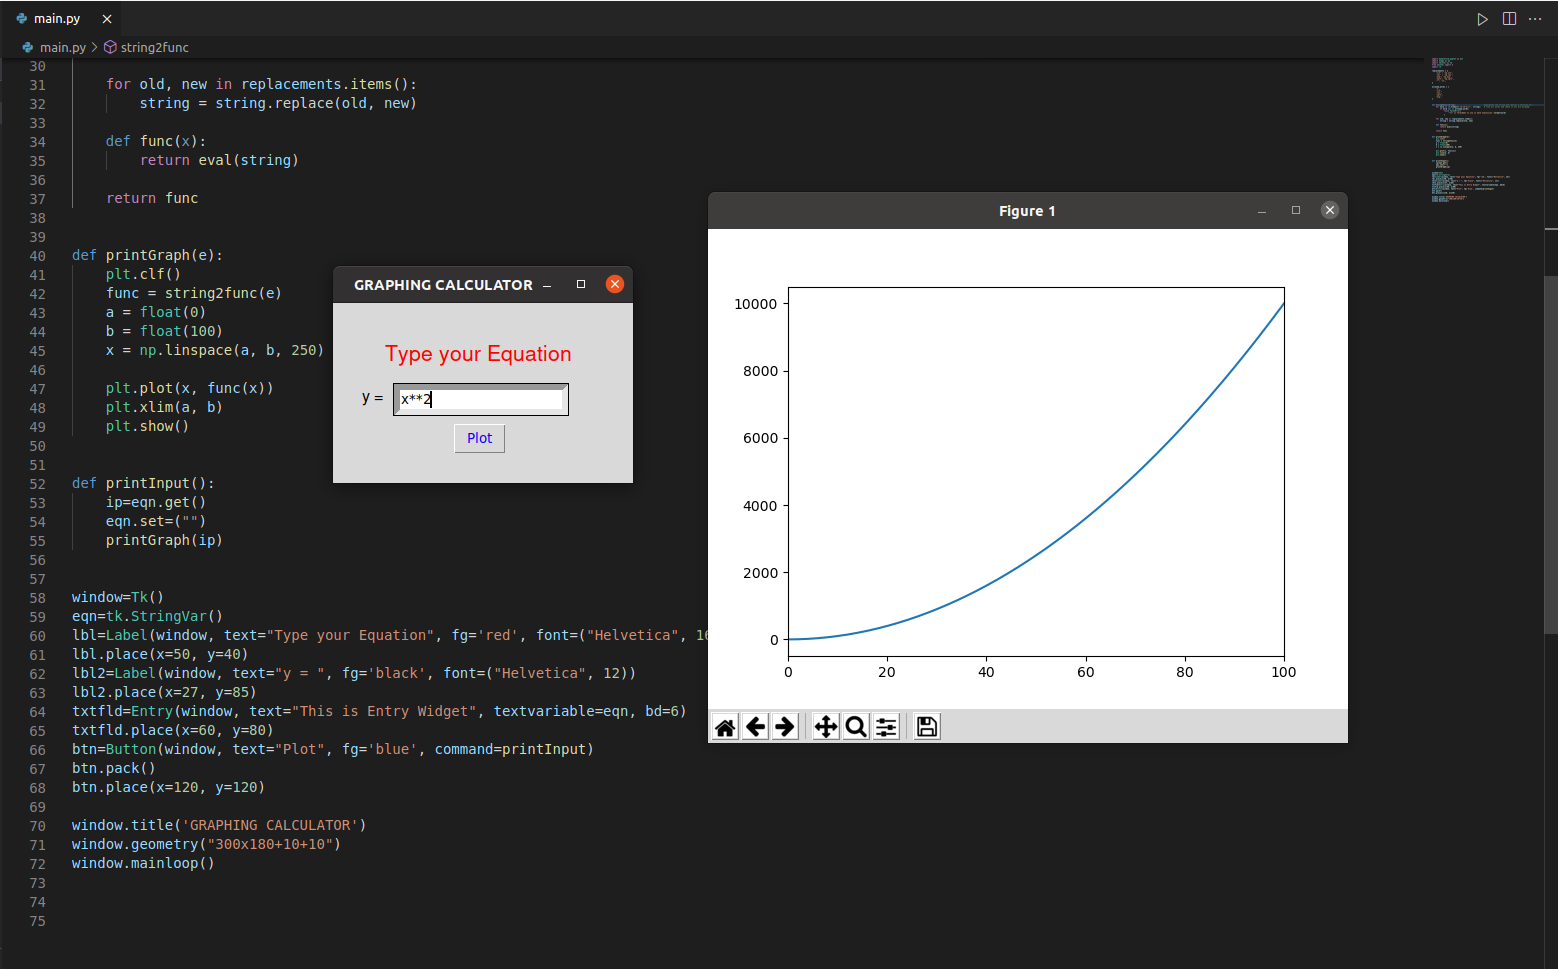
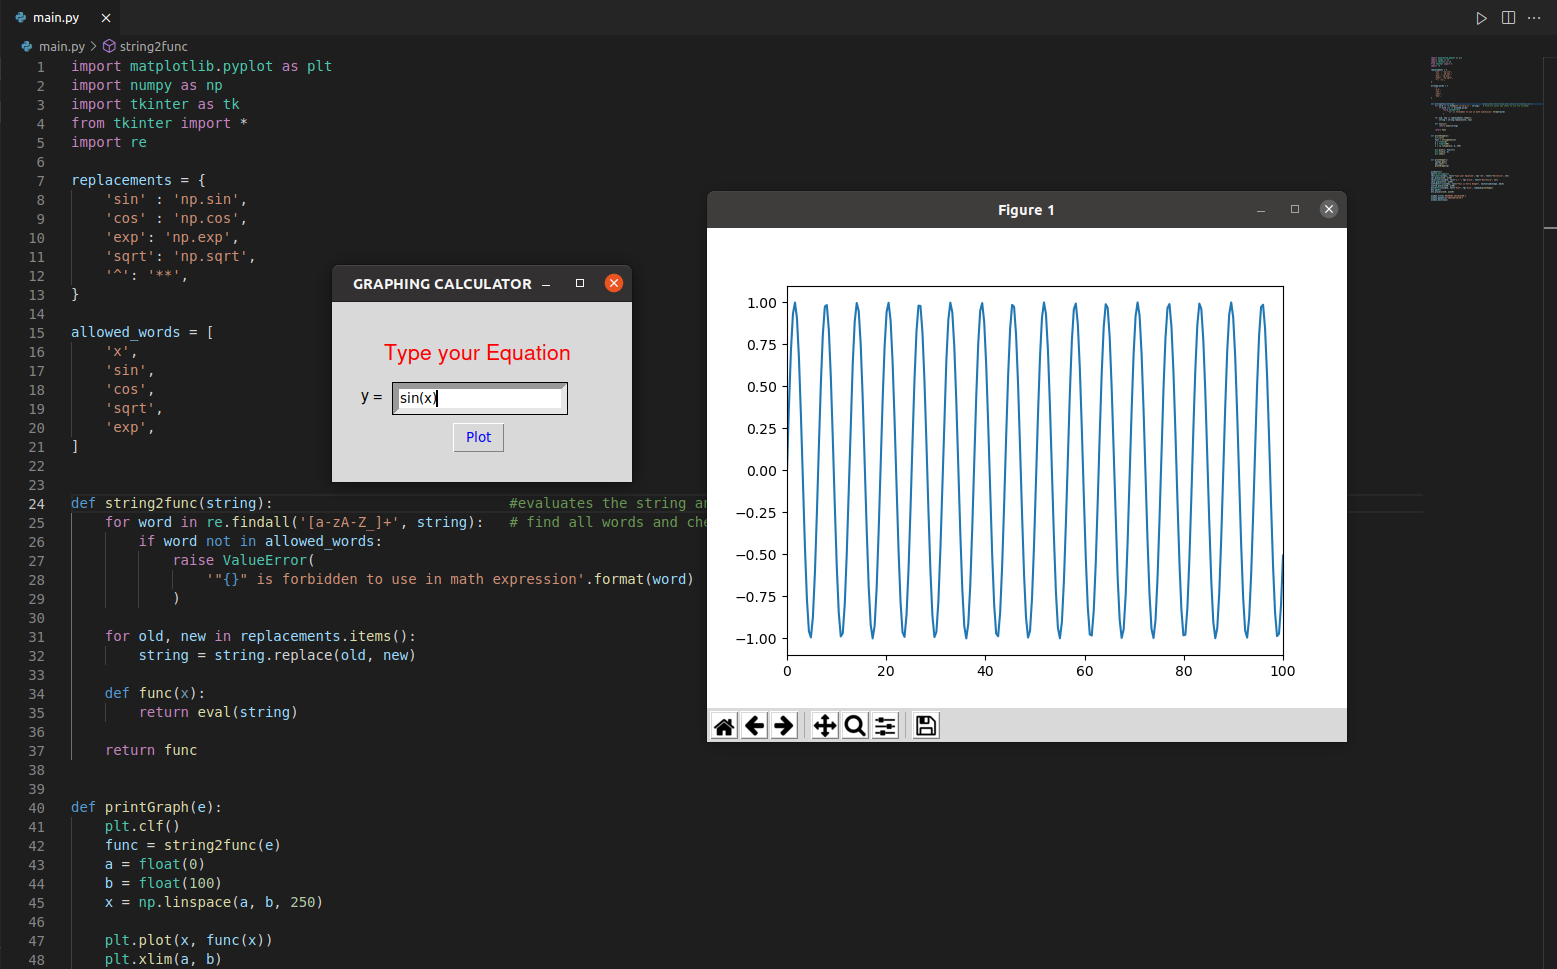
It is a Graphing Calculator that plots a graph for input equations.
How we built it
The project was built purely using python3 language.
For the initial GUI and data input, the Tk GUI toolkit was used.
The input is then checked for discrepancies and modified.
The graph is calculated using NumPy library and output is shown using Matplotlib library.
Challenges we ran into
Creation of GUI using Tk was the most difficult challenge.
Conversion of input data into a usable format was the second-most difficult challenge.
What we learned
Usage of Tk toolkit for GUI creation and gained experience in methods of data visualisation.
What's next for Data Visualization
Currently the calculator can only accept specific kinds of mathematical operations for safe functioning, and the range for x is also fixed. Hence, the next step would be to expand its repertoire and imrove its GUI to allow more versatility.

Log in or sign up for Devpost to join the conversation.