Inspiration
Cervical cancer is common in society. Some of the symptoms can be traced by certain behavioural pattern.
What it does
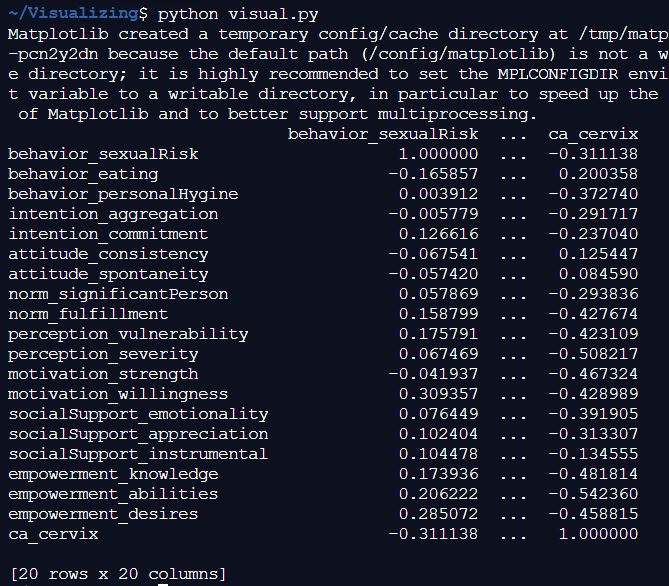
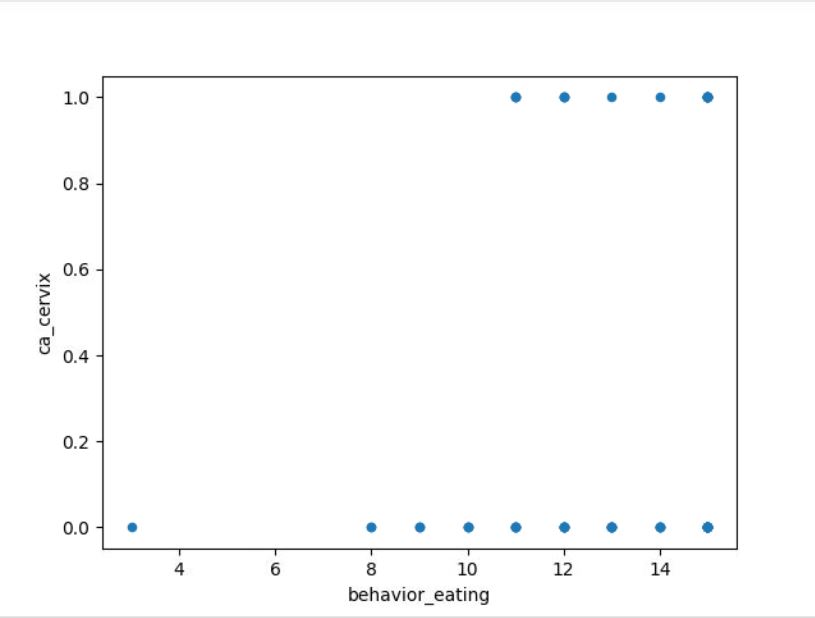
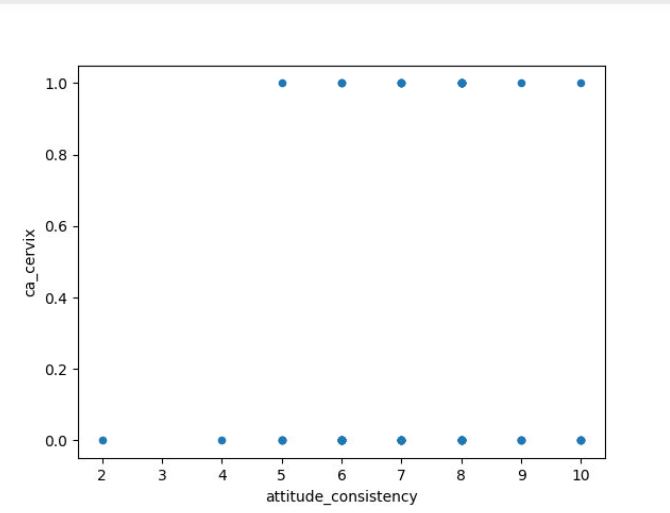
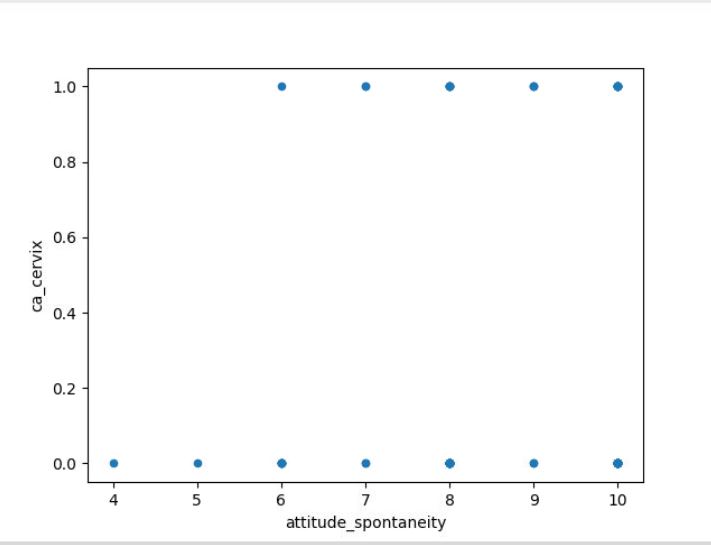
It finds a correlation of behaviours with the cervical cancer data.
How we built it
Built it by finding data on UCI Machine Learning Repository Then by using matplotlib and pandas library in python performing analysis.
Challenges we ran into
Plotting multi-variate data.
Accomplishments that we're proud of
First visualization project
What we learned
Learned about knowledge discovery process
What's next for Data Visualization
Improved version with well documentation

Log in or sign up for Devpost to join the conversation.