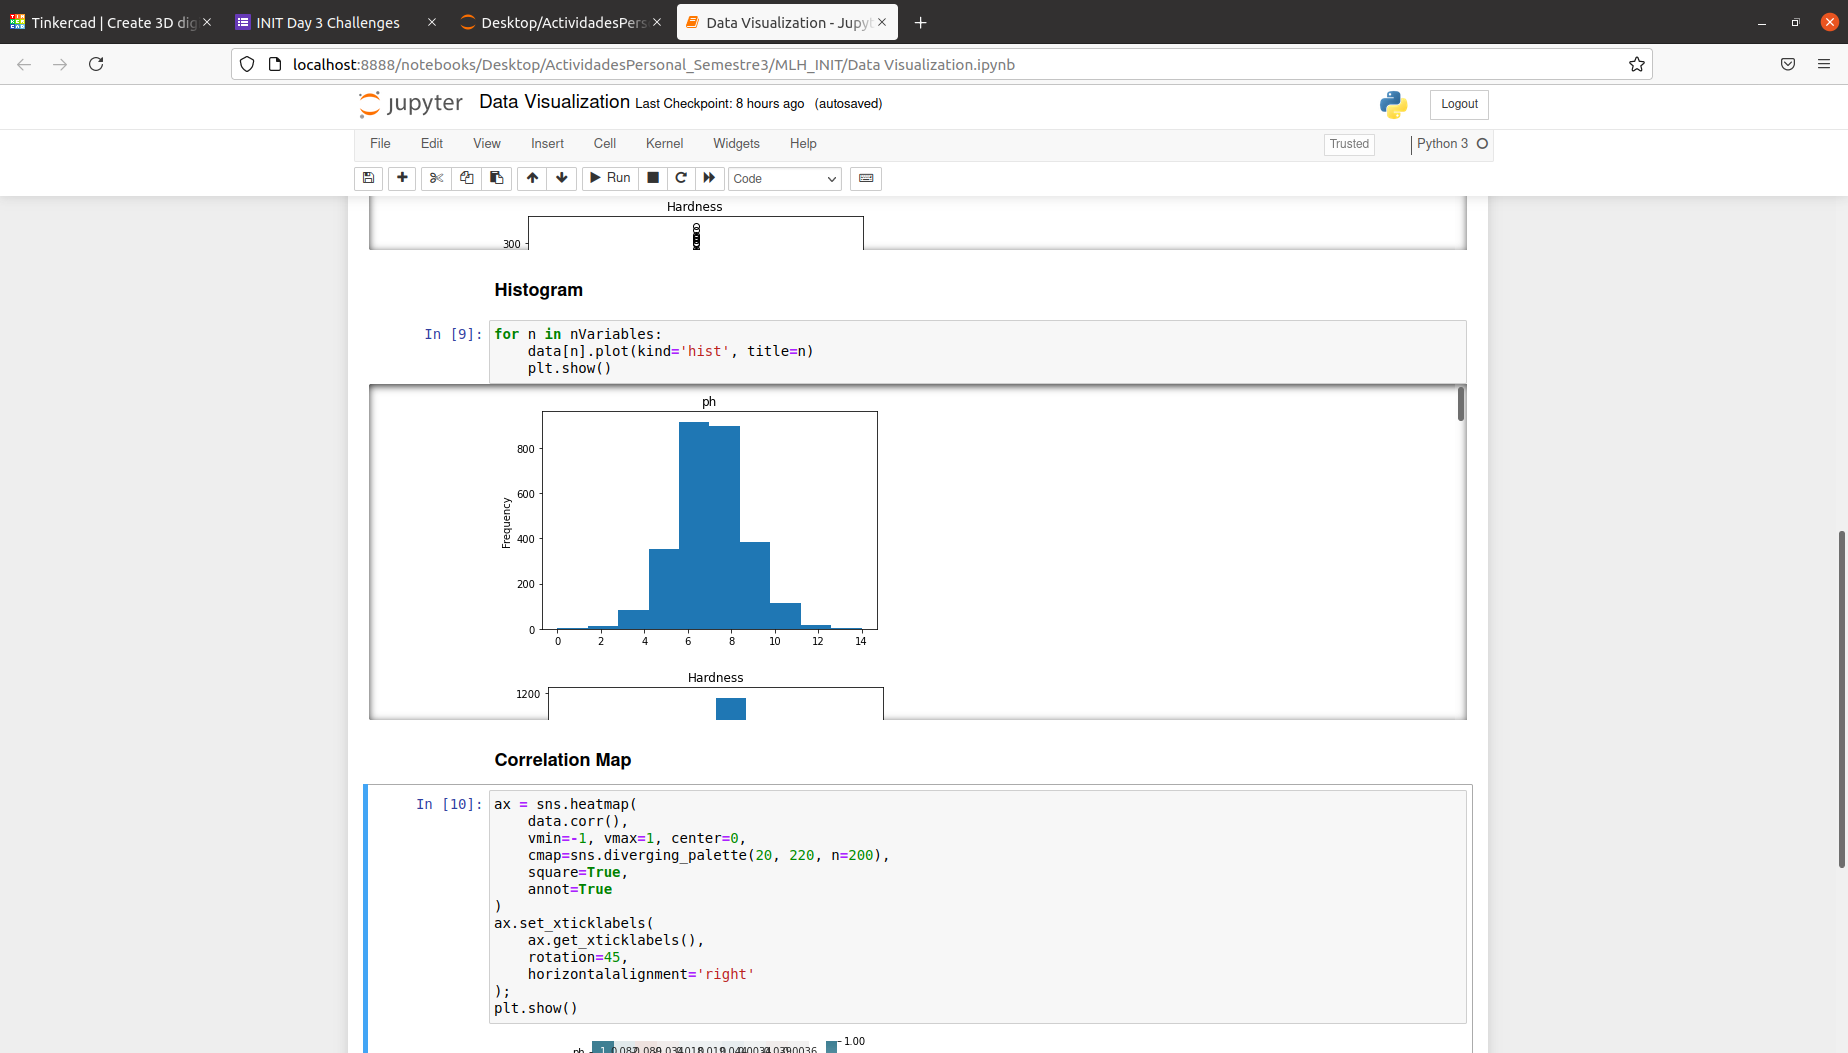
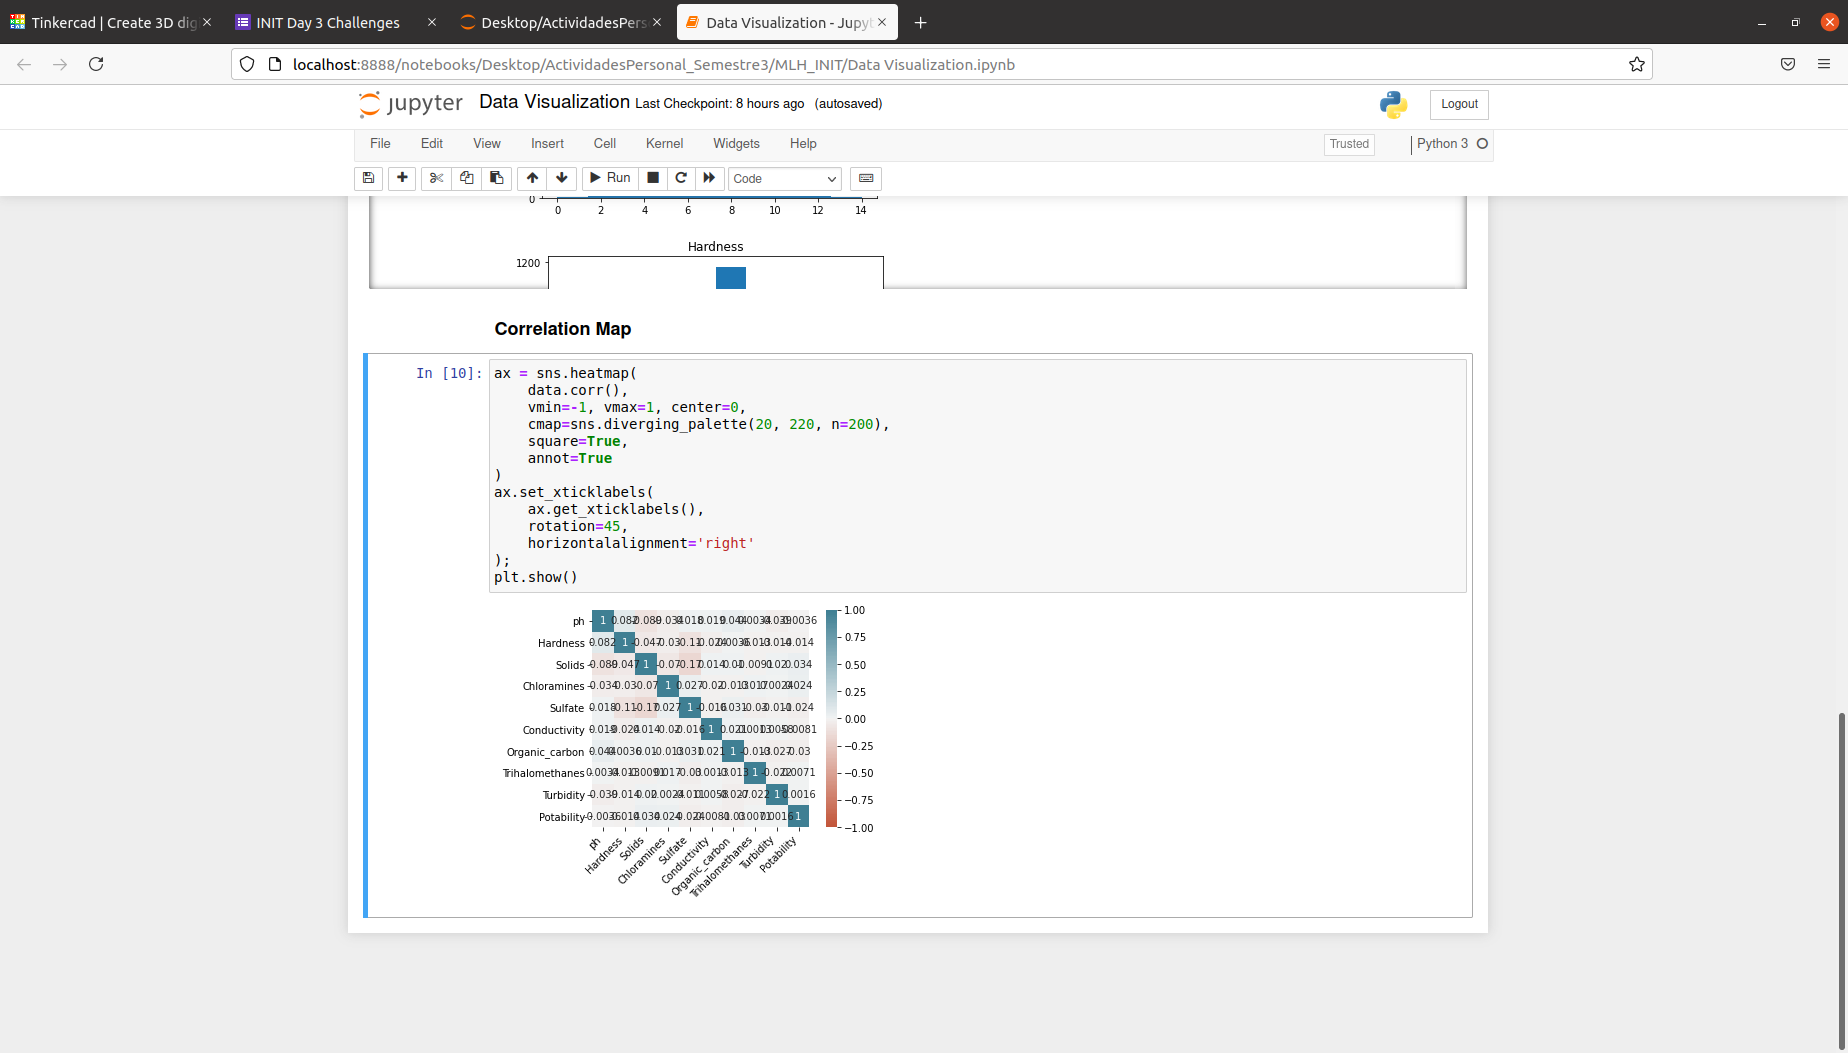
Insert Data Box Plots Histograms Correlation Map Data Visualization Using python and jupyter notebook, we made and application were you insert data and then make boxplot, histograms, and correlation map of data. Built With jupyter-notebookmatplotlibpandaspython Try it out github.com
Updates max garcia started this project — Jun 30, 2021 09:53 AM EDT Leave feedback in the comments! Log in or sign up for Devpost to join the conversation.
max garcia started this project — Jun 30, 2021 09:53 AM EDT Leave feedback in the comments! Log in or sign up for Devpost to join the conversation.


Log in or sign up for Devpost to join the conversation.