-
Data
-
Data Representation

Inspiration
To learn about data visualization and complete GLobal Hack Week challenge
What it does
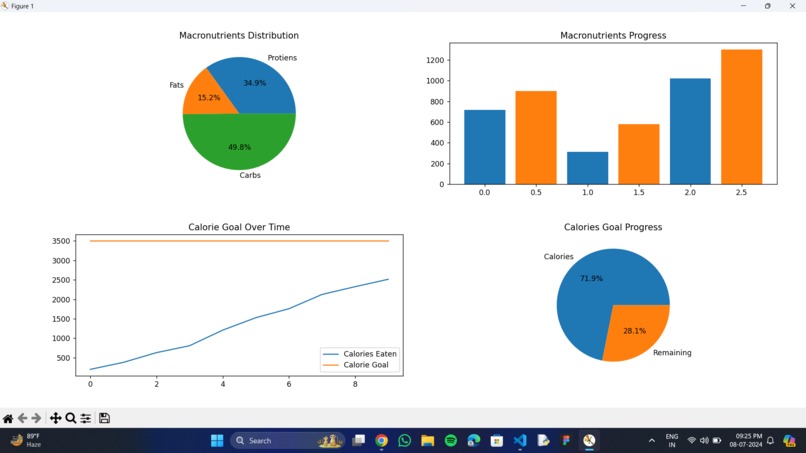
It process the data regarding calorie count and visualized it using pie chart, bar chart, etc
How we built it
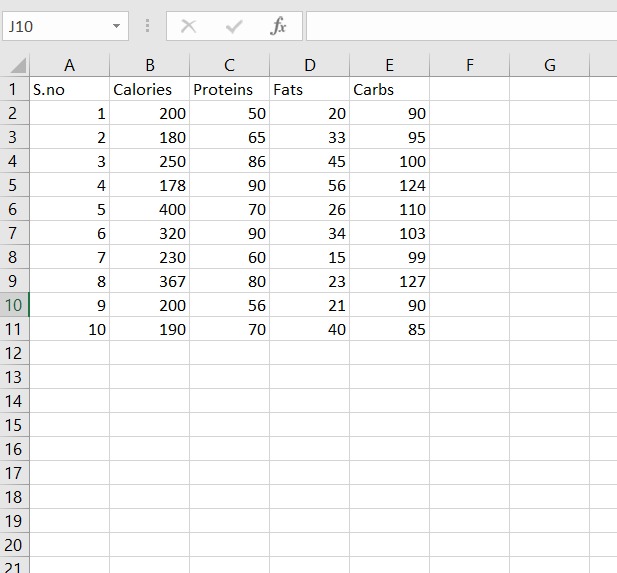
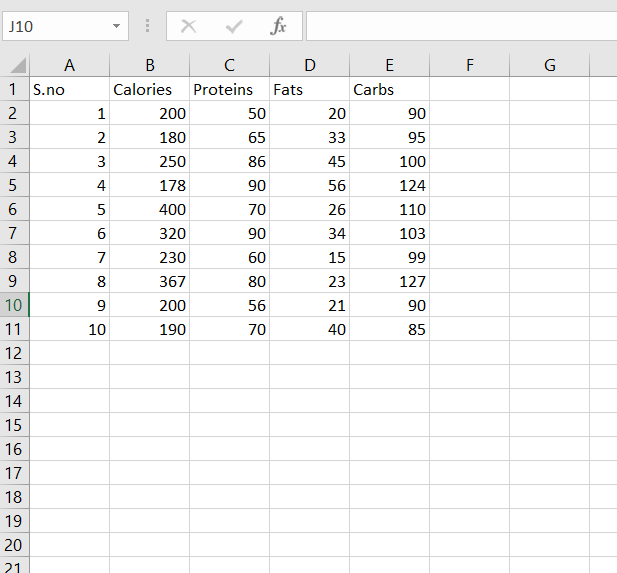
- We used python libraries like Matplotlib and Numpy to process data and visualize it.
- The data was initially stored in CSV file. ## Challenges we ran into
- How to use data
- How to show data representation ## Accomplishments that we're proud of Successfully represented data using python libraries ## What we learned
- Learned about Matplotlib
- Learned about Numpy
- Learned about CSV ## What's next for Data Visualization
- To analyze more complex data and represent it in a simpler form in form of charts and graphs.

Log in or sign up for Devpost to join the conversation.