Data Visualization
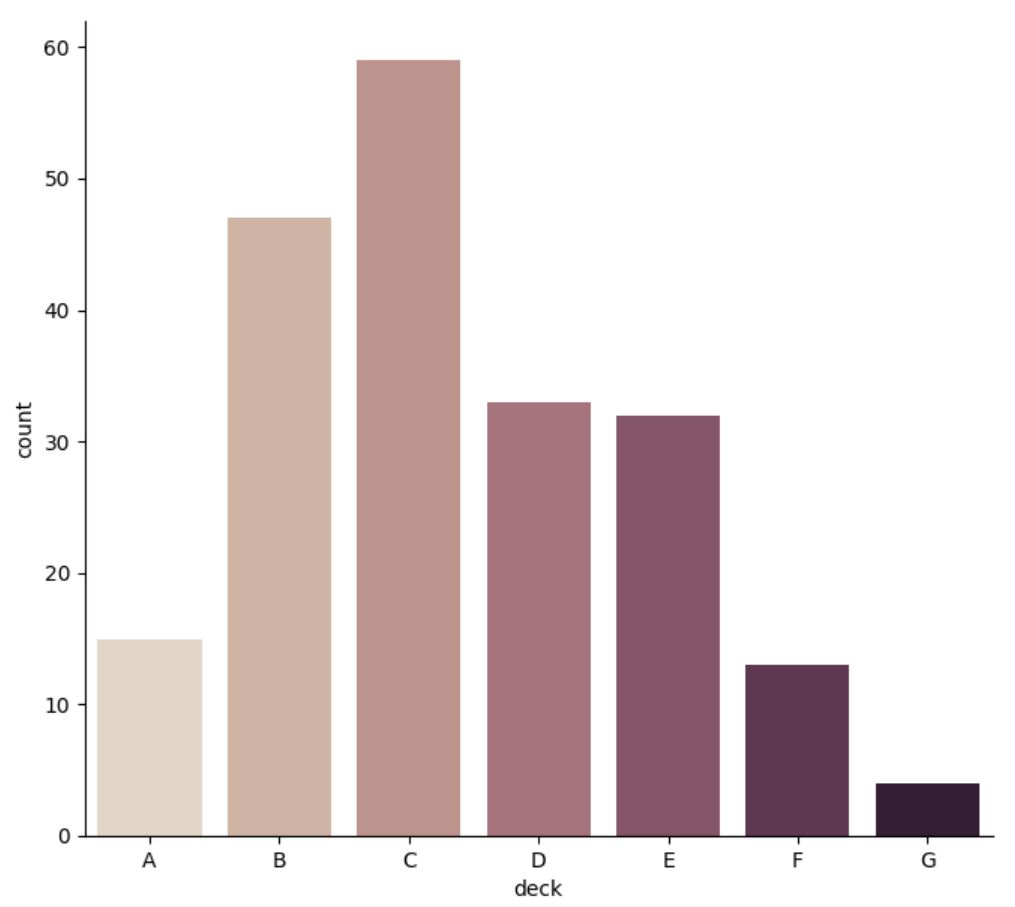
Data visualization example with Seaborn, a Python data visualization library based on matplotlib.
How I built it
This example was built using Seaborn, a Python data visualization library based on matplotlib.
The dataset was provided by Seaborn, and loaded from its online repository (requires internet).
Getting started
Run the following command in the terminal to see the bar plot:
$ py app.py
Built With
- python
- seaborn

Log in or sign up for Devpost to join the conversation.