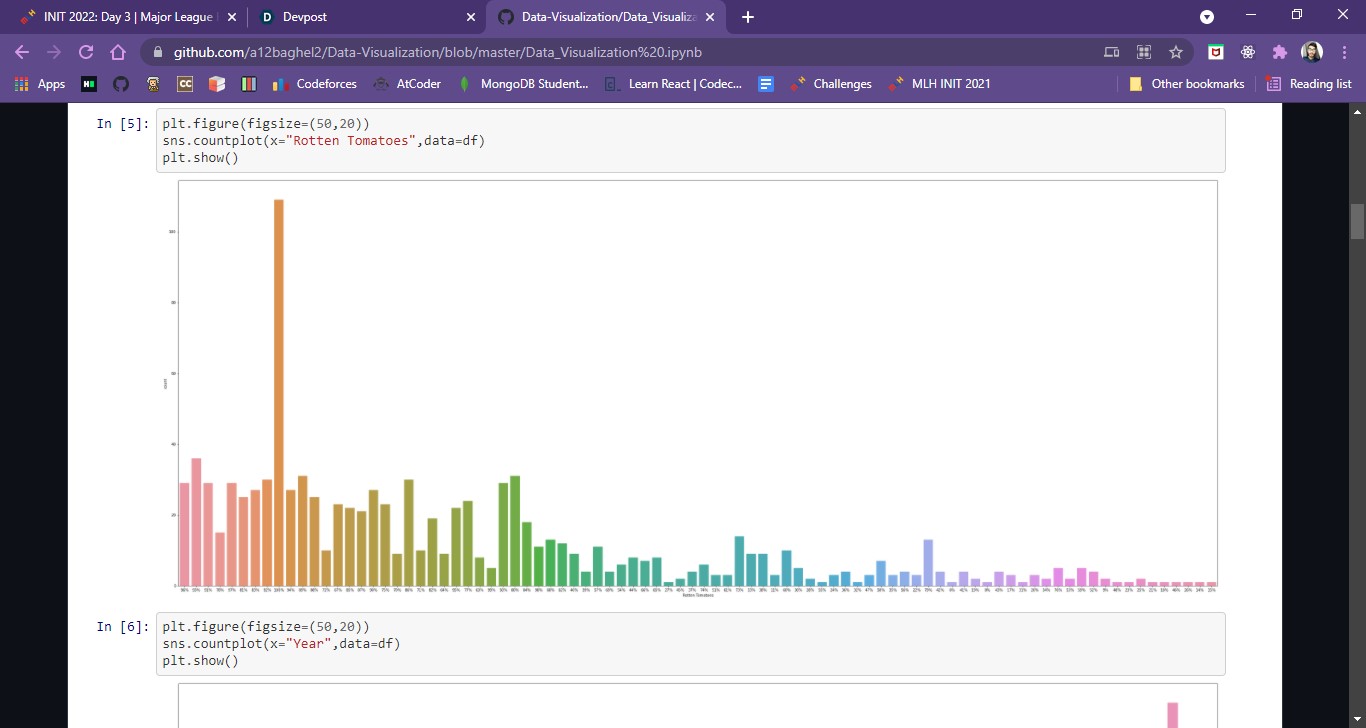
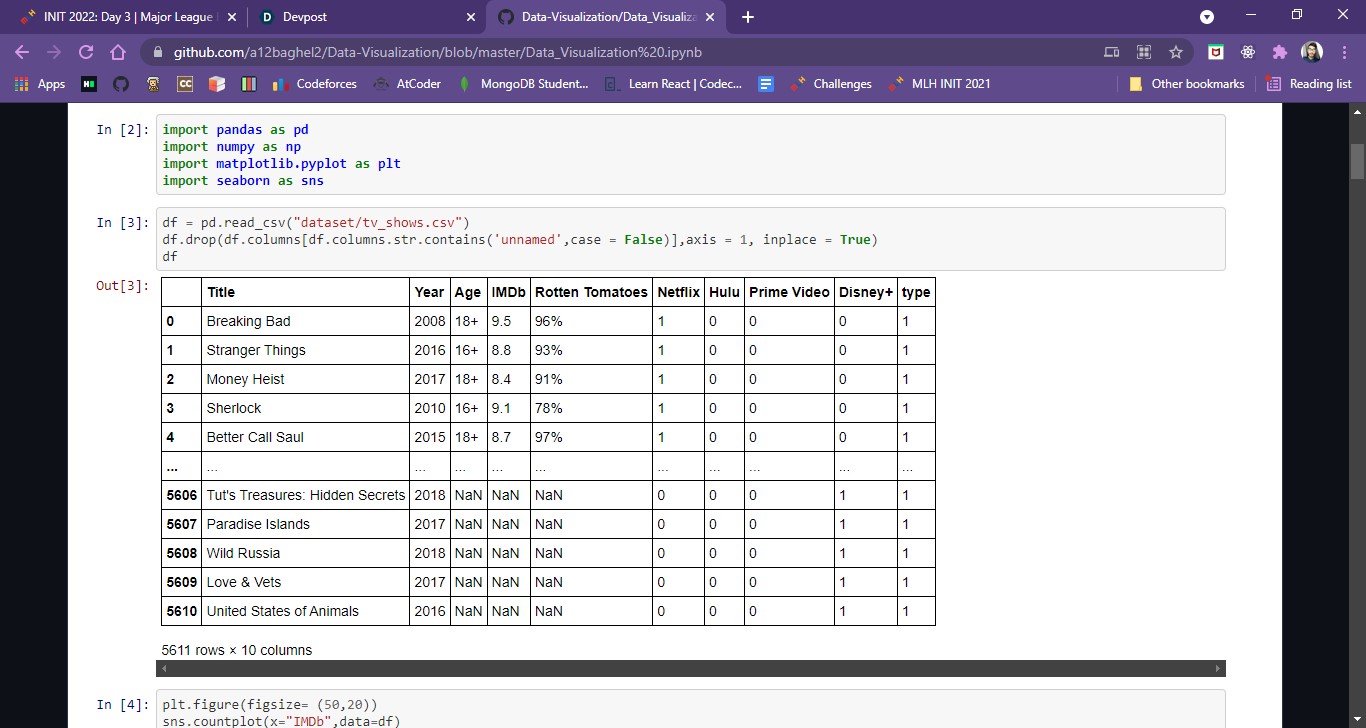
Bar Graph Dataframe Done data visualization in Jupyter Notebook using Seaborn and Matplotlib. Data Visualization is done on Game of Thrones dataset, Netflix TV shows dataset and Other TV shows dataset Built With jupyter-notebookmatplotlibnumpypythonseaborn Try it out github.com
Updates Abhimanyu Baghel started this project — Jun 29, 2021 12:12 PM EDT Leave feedback in the comments! Log in or sign up for Devpost to join the conversation.
Abhimanyu Baghel started this project — Jun 29, 2021 12:12 PM EDT Leave feedback in the comments! Log in or sign up for Devpost to join the conversation.

Log in or sign up for Devpost to join the conversation.