-
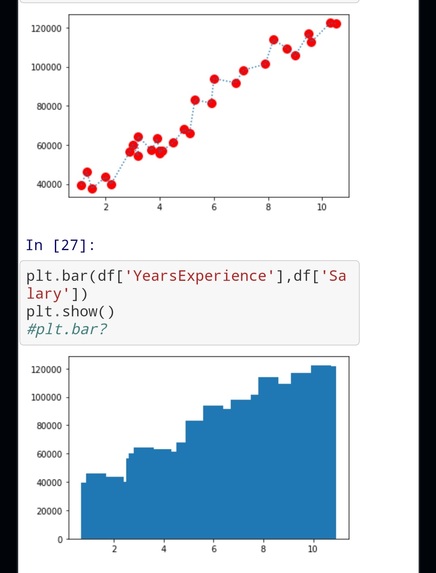
2 types of plots
-
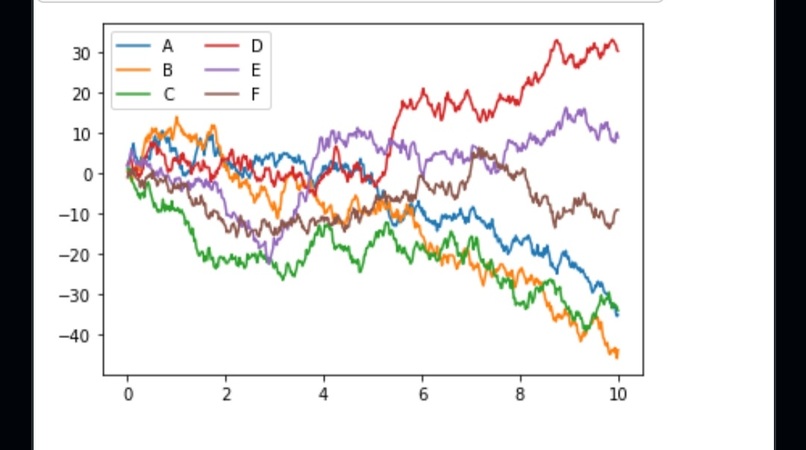
Random dataset

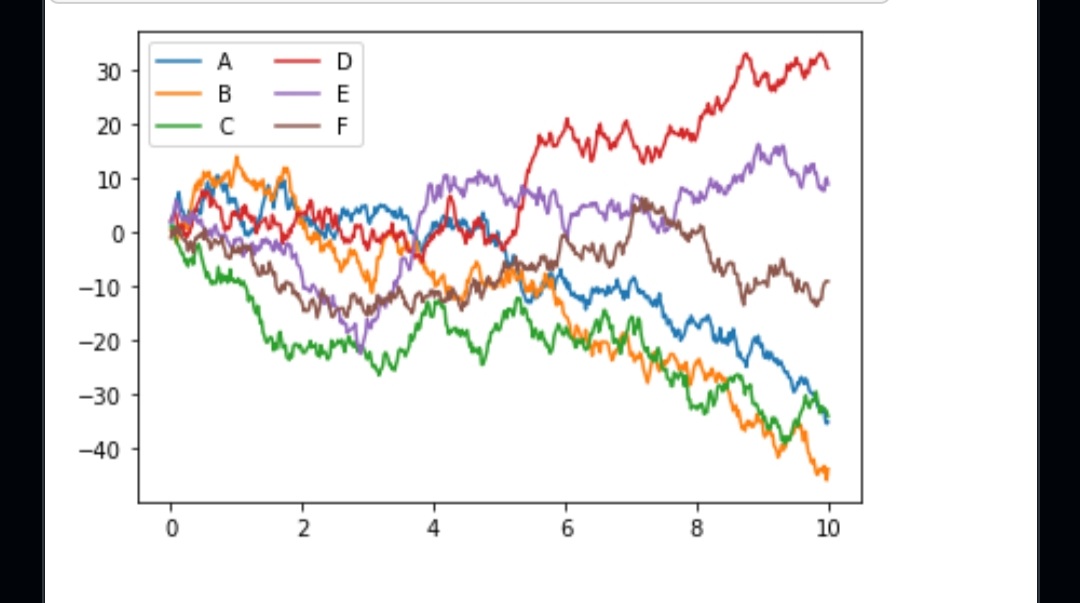
just a simple data visualisation of a dataset using python.
learnt different ways to show data in the form of bar graphs, pie charts and lines graphs
next is building a loan approval predictor using ml.
Built With
- colab
- python

Log in or sign up for Devpost to join the conversation.