Inspiration
Our inspiration for the Data Analysis Tool came from witnessing countless hours that data analysts and business professionals spend on repetitive Excel tasks, SQL query writing, and data visualization. We recognized that many professionals without deep technical expertise struggle to extract meaningful insights from their data. We wanted to create a tool that democratizes data analysis by combining the power of AI with an intuitive interface, making advanced analytics accessible to everyone.
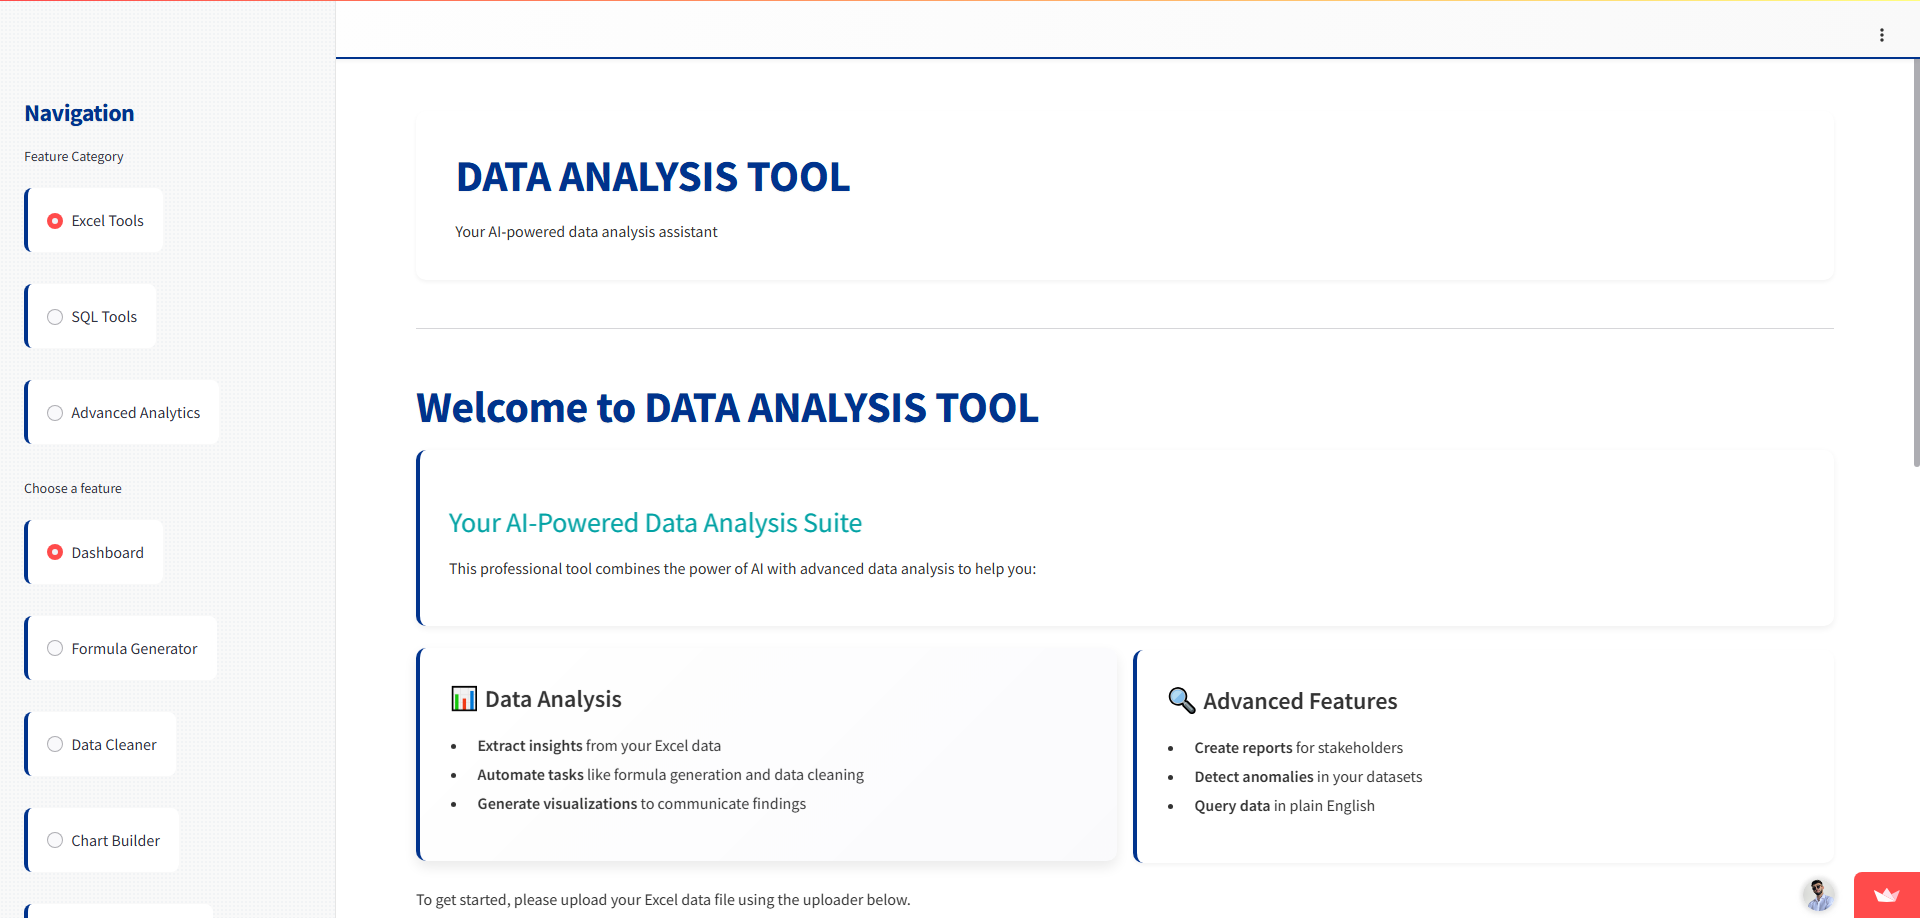
What it does
The Data Analysis Tool is a comprehensive data analysis platform that:
- Converts natural language to Excel formulas and SQL queries
- Cleans and transforms data with minimal effort
- Generates insightful visualizations automatically based on data patterns
- Detects anomalies and outliers in complex datasets
- Creates professional reports and executive dashboards
- Allows users to chat with their data using natural language
- Performs advanced analytics including statistical testing and machine learning ## How we built it We built the Data Analysis Tool using:
- Python as the core programming language
- Streamlit for the interactive web interface
- OpenAI's GPT-4o for natural language understanding and generation
- Pandas for data manipulation and analysis
- Plotly for interactive visualizations
- Scikit-learn for machine learning capabilities
- SQLAlchemy for database connectivity
- Matplotlib and Seaborn for additional visualization capabilities The architecture follows a modular design with separate components for:
- UI rendering (frontend)
- Data processing (backend services)
- AI integration (OpenAI service)
- Database connectivity (SQL service) ## Challenges we ran into During development, we faced several challenges:
- Threading issues with SQLite: We had to implement a thread-safe connection management system to avoid "SQLite objects created in a thread can only be used in that same thread" errors
- JSON parsing from OpenAI responses: The API sometimes returned JSON embedded in markdown code blocks, requiring robust parsing logic
- Dependency management: Ensuring all required libraries were properly installed and compatible
- Memory management: Handling large datasets efficiently within Streamlit's constraints
- Error handling across multiple services: Creating a robust error handling system that provided helpful messages to users
- Dynamic UI updates: Managing state changes and interactive elements in the Streamlit interface ## Accomplishments that we're proud of We're particularly proud of:
- Creating an intuitive interface that makes complex data operations accessible
- Implementing advanced statistical analysis capabilities like clustering and PCA
- Building a seamless integration between natural language processing and technical data operations
- Developing a professional-grade visualization engine with customization options
- Creating a modular architecture that allows for easy expansion of features
- Ensuring the tool works with various data sources including Excel, CSV, and databases ## What we learned Throughout this project, we learned:
- How to effectively integrate large language models into data analysis workflows
- Techniques for enhancing user experience in data applications
- Methods for balancing technical complexity with user-friendly interfaces
- Best practices for thread safety in database applications
- Advanced data visualization techniques and when to apply them
- How to handle edge cases in natural language processing for domain-specific tasks
- Effective error handling strategies for AI-powered applications ## What's next for Data-Tool Looking forward, we plan to:
- Implement collaborative features allowing teams to work on datasets together
- Add more advanced machine learning capabilities like predictive modeling
- Create a plugin system to extend functionality
- Enhance the natural language capabilities with domain-specific training
- Develop offline processing capabilities for sensitive data
- Implement automated data quality assessment tools
- Add support for more data sources including Big Data platforms
- Create industry-specific templates for common analysis scenarios
- Build a version control system for analyses and reports We believe the Data Analysis Tool has the potential to transform how professionals work with data, saving countless hours and unlocking insights that might otherwise remain hidden.

Log in or sign up for Devpost to join the conversation.