-
-

Graph of clients versus transactions
-

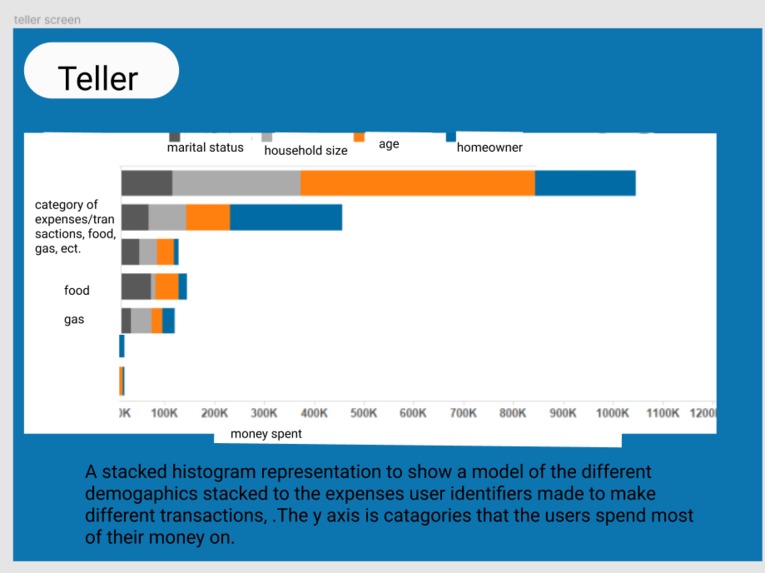
Data in bar form, of user identifiers transactions versus user identifiers
-

Graph of credit transactions versus the user identifiers as data points in a graph using easybase.io mock up design of userface using flask
-

mock up design of userface using flask
-

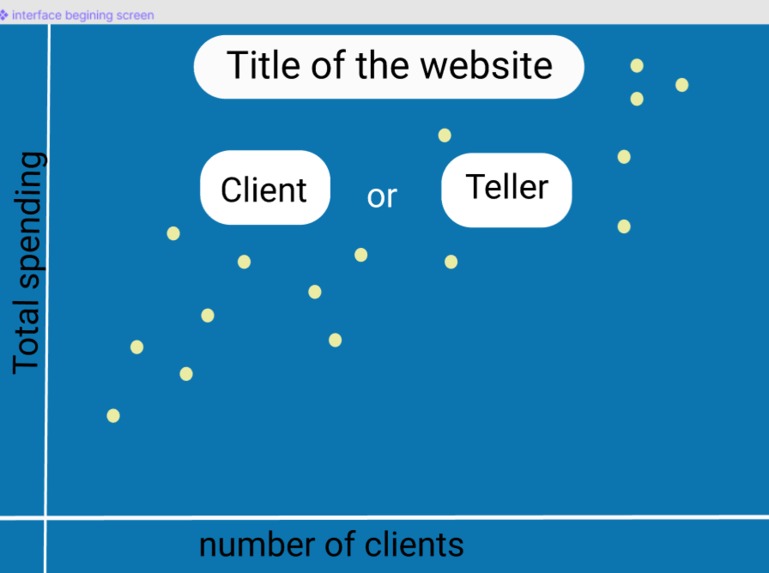
Start screen of user interface, The user can interact with the client button or teller button, graph is for background aesthetic
-

User interface first interaction, user inputs interface number
-

idea for user interface
-

idea for user interface
-

idea for user interface
-
title screen again to get to the business interface
-

idea for management interface
-

idea for management interface
-
idea for management interface
DATA TITAN
Our project is a web based application that get data from our database hosted on a remote server (EASYDATA) and present those data to the user in for of statistic data.


Updates

Leave feedback in the comments!
Log in or sign up for Devpost to join the conversation.