-
-
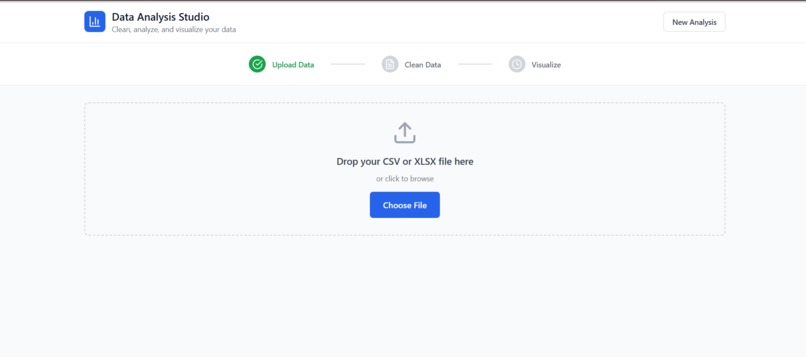
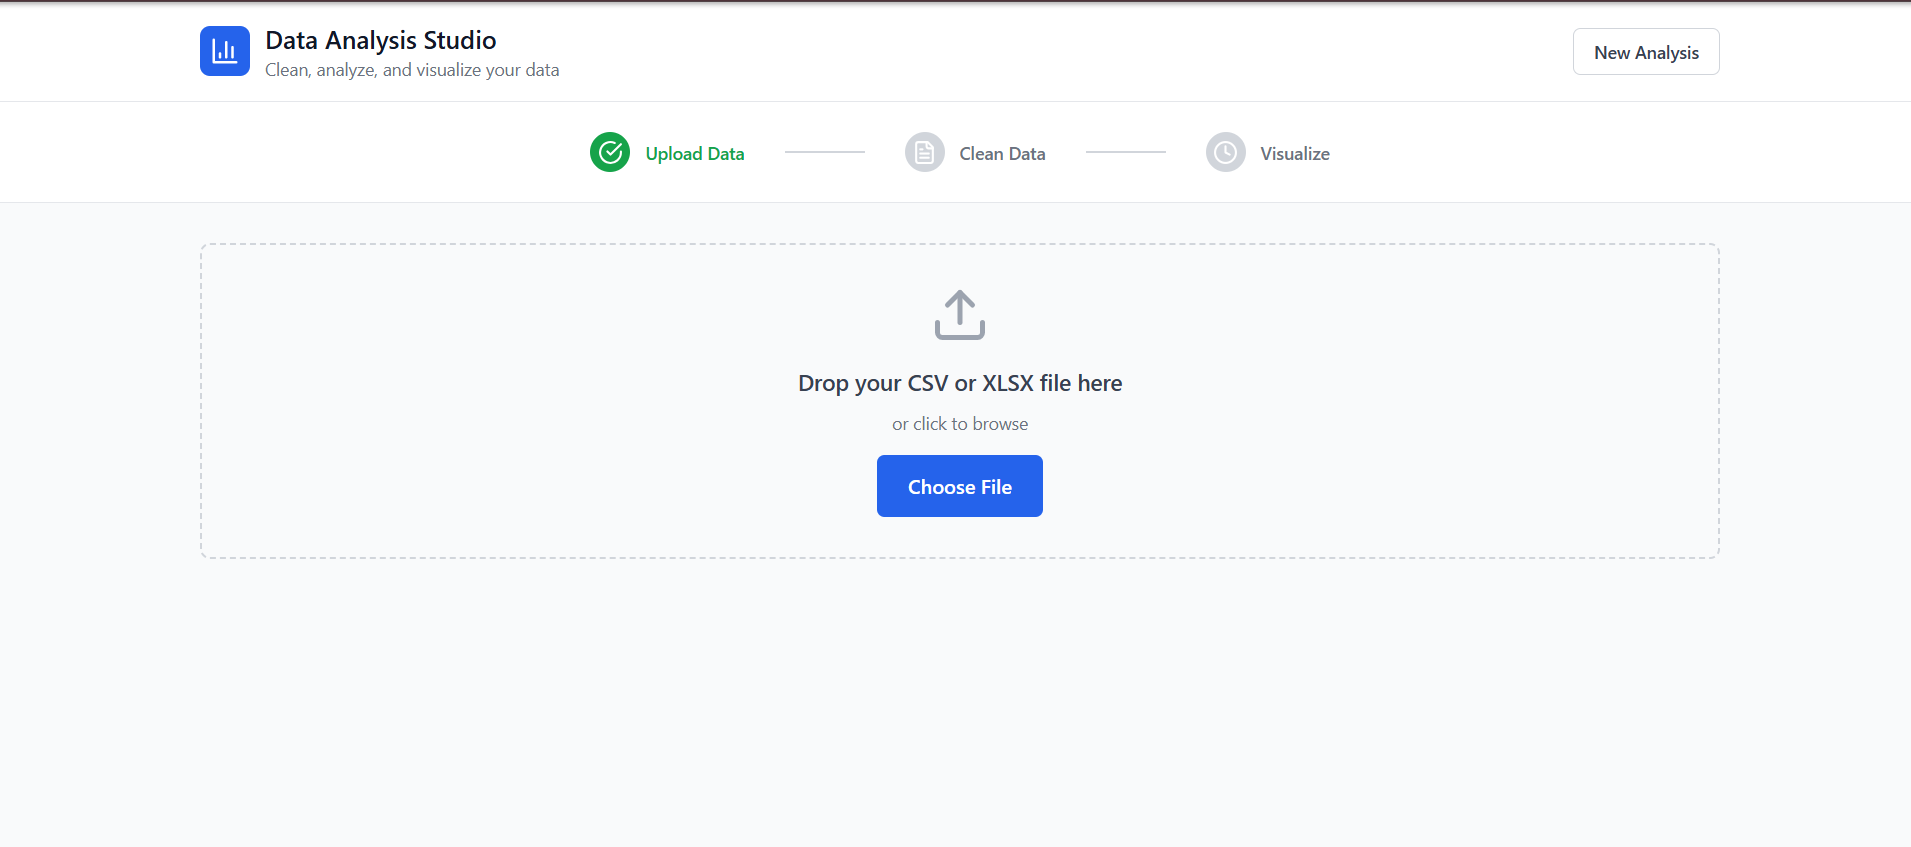
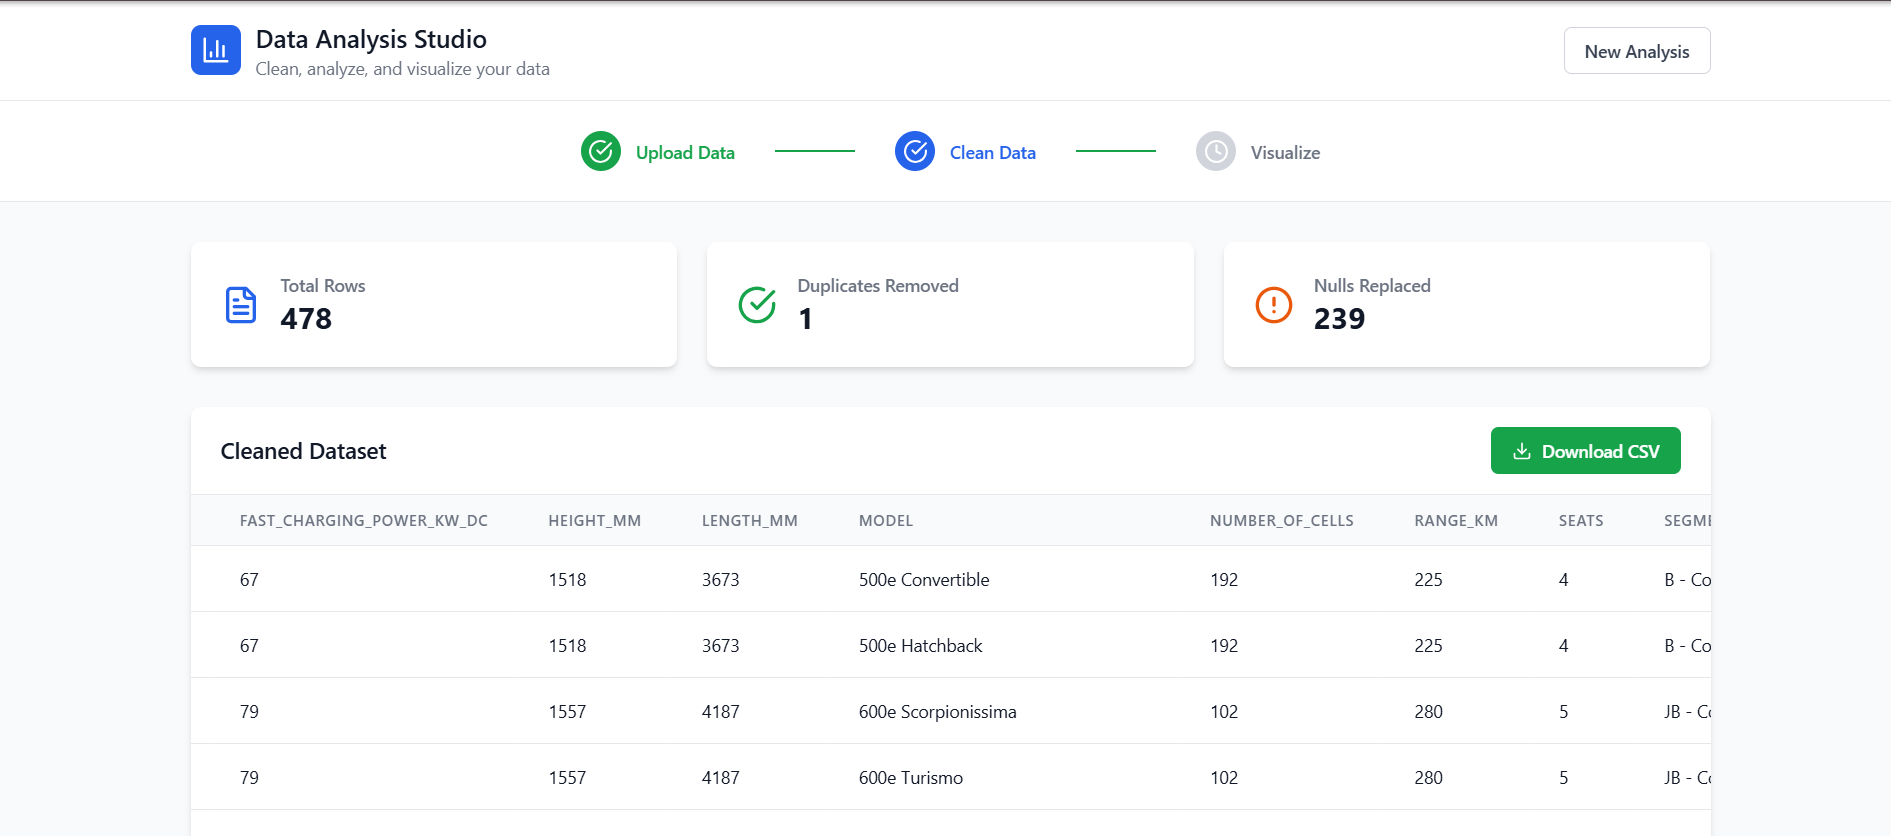
this is the main page of the website
-
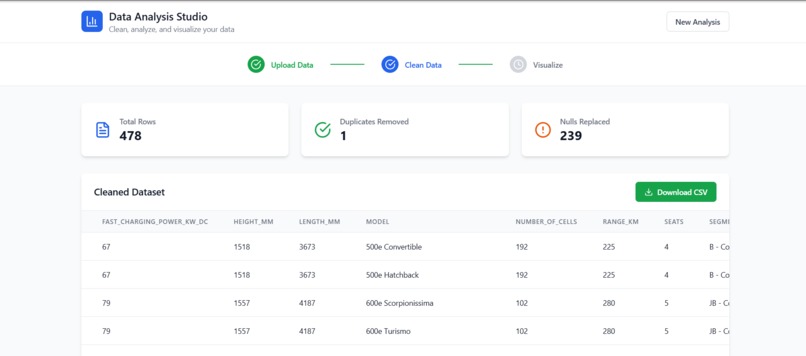
Data Cleaning
-
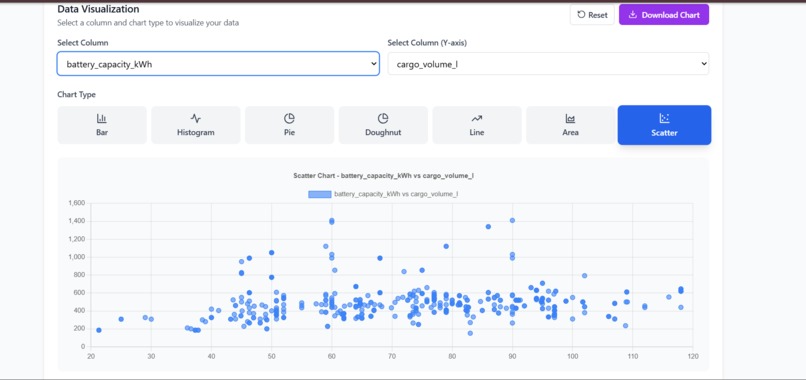
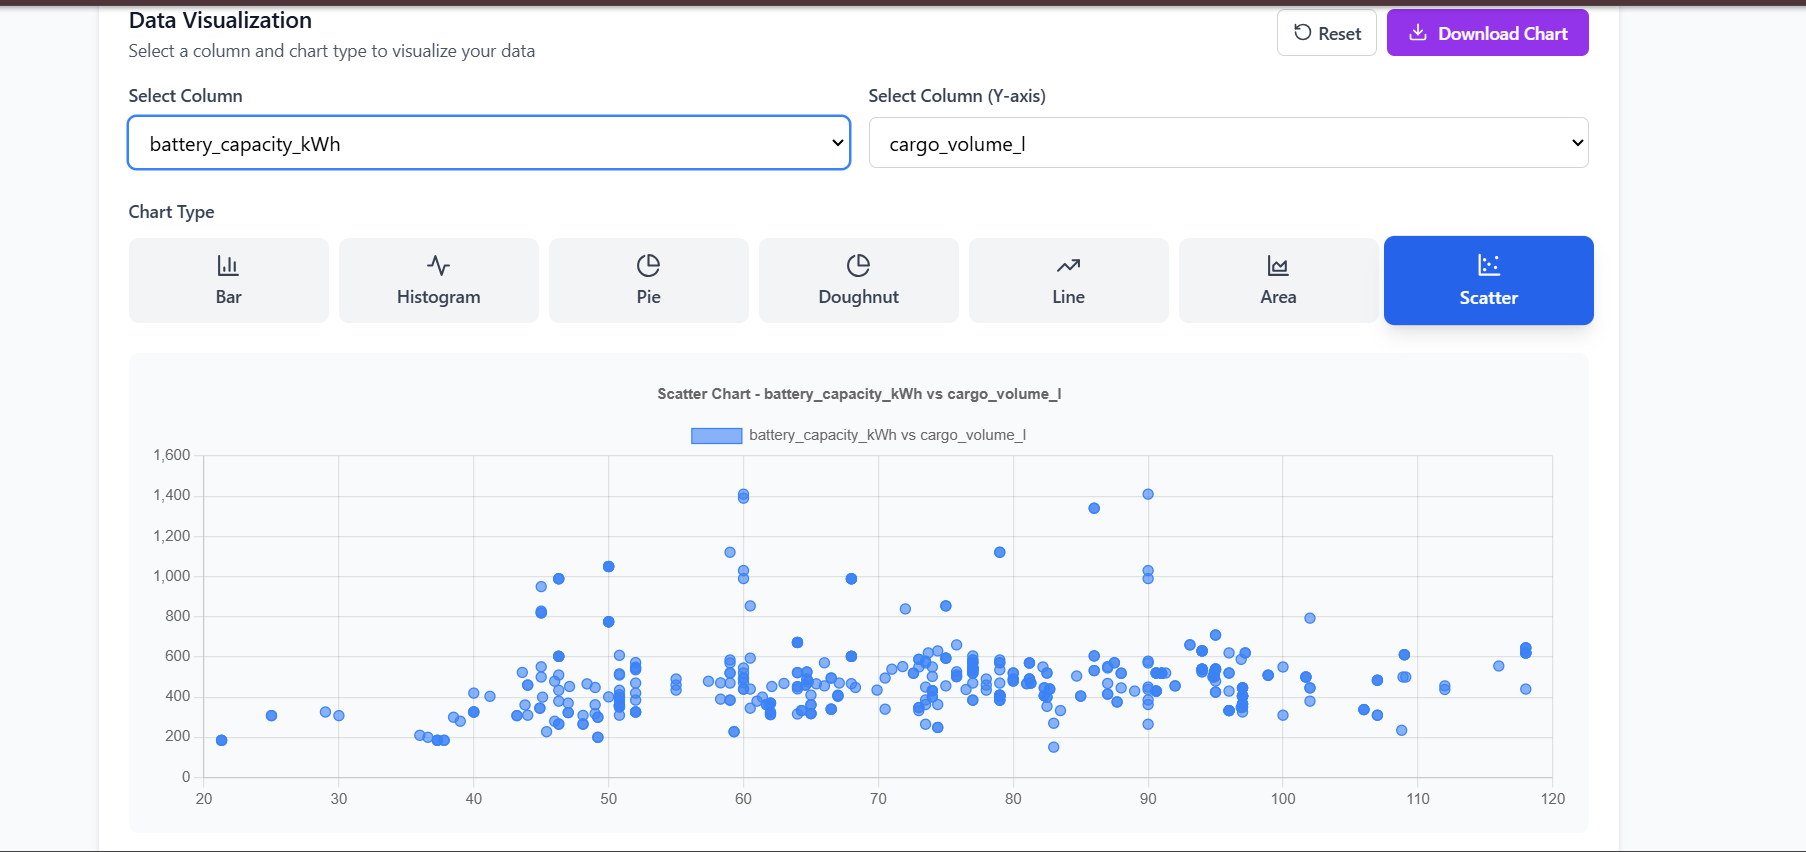
Data Visualization
Inspiration
We were inspired to build Data Analysis Studio after noticing that many people — especially students and beginners — struggle with tools like Excel, Python, or R just to perform simple data cleaning and visualization. We wanted to make a tool that anyone could use to quickly upload a dataset, clean it, and generate charts without needing any programming knowledge. Whether it's a researcher needing quick insights, a student preparing a report, or a business user validating data — our platform Data Studio Analysis is built for speed, clarity, and simplicity.
What it does
Data Analysis Studio is a no-code web app that helps users:
-🧹Data Cleaning
- 📊Data Visualization
- 📥 Allowing us to download this
How we built it
We built the platform using the following tools and technologies:
1.React.js – Frontend framework 2.Chart.js with react-chartjs-2 – Interactive charts 3.PapaParse – CSV parsing in the browser 4.SheetJS (XLSX) – Excel file support 5.TailwindCSS – For clean and responsive UI 6.Lucide-react – Modern icon library
Process
We followed a step-by-step modular approach:
-File upload and parsing -Data cleaning logic using JavaScript -State management for real-time updates -Dynamic chart rendering based on selected columns -Clean, intuitive design for great UX
Challenges we ran into
We faced several technical and design challenges:
-🧩 Dynamically handling different data types (numeric vs categorical) for visualizations -🔄 Ensuring real-time feedback for large datasets without performance lags -💥 Preventing the app from crashing due to missing values or malformed files -🎯 Creating an interface that's minimal but powerful, easy for users to follow
One of the hardest parts was striking the balance between flexibility and simplicity.
Accomplishments that we're proud of
-Built a fully working data platform with: -Upload, Clean, Visualize, and Download features -Created 10+ chart types that users can generate instantly -Made a tool that's accessible to non-technical users -Handled real-world messy data smoothly with nulls and duplicates -Polished UI that guides the user clearly from start to finish
What we learned
This project helped us grow in many ways:
-Deepened our knowledge of React and state handling -Learned how to integrate libraries like Chart.js,** PapaParse*, and **SheetJS* -Understood UX design principles for building user-friendly tools -Improved how we debug, test, and manage large files in a web environment
Most importantly, we learned how to turn an idea into something real, usable, and helpful.
What's next for Data Studio Analysis
We have some exciting ideas to take this even further:
-🤖 Add AI-powered chart recommendations.
- 🔍 Include anomaly detection and outlier highlights
-📈 Introduce predictive ML features **(regression, clustering) -🧠 Integrate an **AI assistant to explain statistics and trends -📤 Export to more formats like '.pdf',' .jso'n, and even dashboards >The future is bright — and we’re just getting started.
Built With
- chart.js
- css3
- html5
- javascript
- lucide-react
- netlify
- papaparse
- react-chartjs-2
- react.js
- sheetjs
- tailwind
- vite


Log in or sign up for Devpost to join the conversation.