-
-
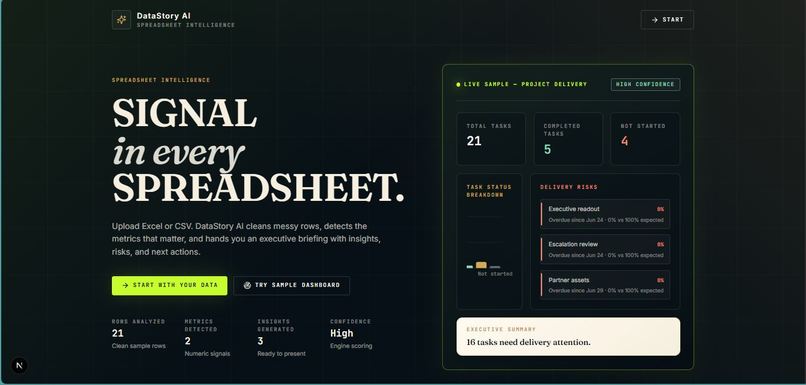
Hero part 1
-
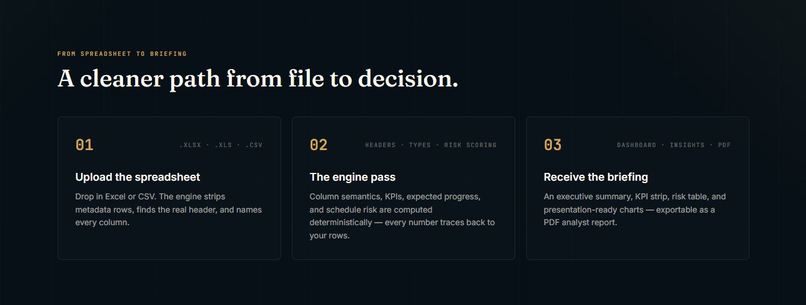
Hero part 2
-
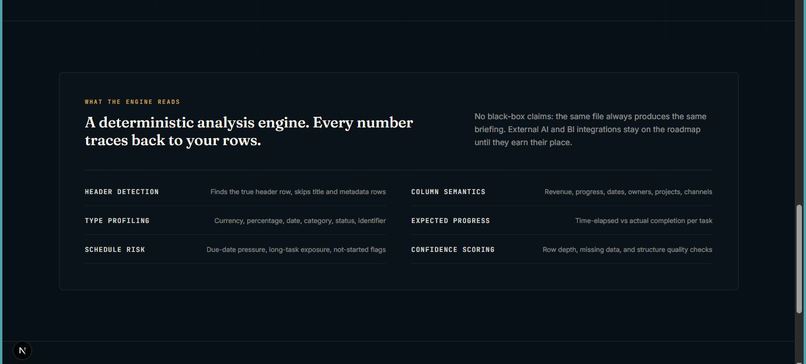
Hero part 3
-

Hero part 4
-
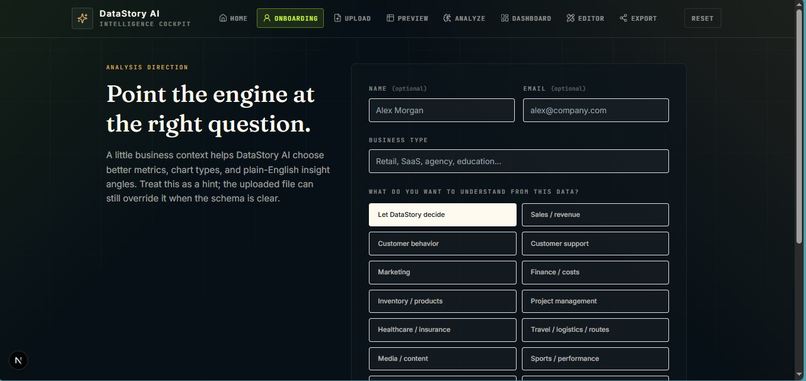
onboarding part 1
-

onboarding part 2
-
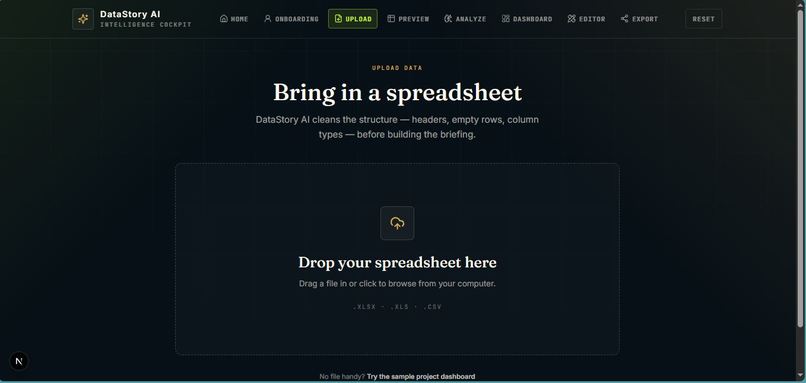
Upload
-
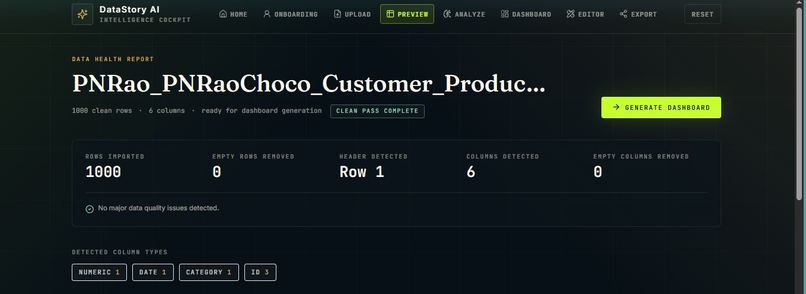
preview table part 1
-
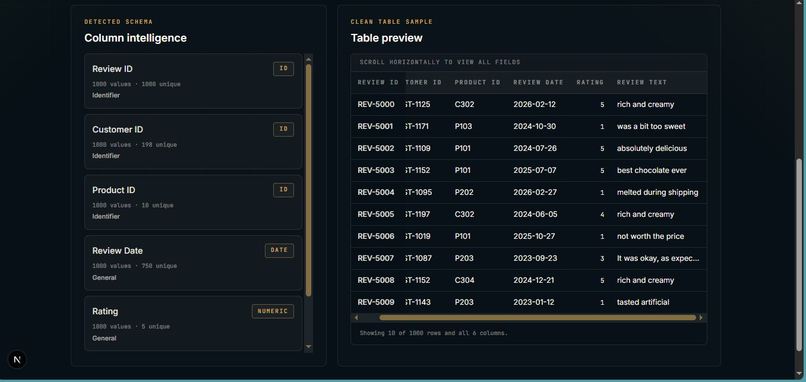
preview table part 2
-
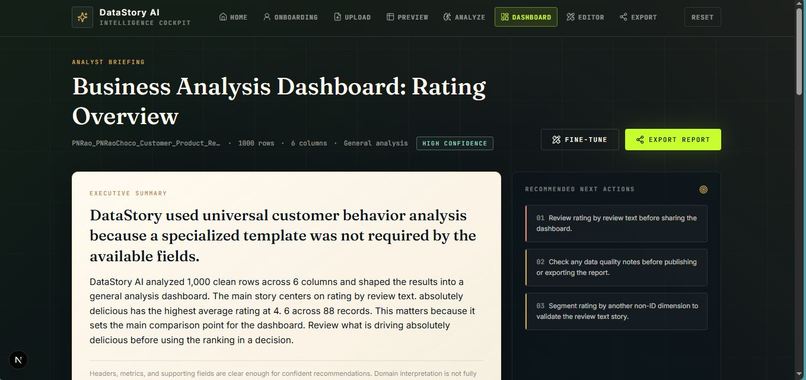
Dashboard part 1
-
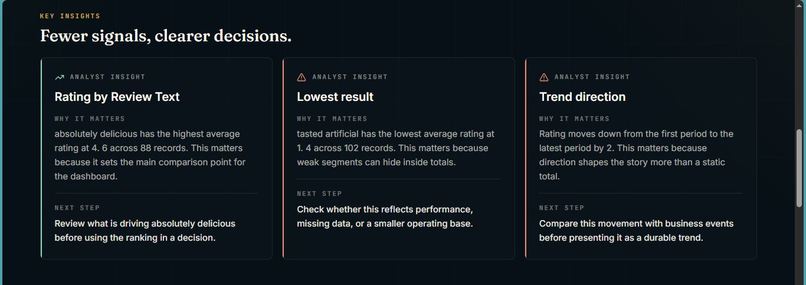
Dashboard part 2
-
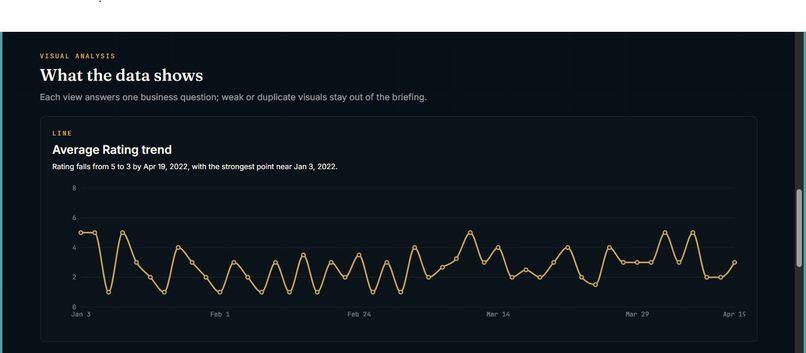
Dashboard part 3
-
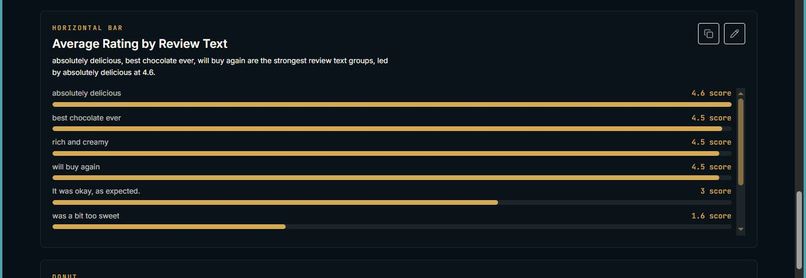
Dashboard part 4
-
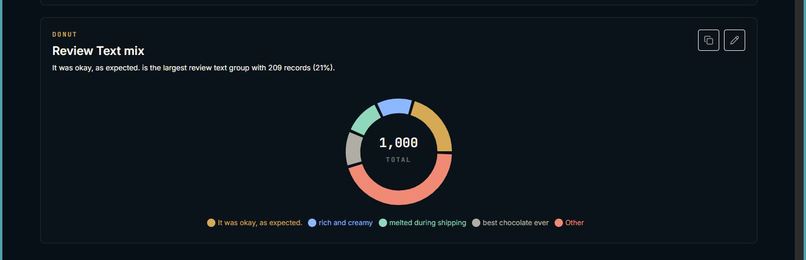
Dashboard part 5
-
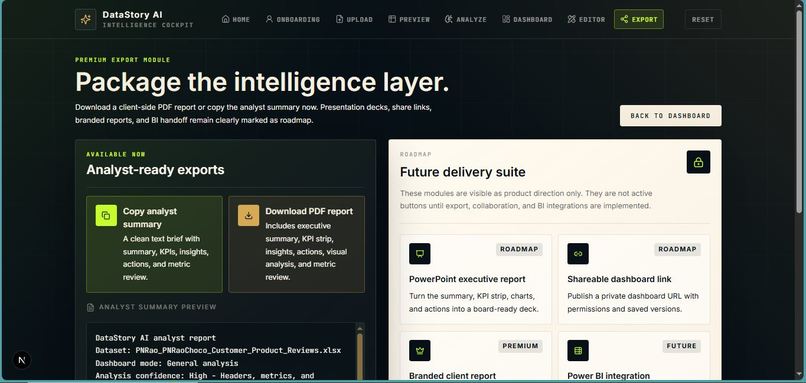
export part 1
-
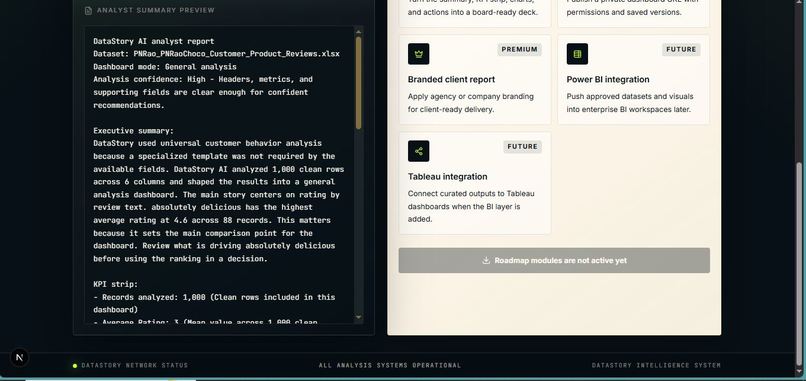
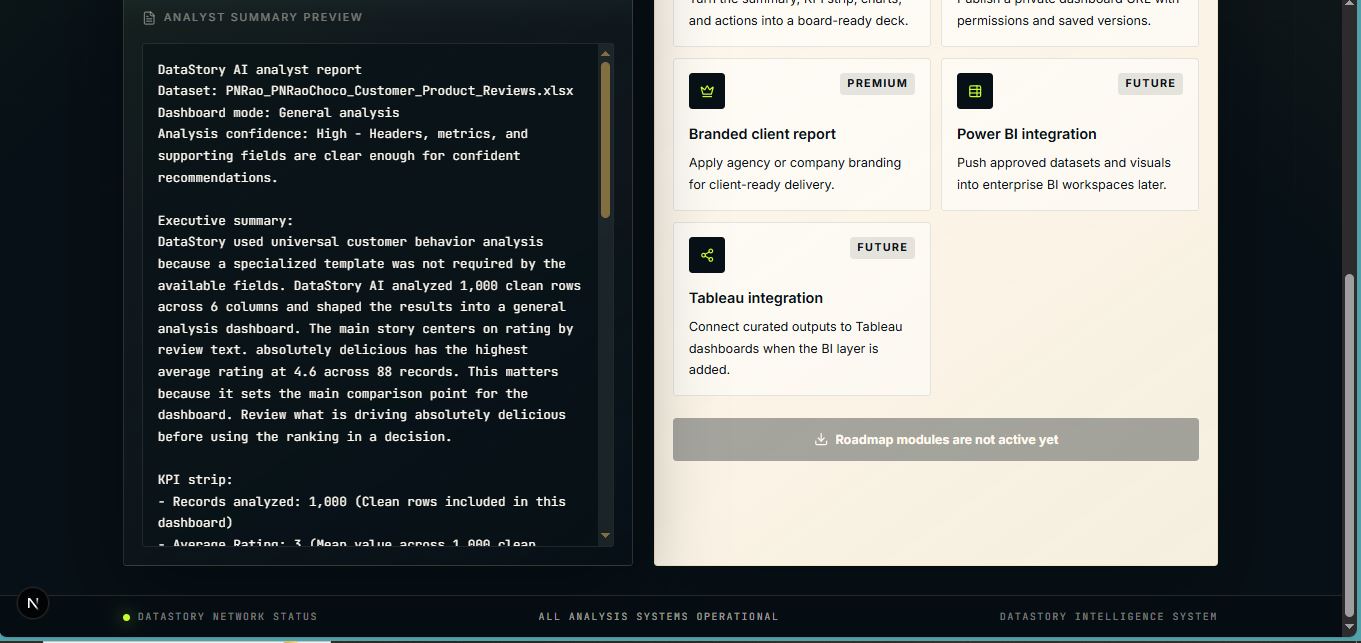
export part 2
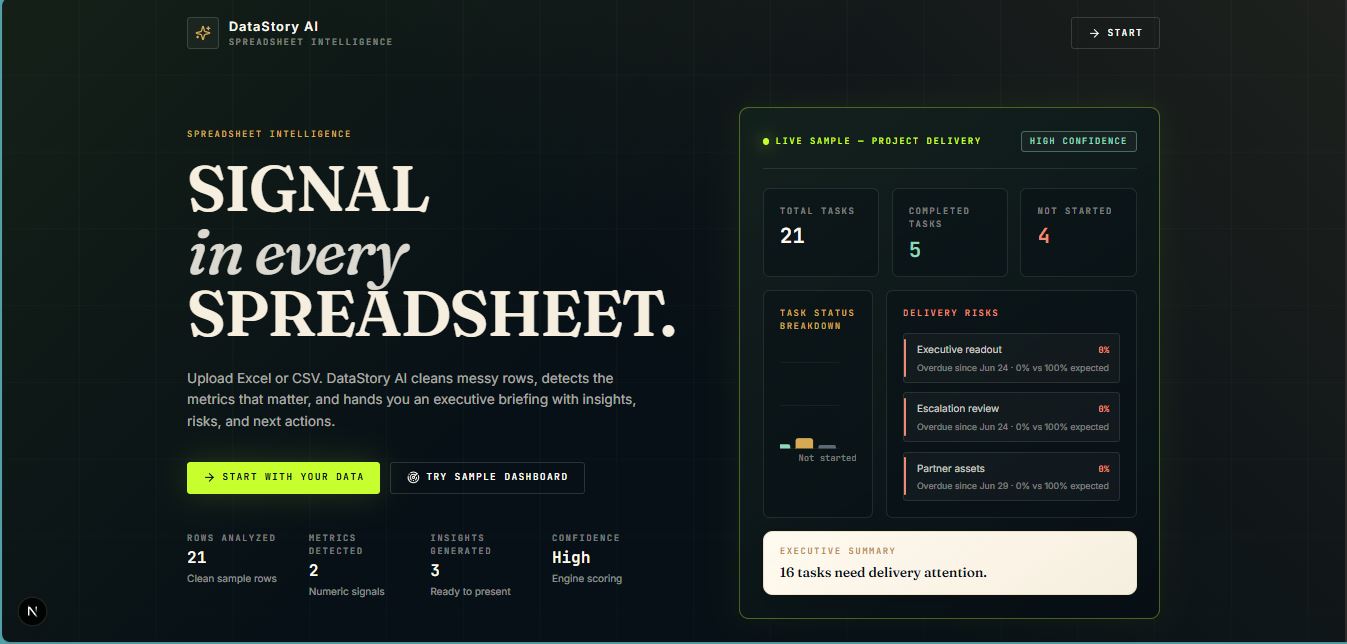

DataStory AI
Turning spreadsheets into trustworthy business stories
Inspiration
I started DataStory AI because I kept noticing the same problem: businesses have useful information inside Excel files, but turning those files into something understandable still takes a lot of time.
Most tools either expect the user to already understand data analysis or quickly generate charts without explaining whether the calculations actually make sense.
My original idea was simple: upload a spreadsheet and receive a useful dashboard. But while building it, I realized that generating charts was the easy part. The harder and more important challenge was making sure the system understood what the columns represented and did not produce misleading conclusions.
That changed DataStory AI from a dashboard generator into a project focused on trustworthy spreadsheet analysis.
What it does
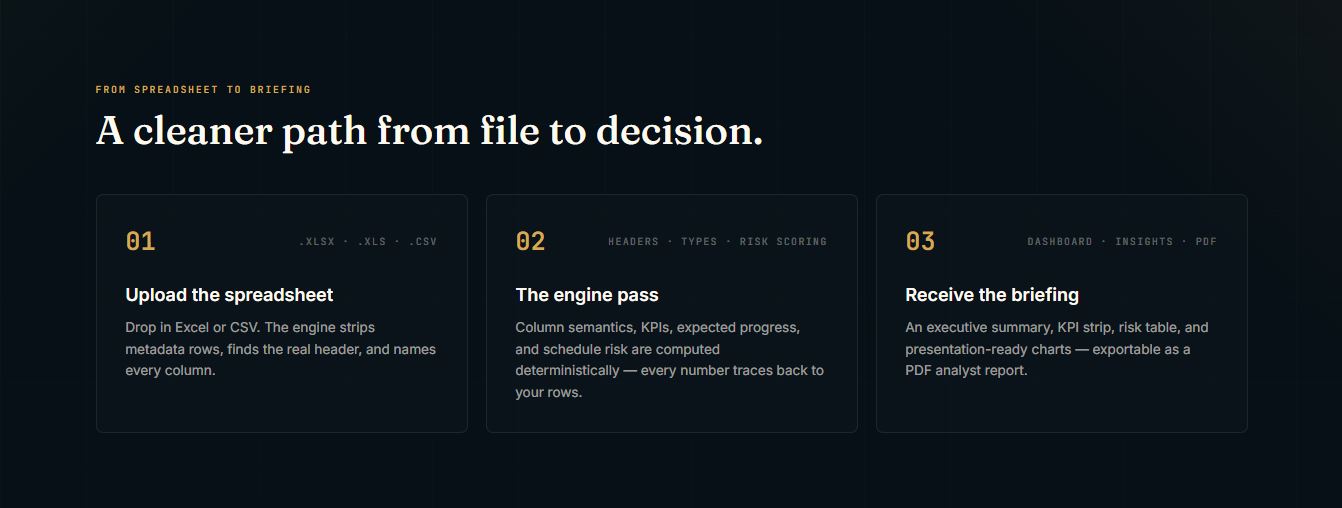
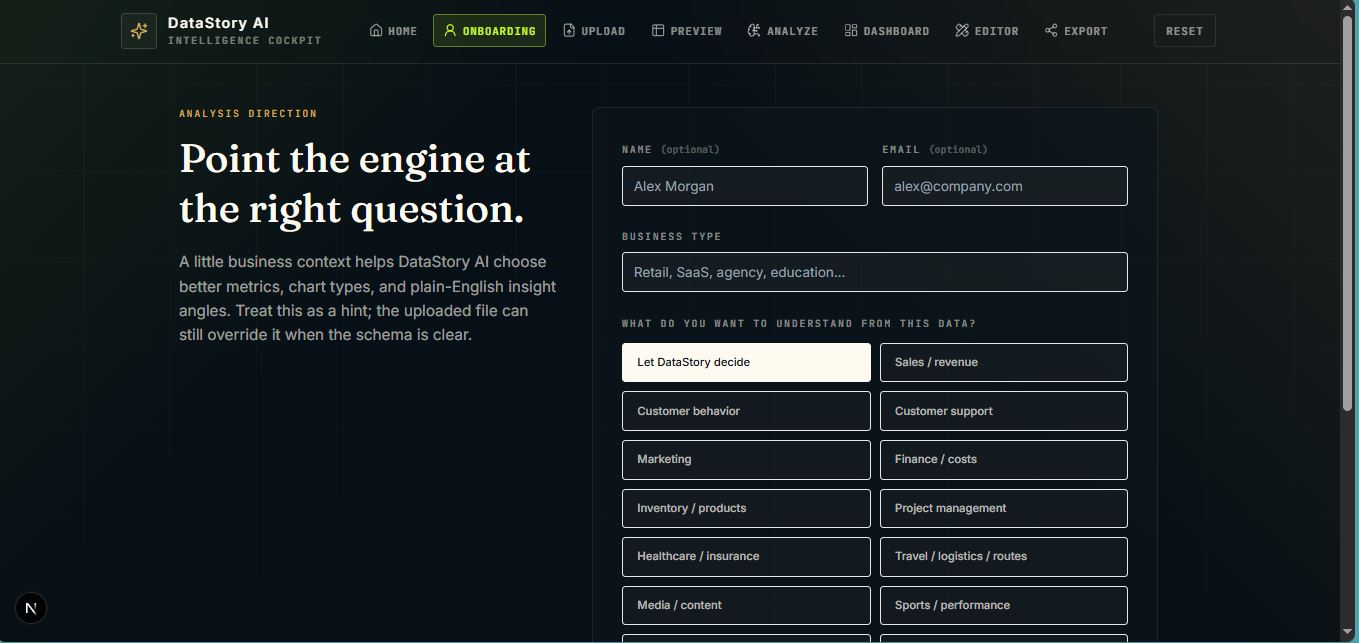
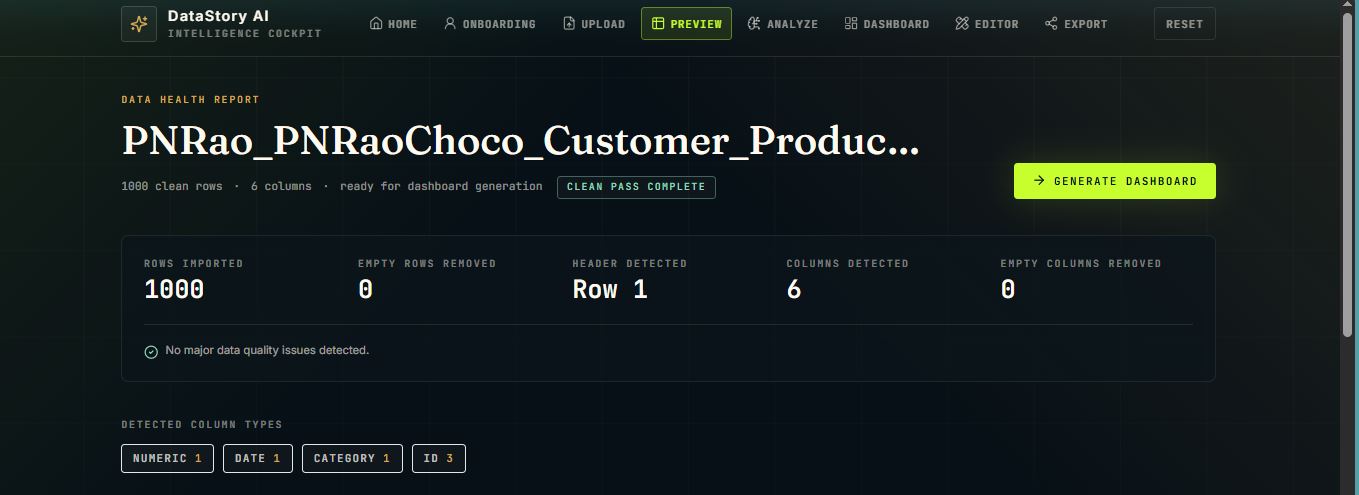
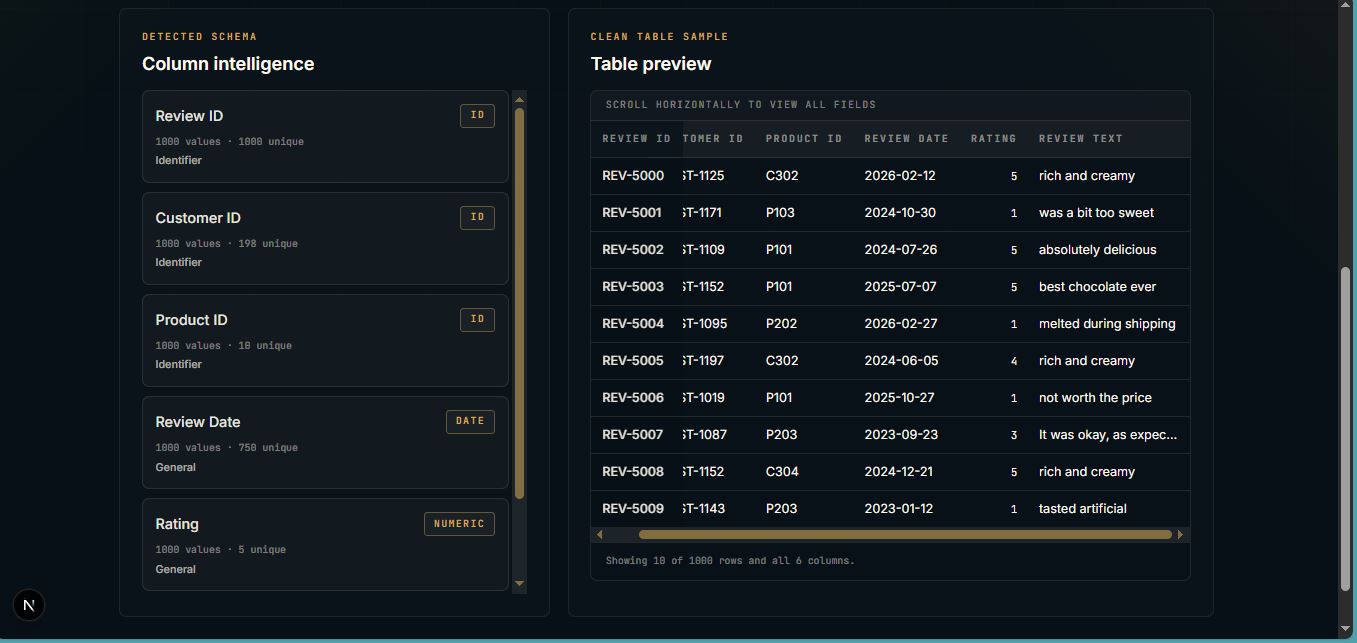
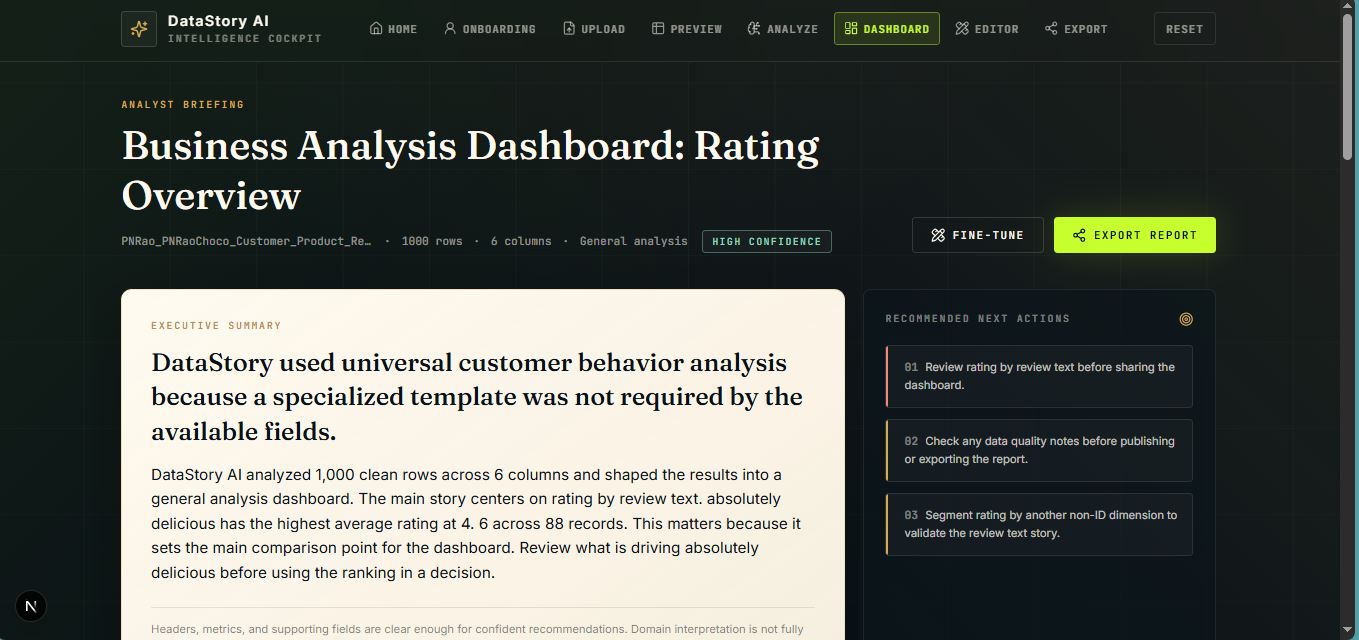
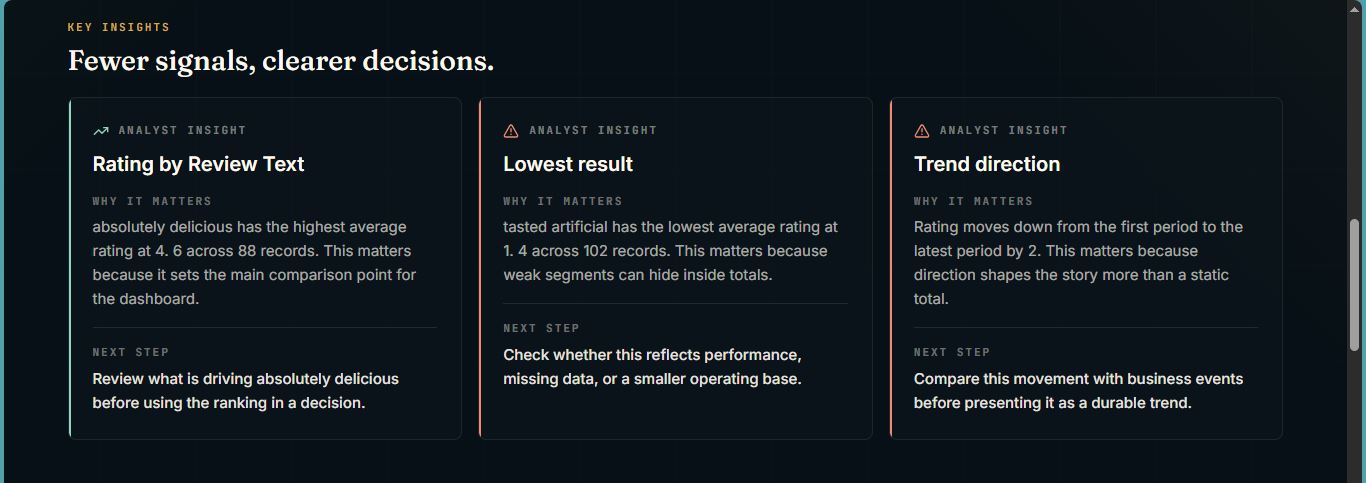
The current DataStory AI application allows a user to upload CSV or Excel data and move through an automated analytics workflow that includes:
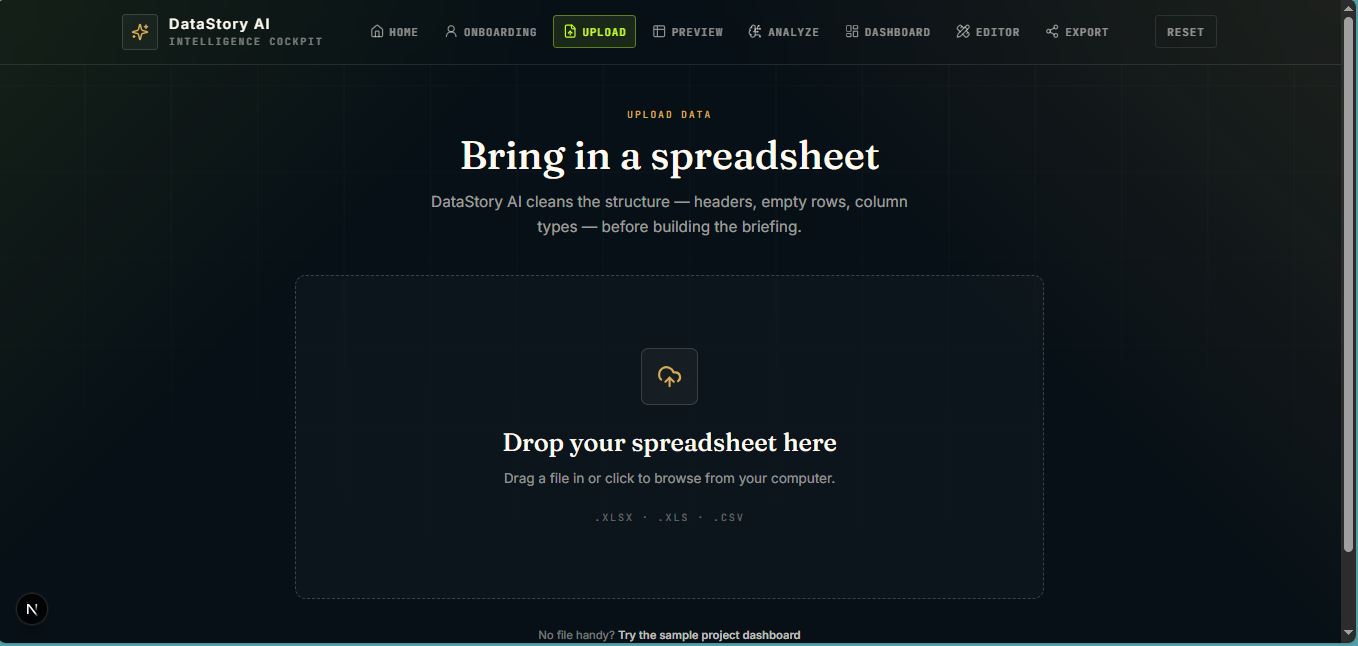
- spreadsheet upload and data preview;
- data cleaning and profiling;
- KPI generation;
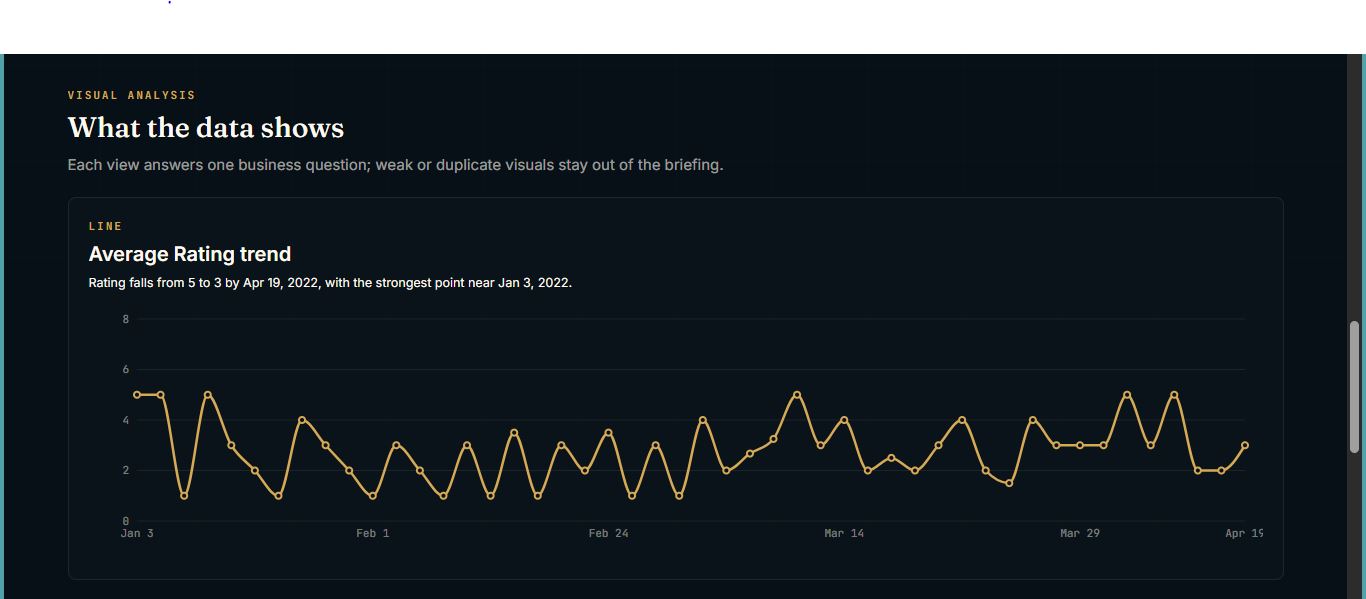
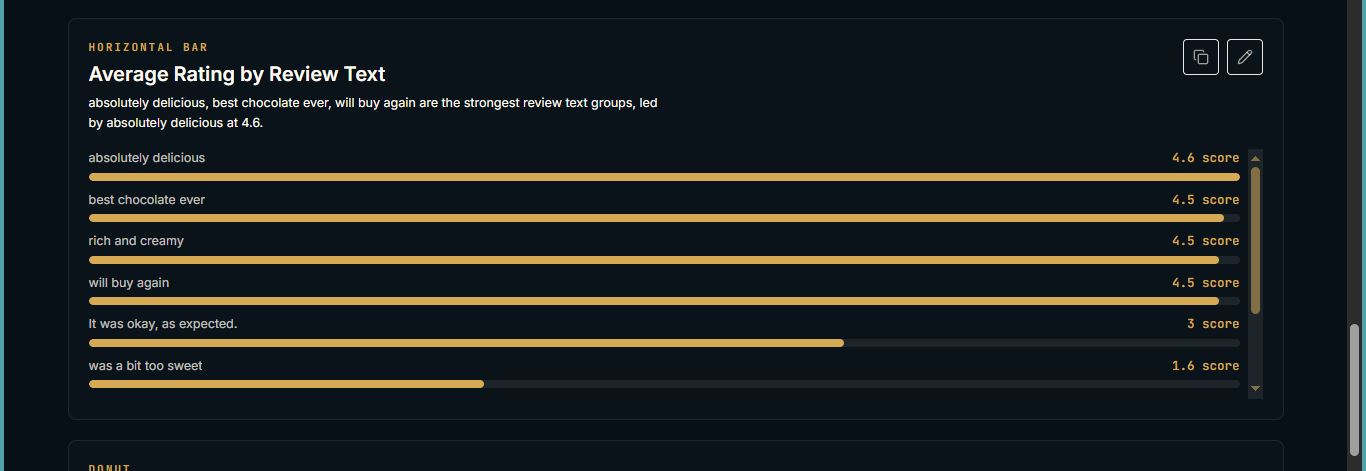
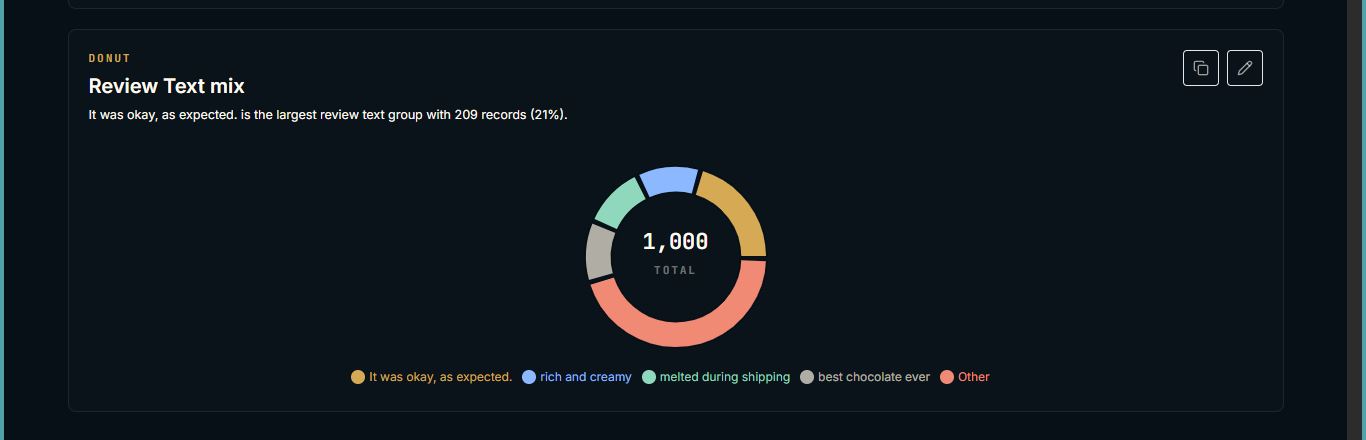
- visual analysis and chart generation;
- business-focused findings;
- limitations and unsupported-analysis warnings;
- briefing-style summaries;
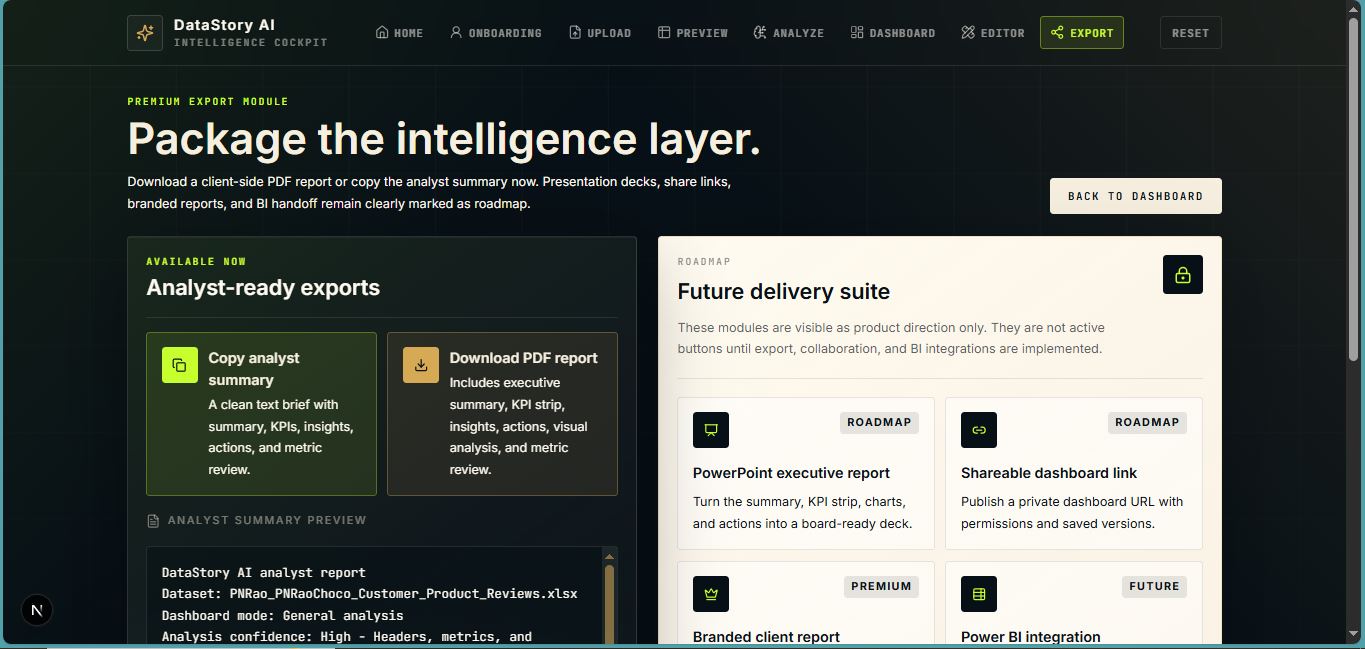
- exportable reporting.
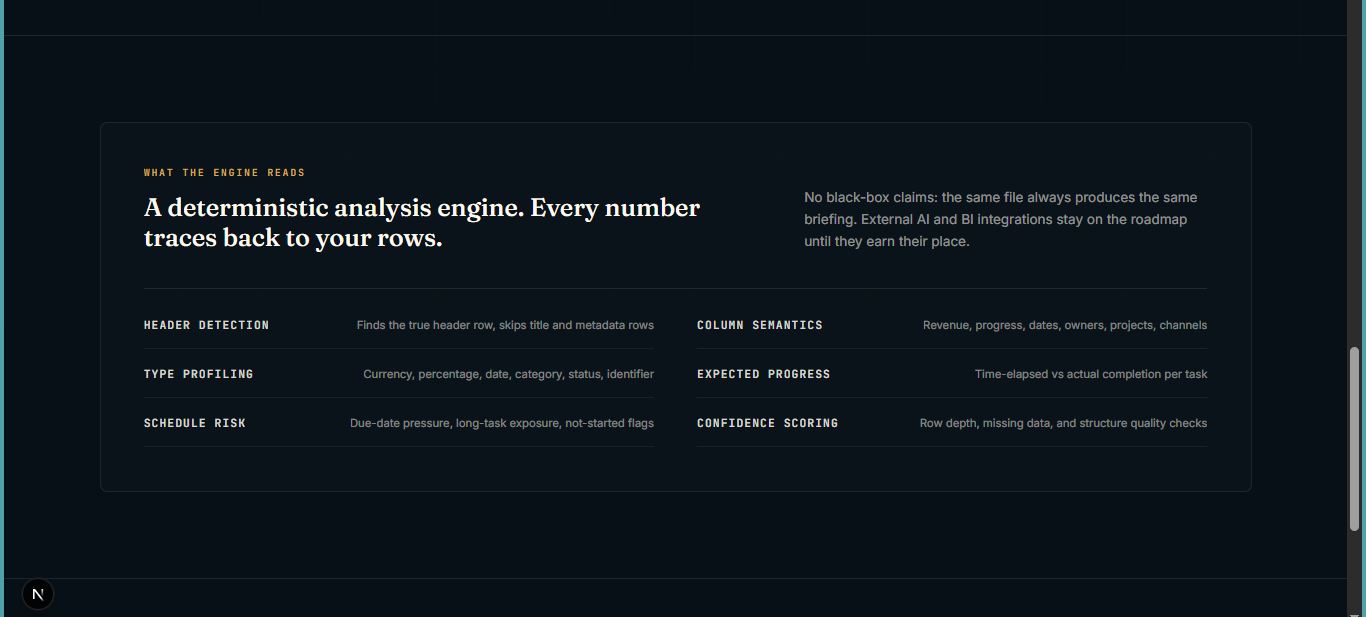
Behind the interface, I developed a canonical intelligence architecture designed to prevent mathematically valid but semantically incorrect analysis.
The system can recognize and reason about 15 analytical domains:
- Sales
- Marketing
- Expenses
- Accounts Receivable
- Logistics
- Customer Support
- Healthcare
- Workforce
- Education
- Media
- Sports Players
- Sports Medals
- Inventory
- Project Management
- General-purpose data
When a specialist domain cannot be identified safely, DataStory AI falls back to generic analytical language instead of inventing business meaning.
How it works
DataStory AI processes information through a sequence of trust-focused layers.
1. Workbook reconstruction
The engine examines sheets, table regions, headers, data rows, totals, notes, dates, formulas, hidden sheets, and source-cell locations.
It preserves provenance so an analytical result can be traced back to the rows and cells that produced it.
2. Semantic understanding
Columns are classified as measures, dimensions, identifiers, dates, money values, percentages, counts, locations, ordinal values, or other analytical roles.
The system applies safeguards such as:
- IDs cannot become summed measures;
- ranks remain ordinal;
- birth dates cannot become event trends;
- expense amounts cannot become revenue;
- inventory quantities cannot automatically become demand;
- shipment or invoice records cannot become project tasks.
3. Canonical metrics
Metrics are represented as structured definitions rather than uncontrolled formulas or generated text.
Examples include:
- revenue;
- average order value;
- conversion rate;
- click-through rate;
- cost per acquisition;
- outstanding balance;
- paid rate;
- on-time delivery rate;
- sentiment rates;
- inventory value.
Definitions, evaluations, units, populations, formulas, filters, and provenance remain separate and independently validated.
4. Analytical facts
The analytical engine produces structured comparisons, rankings, distributions, concentration analysis, trends, anomalies, relationships, and decompositions.
Important distinctions remain explicit:
- a narrow lead is not described as dominance;
- a tie remains a tie;
- a maximum is not automatically an anomaly;
- correlation is not causation;
- static inventory does not prove customer demand;
- negative sentiment and combined-negative sentiment remain separate metrics.
5. Findings and domain intelligence
Analytical facts are converted into evidence-backed Findings.
The engine deduplicates equivalent observations, detects contradictions, preserves contextual differences, suppresses weaker conflicting claims, and identifies important questions that cannot yet be answered.
For example:
- profitability cannot be assessed without cost data;
- invoice aging cannot be calculated without due dates;
- delivery delay cannot be established without promised delivery dates;
- churn cannot be analyzed without retention or churn evidence;
- demand cannot be inferred from static stock alone.
6. Analytical briefings
Trusted Findings are composed into controlled briefing structures for executive, analytical, and diagnostic audiences.
Every positive briefing claim must resolve through an evidence chain:
Briefing → Finding → Analytical Fact → Metric → Semantic Role → Population → Source Provenance
If required evidence is missing or semantically mismatched, the system produces a limitation instead of promoting the claim.
How I used Codex and GPT-5.6
I used Codex and GPT-5.6 throughout the Build Week development process.
Codex helped me inspect the repository, implement the analytical modules, create QA fixtures, run tests, document changes, and manage the Git workflow.
I also used GPT-5.6 as an independent reviewer. After one model completed a phase, I asked another review pass to search for realistic mathematical or semantic failures.
This process repeatedly found issues that were not obvious from ordinary testing. Every confirmed issue was turned into a regression test before I continued to the next phase.
Challenges
The hardest part was preventing results that looked correct but were based on the wrong data.
During testing, I found examples where a system could use Record Count instead of Salary, Quantity instead of Revenue, or treat a maximum value as an anomaly. The calculations could still look valid, even though the conclusion was wrong.
This led me to build the project phase by phase. After each implementation, I used a separate review pass to search for realistic failures. When a failure was found, I fixed it and added a permanent test so it could not quietly return later.
Another challenge was keeping the project deterministic. The same spreadsheet should produce the same metrics, findings, identities, and evidence every time.
Accomplishments
I am especially proud that DataStory AI now includes:
- deterministic workbook reconstruction;
- multi-sheet and multi-table handling;
- source-cell provenance;
- canonical semantic and metric contracts;
- 15 domain intelligence packs;
- safe general fallback behavior;
- trusted filtered populations;
- canonical grouped aggregation;
- contradiction and deduplication handling;
- evidence-safe analytical briefings;
- protected golden regression baselines;
- real and synthetic adversarial datasets;
- repeated QA, TypeScript, lint, and production-build verification.
The live application demonstrates the upload-to-analysis workflow. The new canonical intelligence system has been implemented and acceptance-tested behind a QA boundary, with progressive migration into the production experience planned next.
What I learned
The biggest lesson I learned is that a correct calculation is not automatically a trustworthy insight.
A result also needs the correct metric, rows, filter, unit, population, and business meaning. I learned that it is sometimes better for an analytical system to say “this cannot be answered from the available data” than to generate another confident-looking chart.
I also learned how useful Codex and GPT-5.6 can be when they are used as part of a disciplined process rather than as a one-click builder. Separating implementation from independent review helped me discover problems I would not have found through normal testing.
What’s next
The next stages for DataStory AI include:
- migrating the accepted canonical intelligence layers into the live interface;
- interactive filtering with trusted population tracking;
- visual-planning intelligence;
- structured recommendation generation;
- richer briefing and presentation exports;
- collaborative workspaces;
- saved analytical projects;
- scalable processing for larger workbooks.
The long-term vision is to make DataStory AI a reliable analytical partner for teams that need more than dashboards—they need clear, defensible and decision-ready understanding.
Built With
- businessintelligence
- codex
- css3
- csv
- excel
- git
- gpt5.6
- html5
- javascript
- next.js
- node.js
- react
- typescript


Log in or sign up for Devpost to join the conversation.