2.2.3 Answer 1
The “Text Import Wizard ” would guide you through the process of identifying variables by column. Import it and determine the total number of school districts.
There were 17604 school districts between 2017-2018 according to the excel file
2.2.3 Answer 2
The previous file counts the total number of rows in the file. Does this number coincide with the number produced by Excel?
The python method of counting rows does not accurately count the rows in the dataset because it interprets newlines wrapped in double quotes as a new row of data. This adds 9 new rows of data which are counted as school districts.
We used chat gpt to write a python script that could find these data anomalies an example
of one of these data anomalies can be found online 14041 of the LEA Characteristics.csv data file :
","jswan@reach.connectionsacademy.org","JANE","SWAN","7177048437
","jswan@reach.connectionsacademy.org","JANE","SWAN","7177048437
","jswan@reach.connectionsacademy.org","No","Yes","Yes","www.connexus.com","No"
2.2.3 Answer 3
Why would you need encoding=“cp1252” for US data?
cp1252 is needed for encoding spanish characters like ñ on cell D2797
CA  CALIFORNIA  06CC340 Opportunities for Learning ñ Duarte
CA  CALIFORNIA  06CC341 Options for Youth ñ San Bernardino
2.2.3 Answer 4
This number does not match the CRDB database, but both databases claim to have the list of school districts in the US in the period 2017-18. Explain why
While we we're unable to find out exactly why this discrepancy exists we we're able isolate the extra entries from the larger dataset by creating two sqlite tables with each csv file, then running the following query.
sqlite-utils lea_vs_edge.db "SELECT e.*
FROM edge e
LEFT JOIN lea l ON e.leaid = l.leaid
WHERE l.leaid IS NULL;" >> in_edge_not_lea.json
This creates 2100 line json file containing rows not found in LEA Characteristics.csv.
2.4 Intermediate Challenge
Importing Data From CSV to a Postgres DB
We used pandas and sqlalchemy to import the CRDC csv files to our postgresql database, the file names were used as table names.
valid_csvs = glob.glob(f"GRF17/csv/**/*.csv", recursive=True)
for csv in valid_csvs:
    table_name = csv.split("/")[-1].split(".")[0]
    table_name = table_name.replace(" ", "_").replace("-", "_")
    csv_to_sql(csv, table_name, engine, encoding="cp1252")
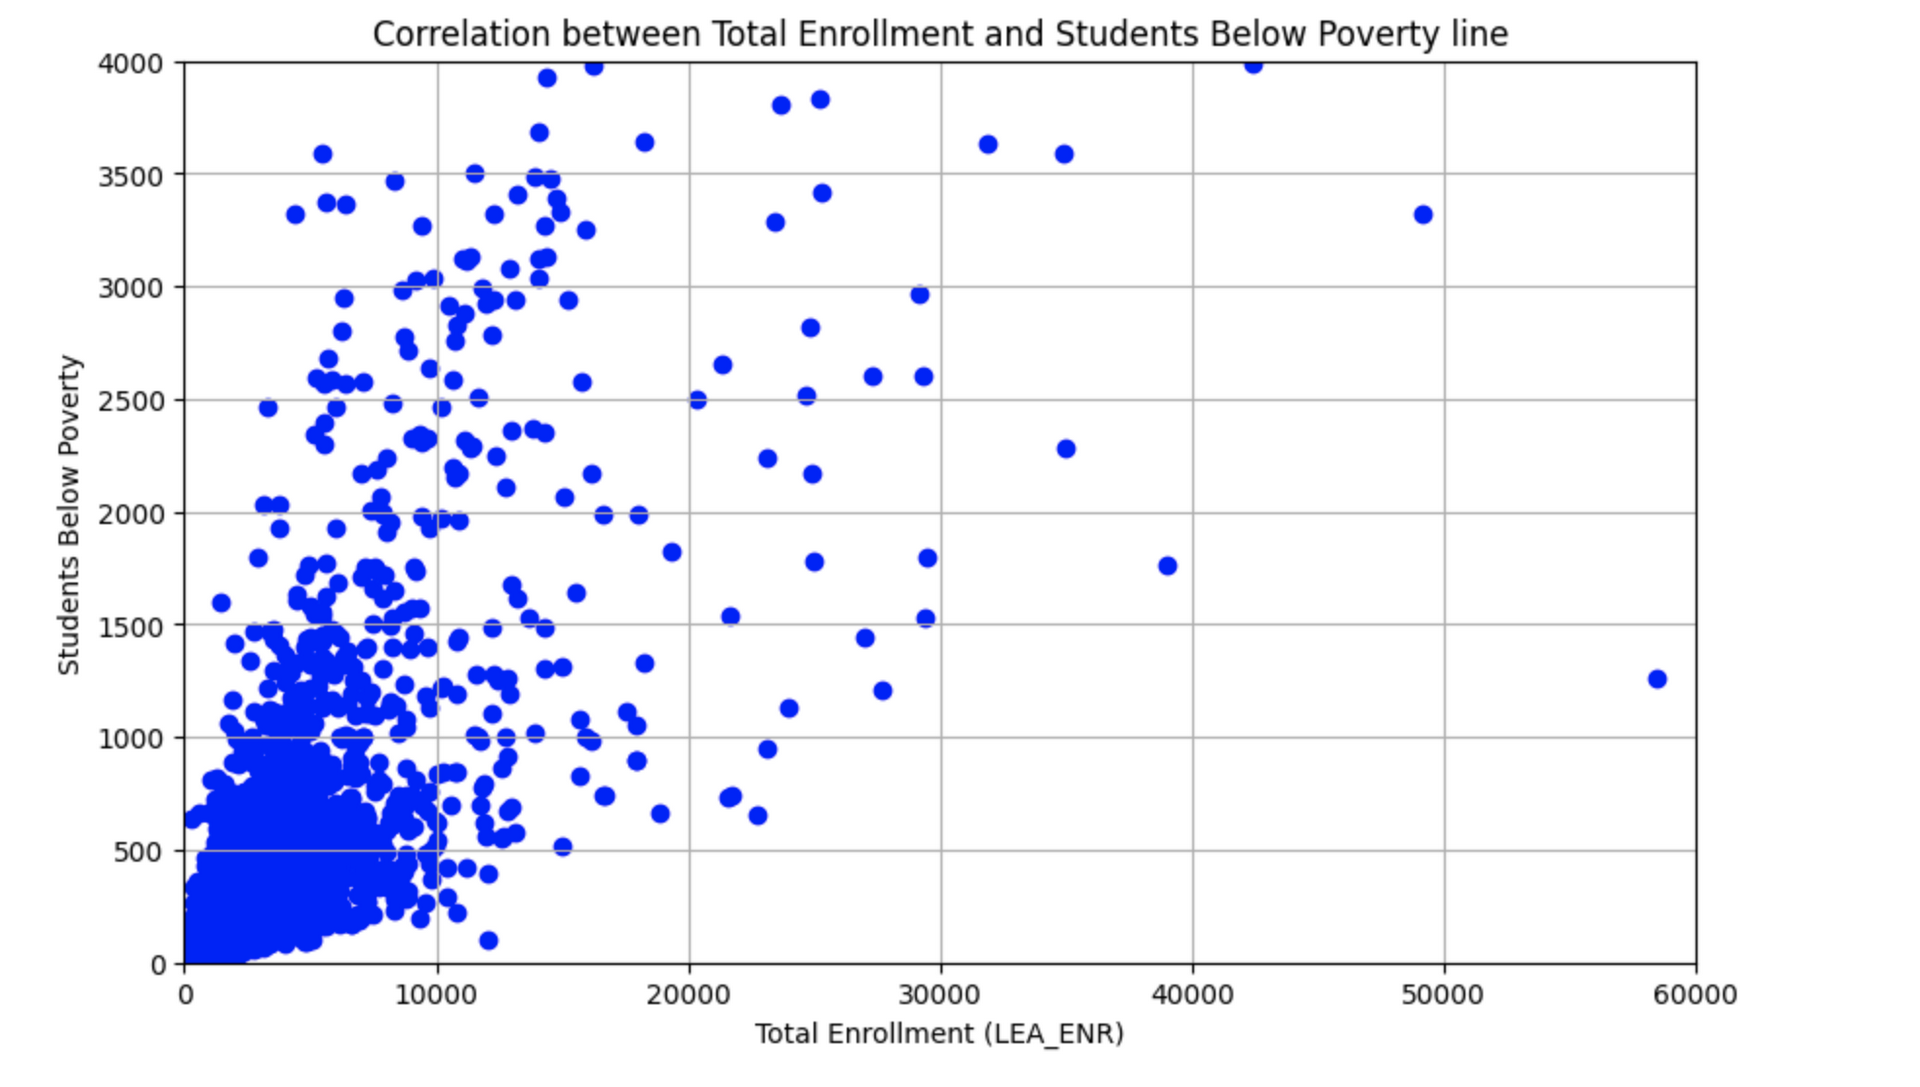
Correlation between poverty and total enrollment
Only about 5513 of the 17614 LEA datapoints had usable poverty statistics from the Small Area Income and Poverty Estimates dataset. Plotting the zip codes out on a map of the US it revealed that several states were missing from the dataset as well.
The following scatter plot shows the number of 5-17 year olds in a school District Estimated to be in poverty over the total enrollment numbers for that district. The graph seems to scale proportionally to the over all enrollment size.
Census income report correlation with highschool accademic performance
school districts to census tracts and determine whether the income reported in the Opportunity Atlas has correlation with academic performance in high school
Scatter plot showing the relationship between total number of students in Bexar count who passed algebra 1 and their predicted income at the age of 35 by Opportunity Atlas.

Using algebra 1 as a metric for measuring success of a person when they are 35 is inherently, flawed however we used it because it was the only datapoint that contained a definitive "pass/fail" score. Ideally we would have preferred using ACT/SAT scores.
Built With
- docker
- jupyter
- matplotlib
- postgresql
- python

Log in or sign up for Devpost to join the conversation.