-
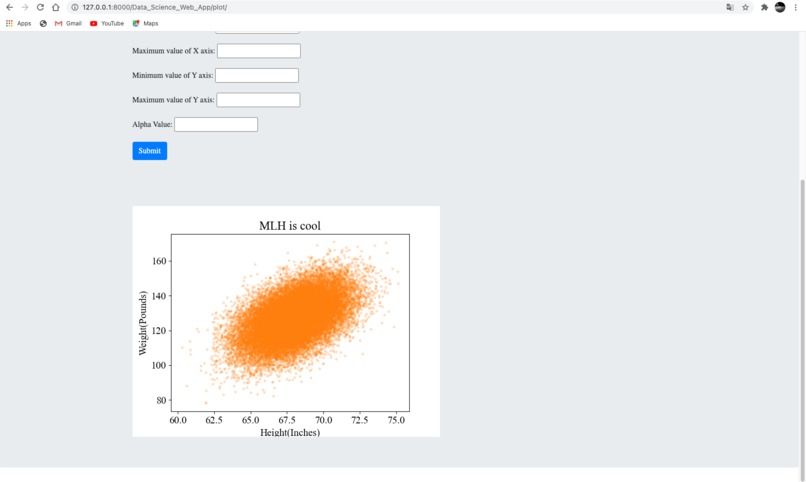
Website doing its work
-
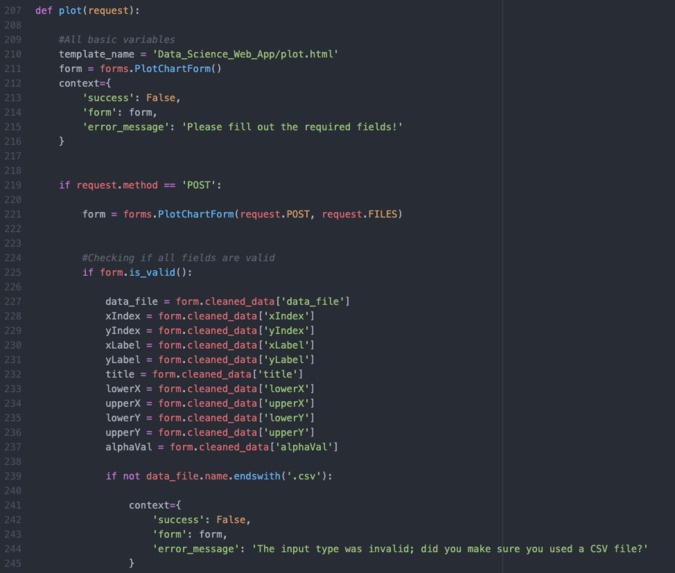
Django Code 1
-
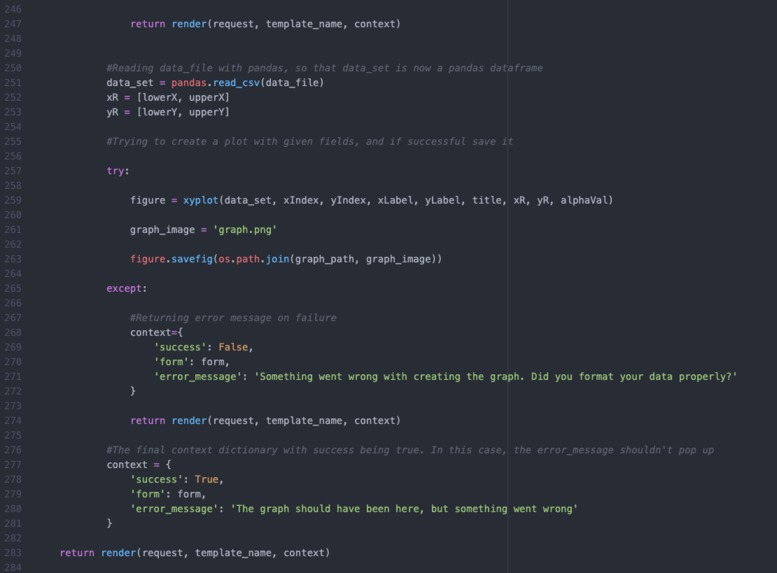
Django Code 2
-
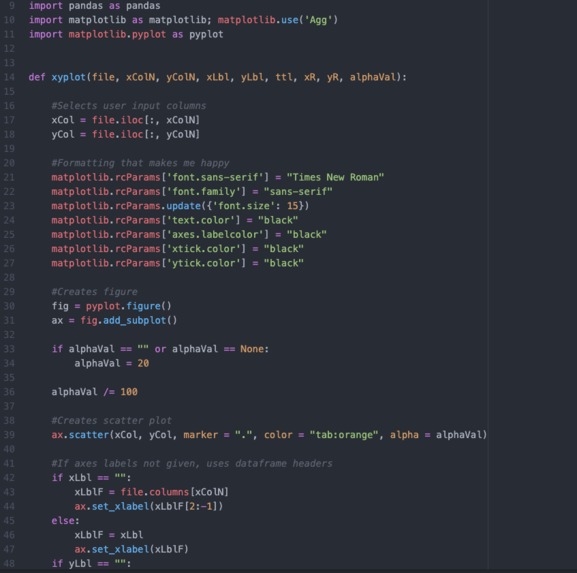
Matplotlib

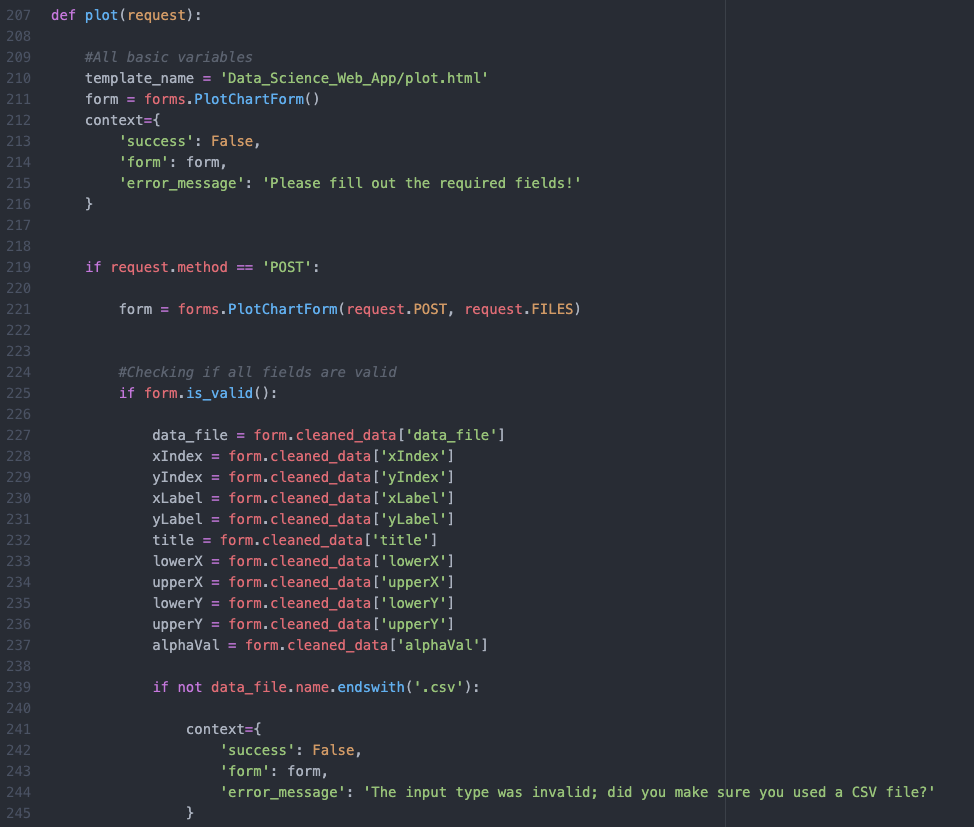
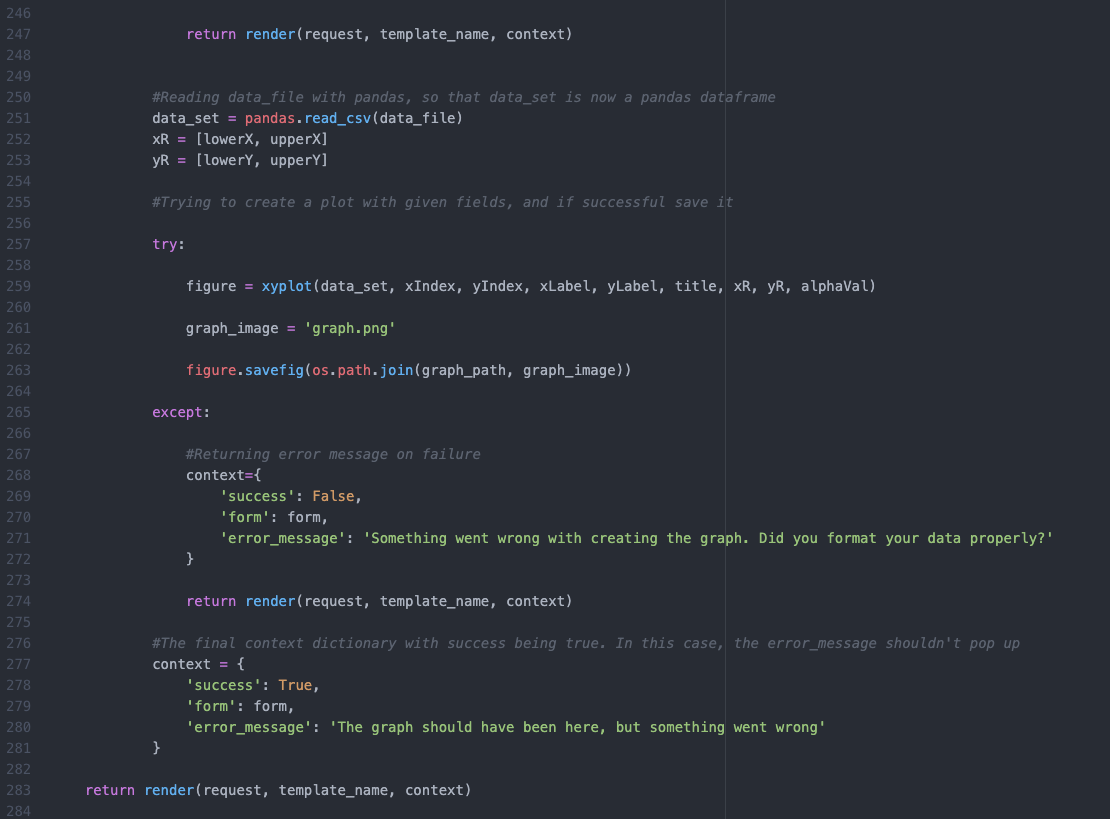
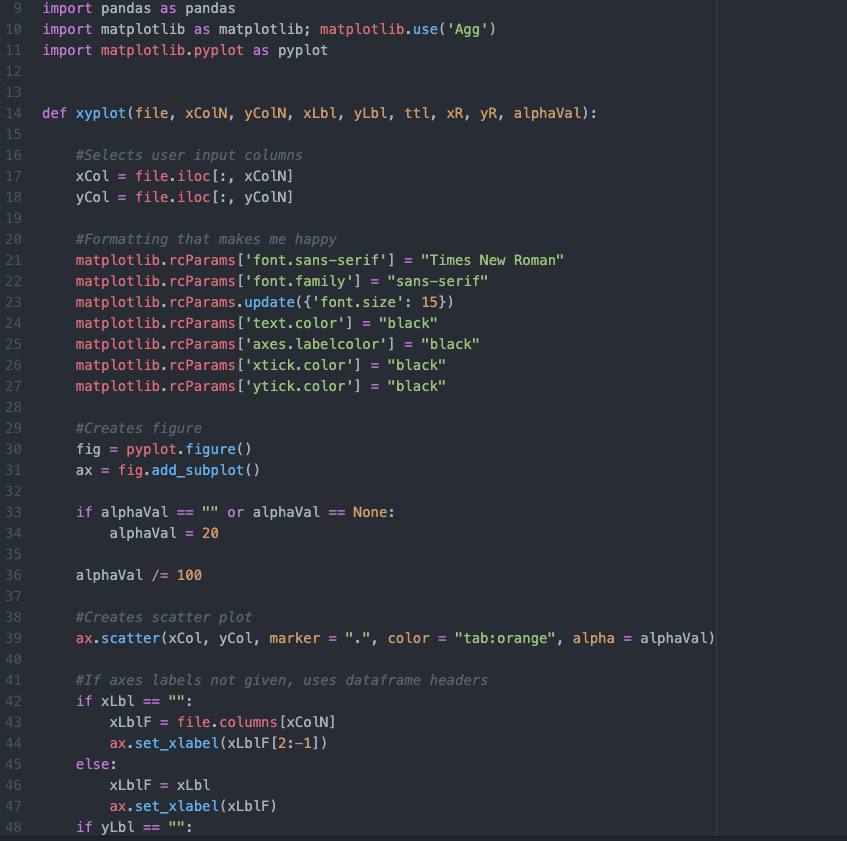
In this website, the user can input csv files into the website and the website will generate a scatterplot of the data. The website is built so that the user can specify some parameters such as Title, ranges, and even an alpha value.

Log in or sign up for Devpost to join the conversation.