-
-
Temperature Data
Inspiration
The inspiration behind this project has been a YouTube video where we learnt about the Earth's rising temperatures, that the Earth's temperature has gone up and up ever since human activities took place abundantly. It specifically mentioned the city of Kolkata where temperature rise will have a huge impact on people's lives, and that in the coming 50 years of time, the earth's temperatures will have risen by 4 deg Celsius on an average.
What it does
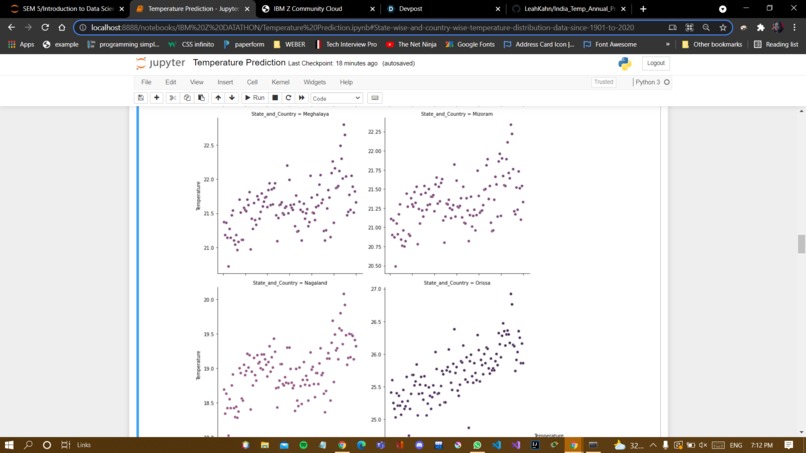
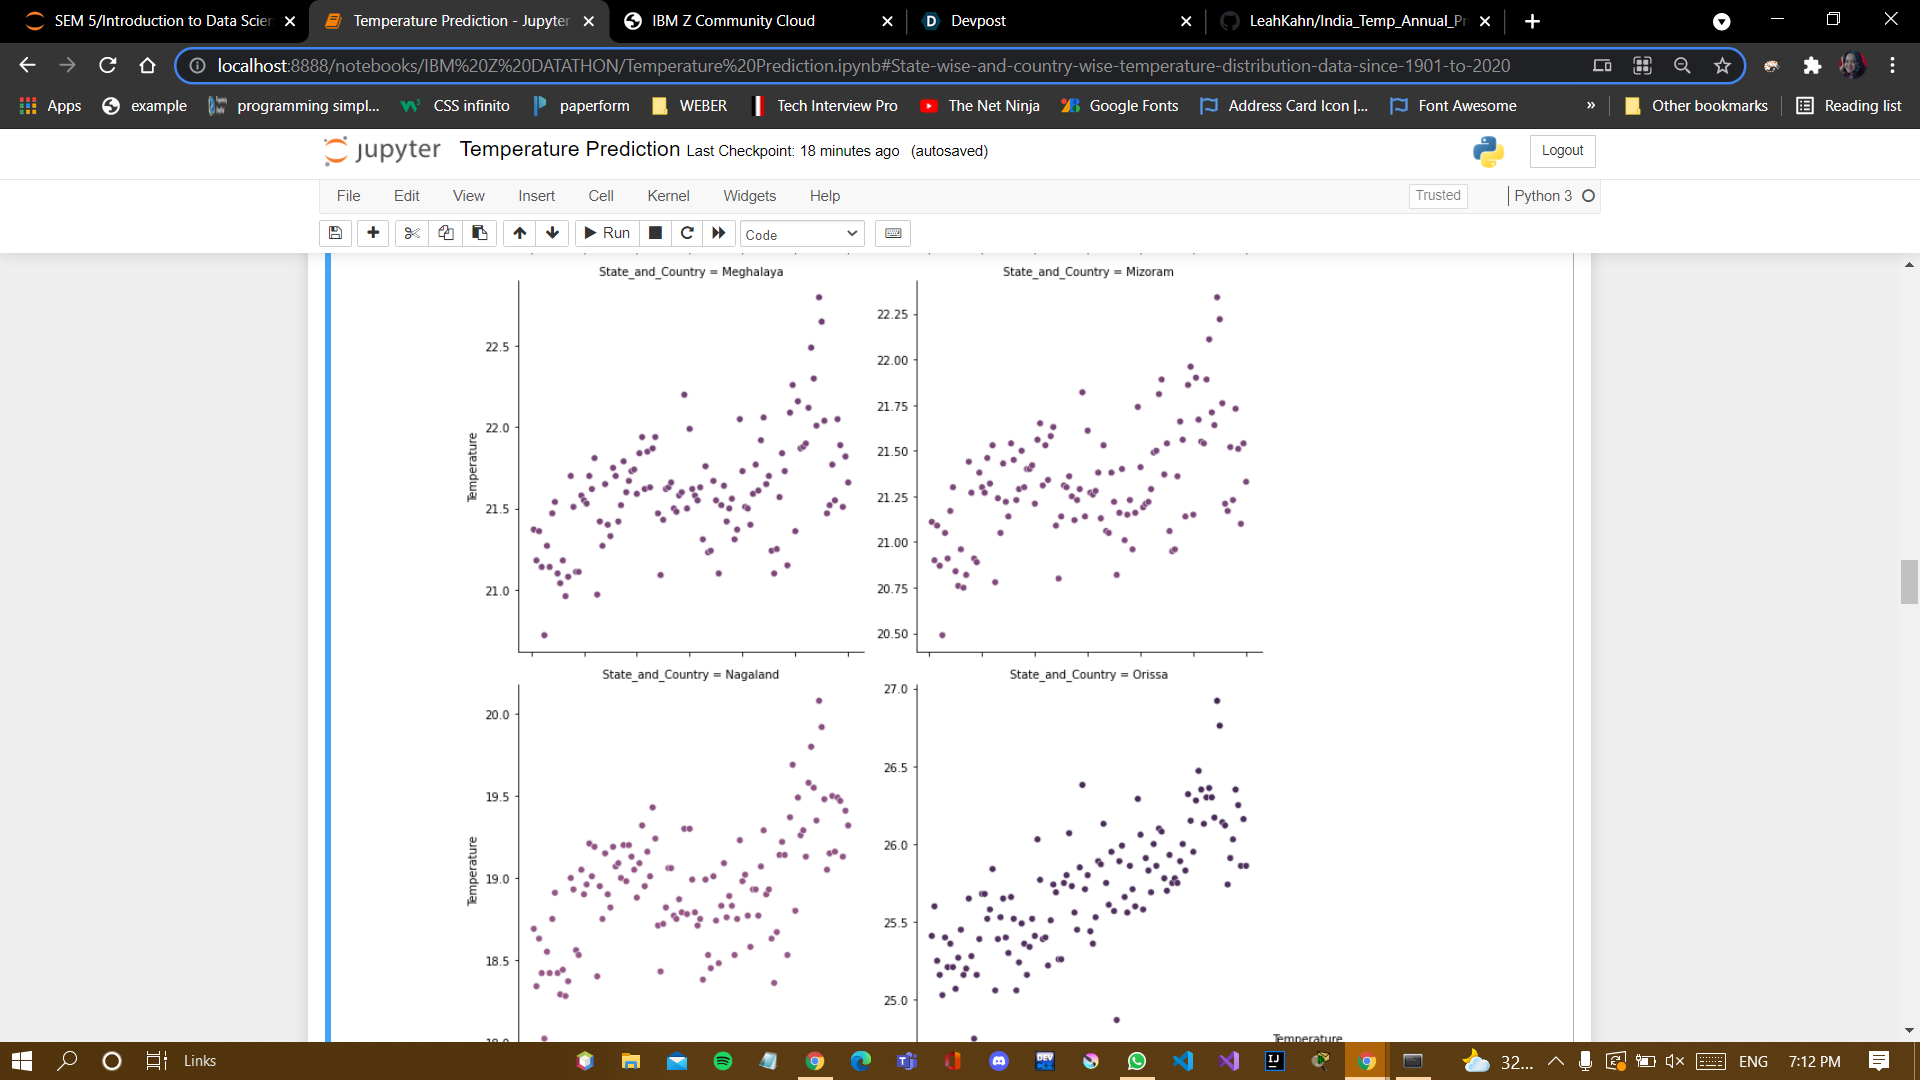
It has the dataset of India's temperatures since 1901-2020 and using this dataset we help the user get insights on each state's temperature makeup since 1901 and we help them get a deep visualization of the dataset based on each state as well as India, which will help them get insight and stay informed about the temperature rise our country is going through
How we built it
We built it using python's scientific and visualization modules.
Challenges we ran into
We ran into many errors while running this project specifically related to module installations and had much of our time cut there.
Accomplishments that we're proud of
We're proud that we have been able to make use of the Data Science concepts of EDA, Crosstabulation, Visualization and Chi-Square Testing's to present our insight that e believe will prove informational to the common people to take actions on their daily-activities and prove value to the Data Science Environment focused communities to see a century of data properly given insight into.
What we learned
We learned to apply our Data Science skills into practise with India's Yearly Temperature dataset
What's next for Data Scavengers Team - 6
We will focus on predictive analysis to prove one of the biggest challenges, i.e. to be able to predict years and years of future temperatures using more datasets that will have more variables to work on like humidity, seasons, industrialisation details, etc.
Built With
- matplotlib
- numpy
- pandas
- python
- scikit-learn
- seaborn


Log in or sign up for Devpost to join the conversation.