-
-
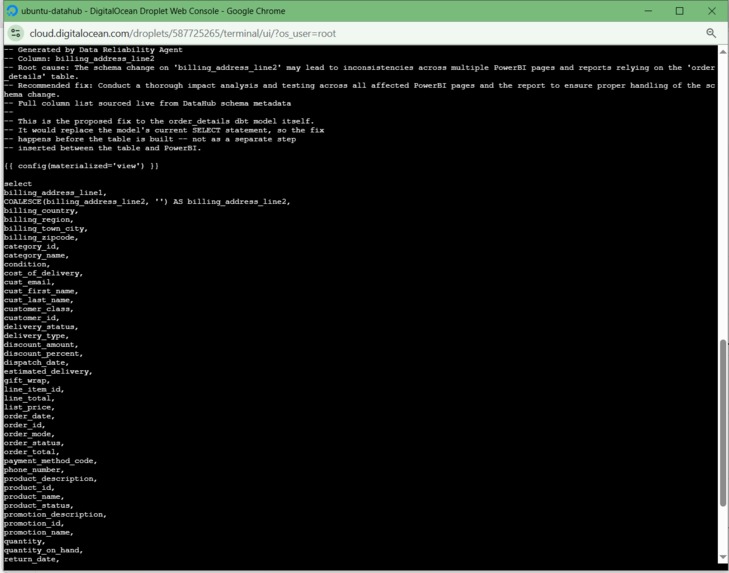
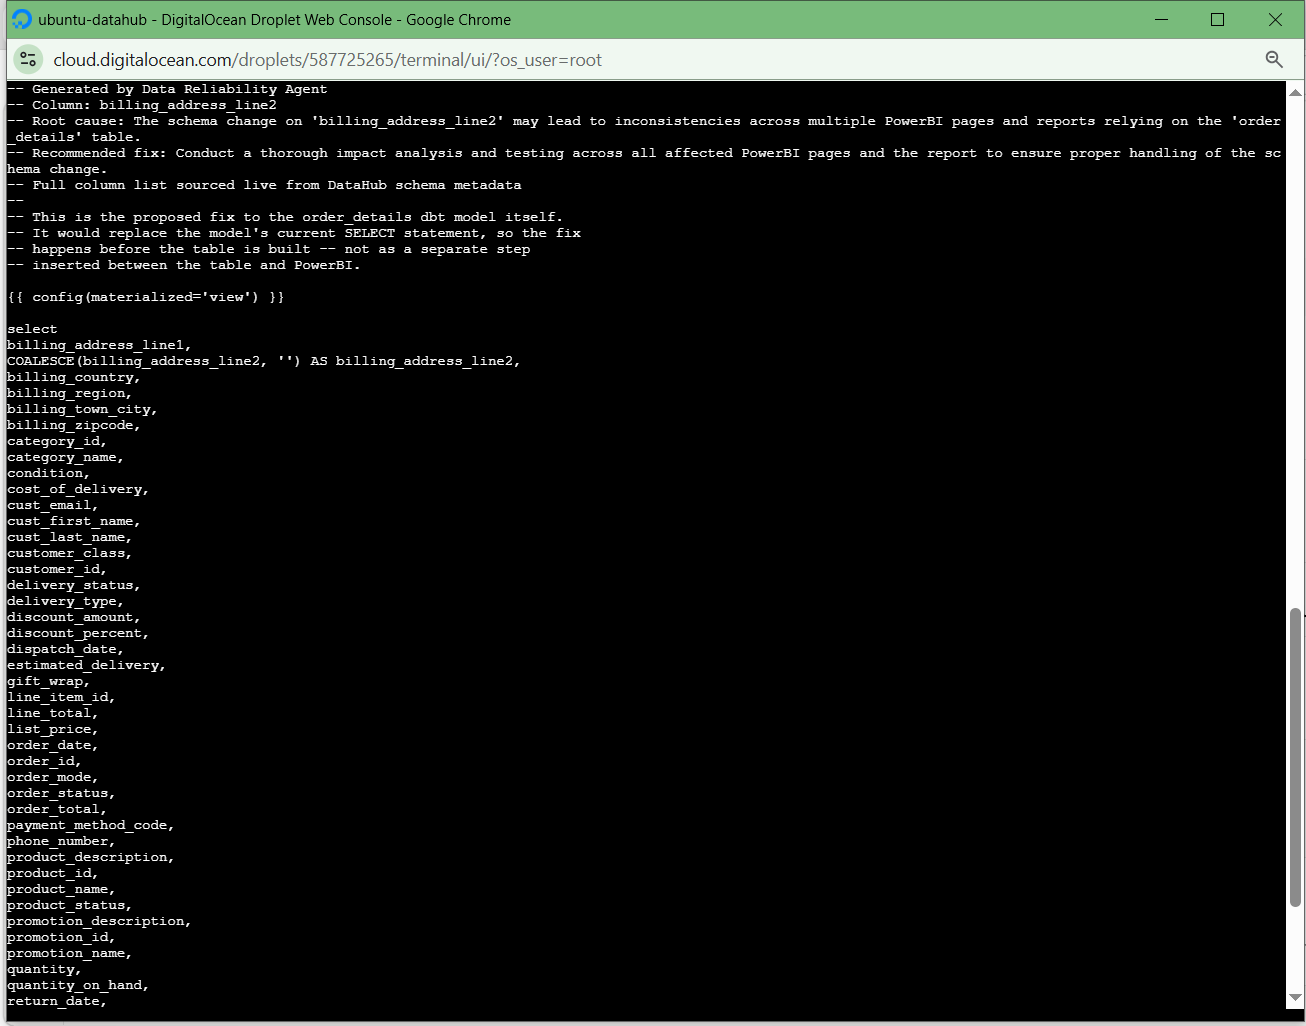
generated-dbt-patch-for-human-review
-
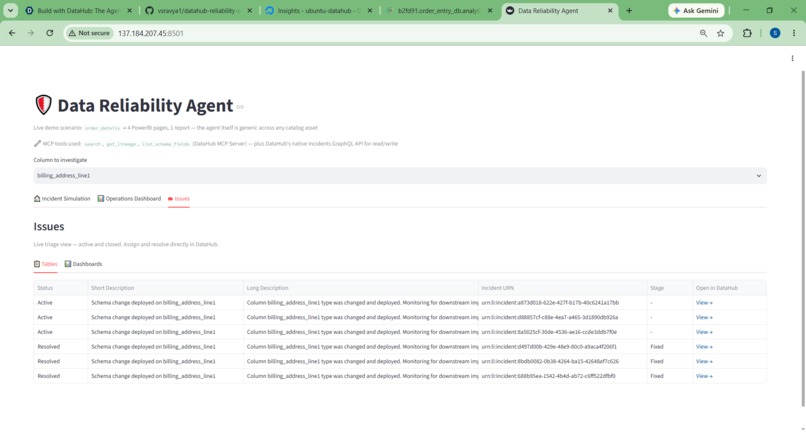
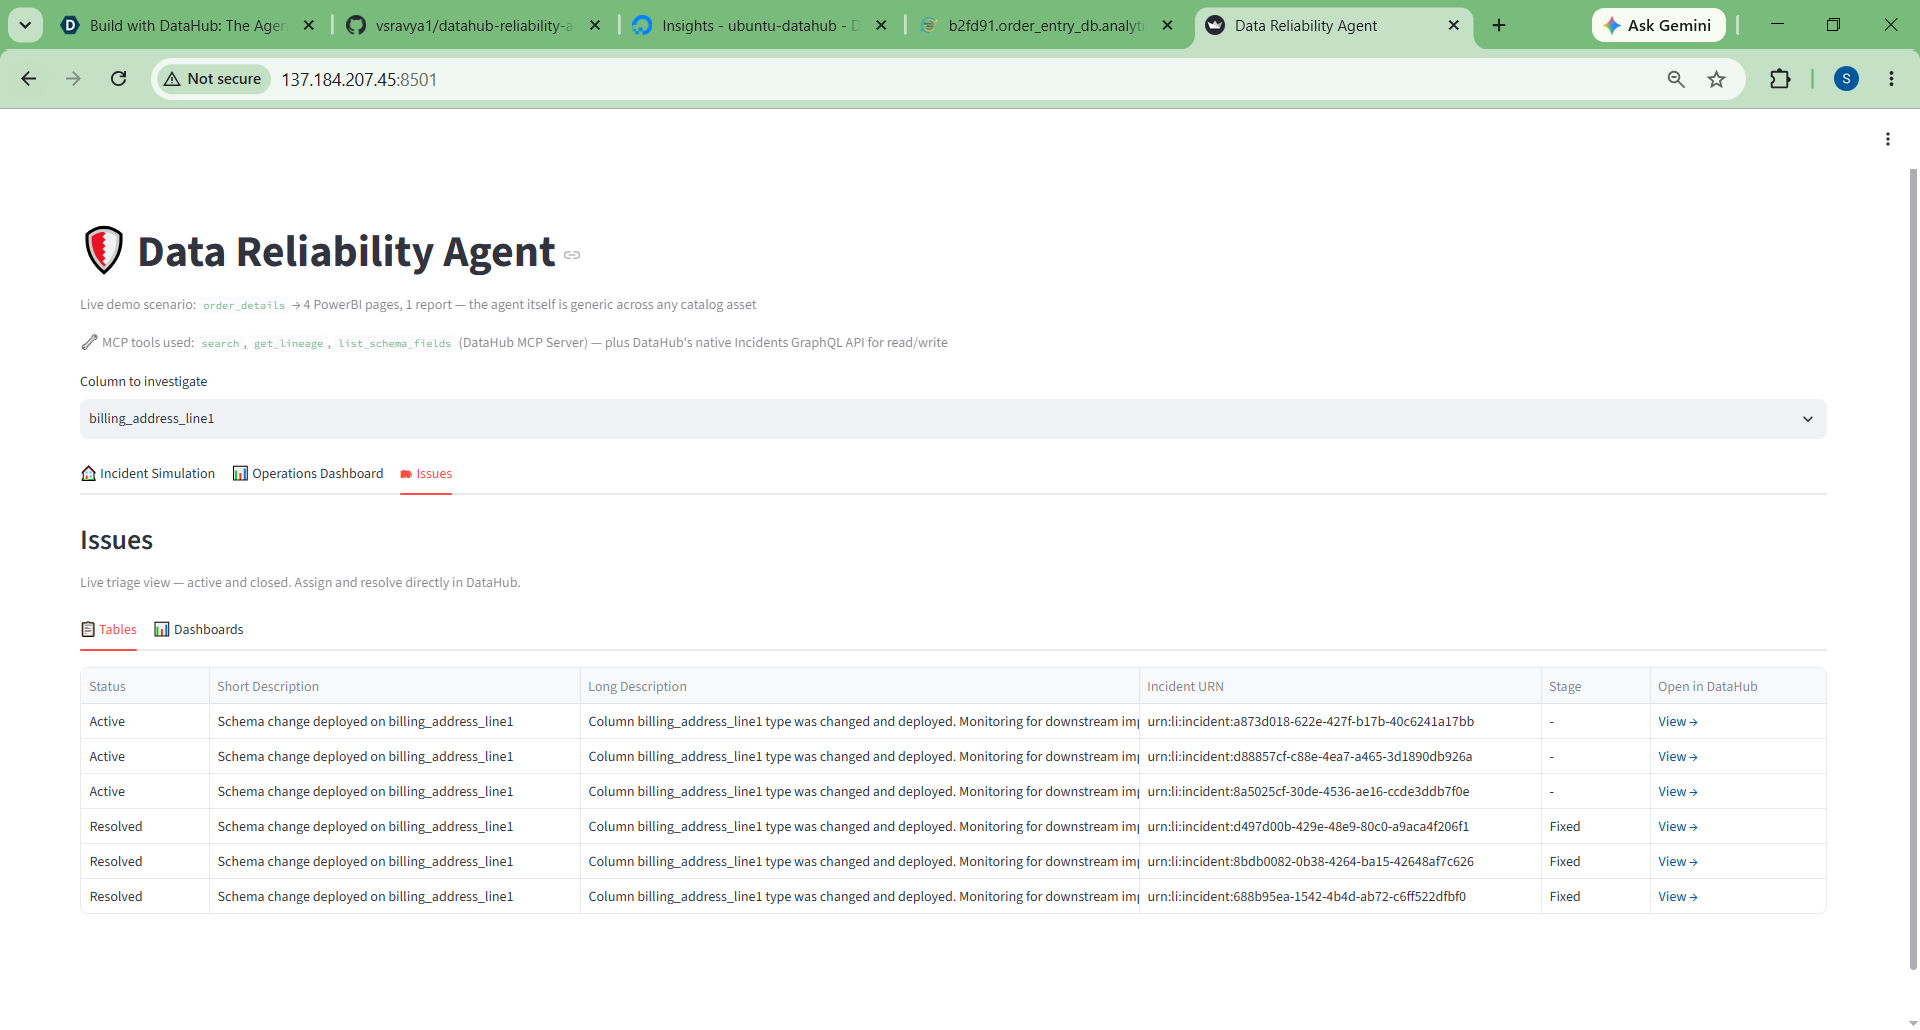
Issues in Dashboard/Tables
-
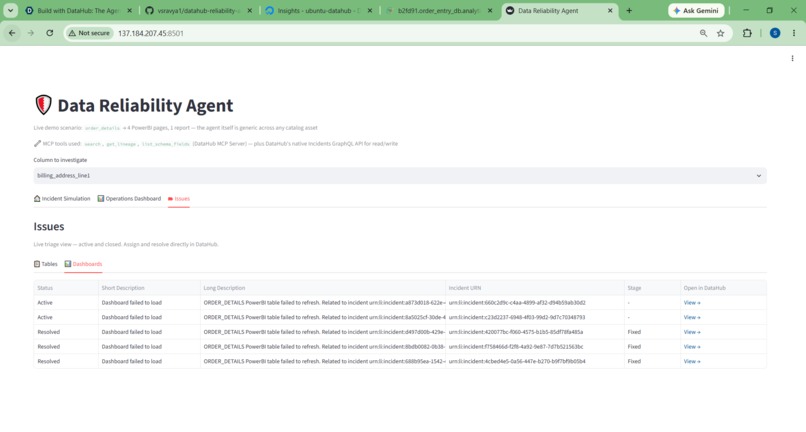
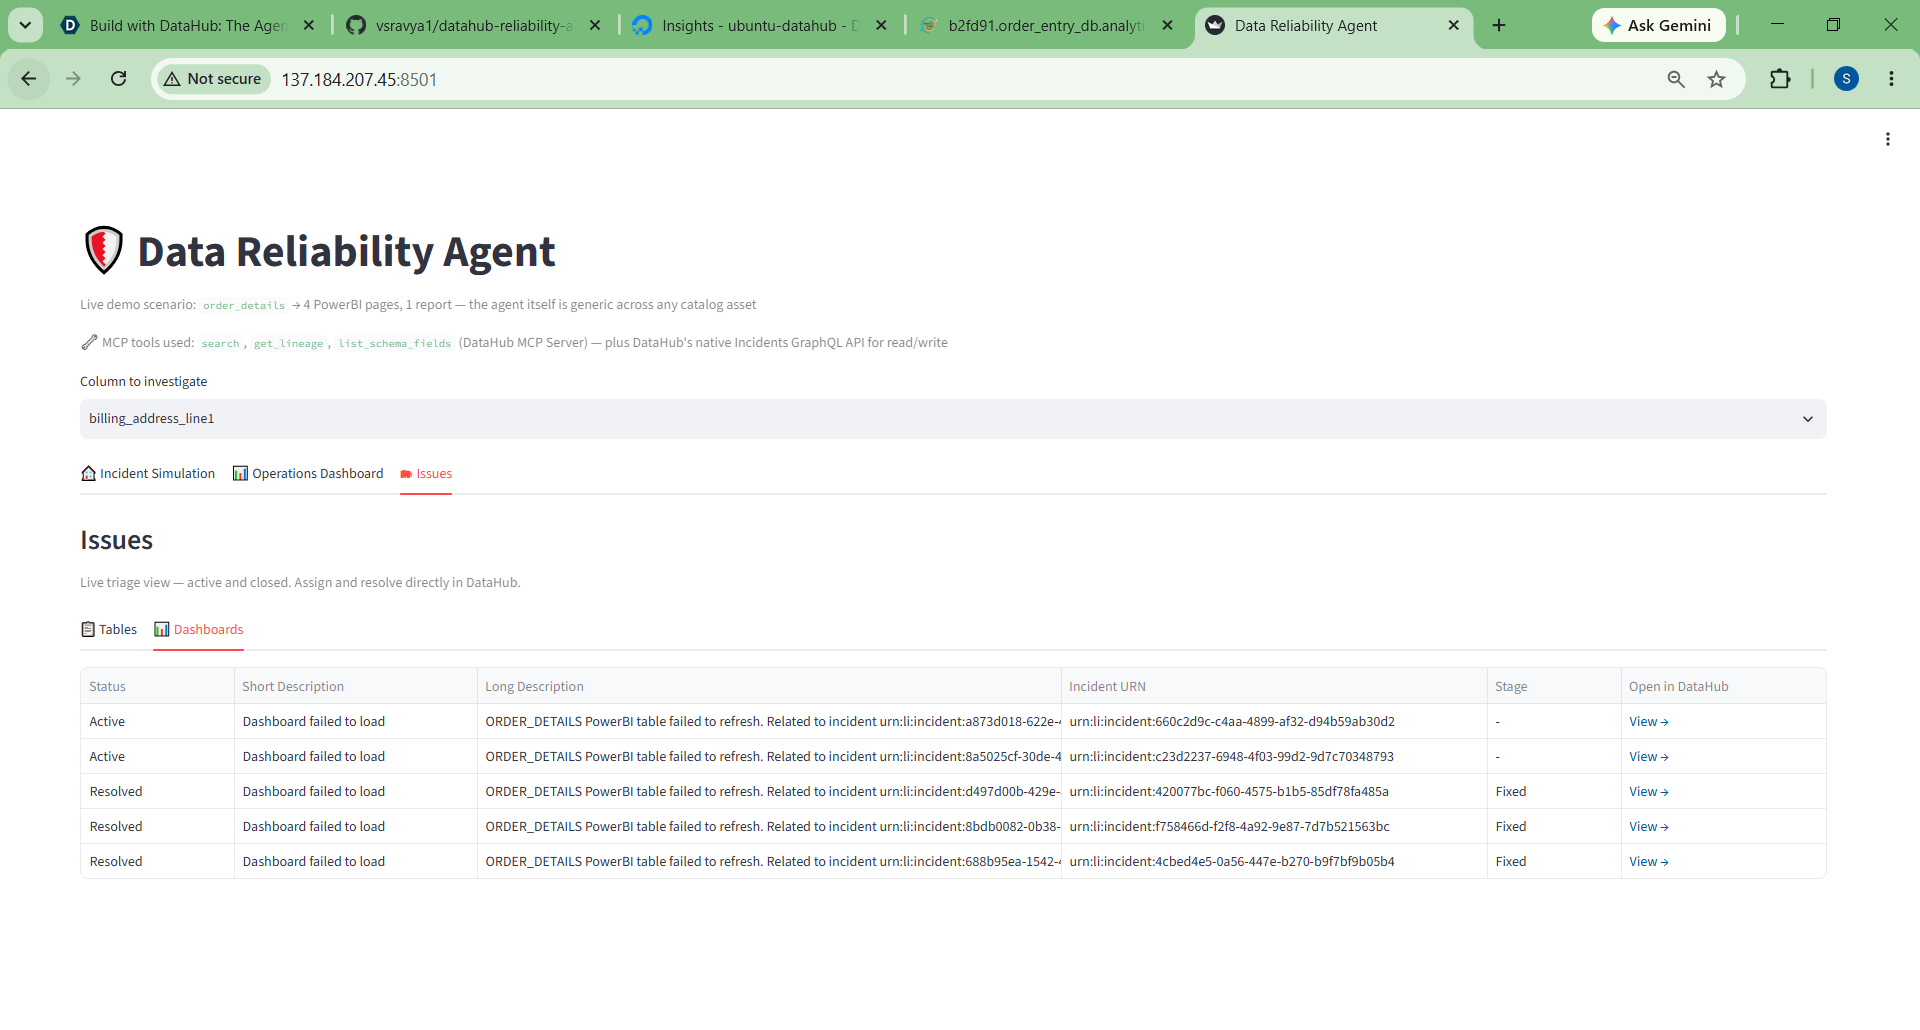
Issues in Dashboard/Tables
-
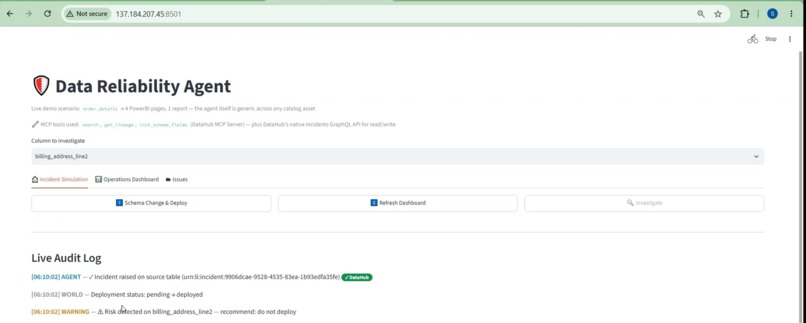
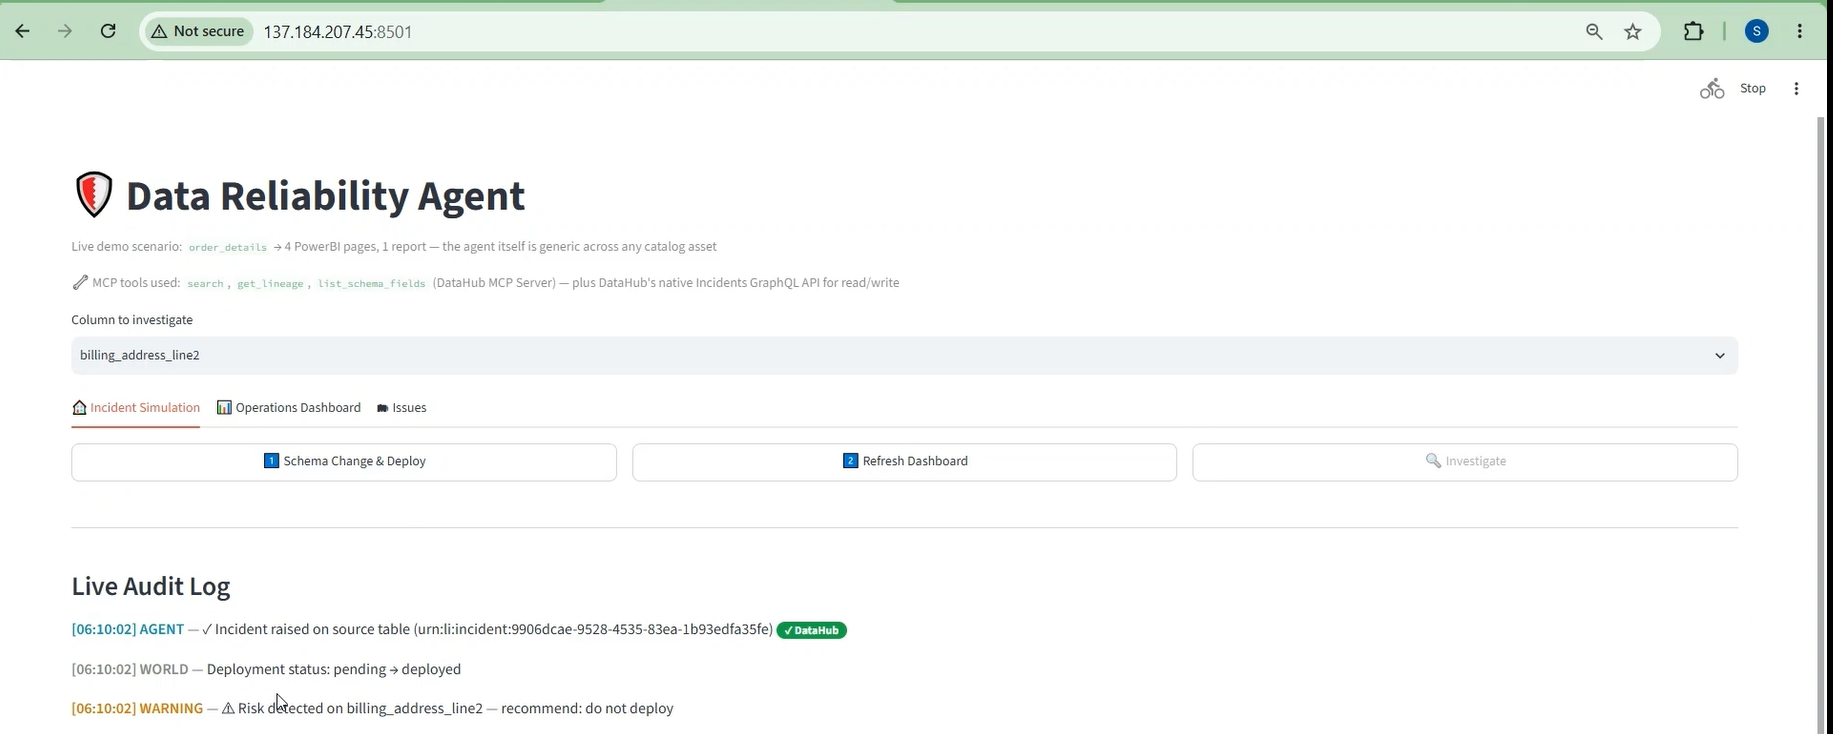
agent-writes-incident-to-datahub
-
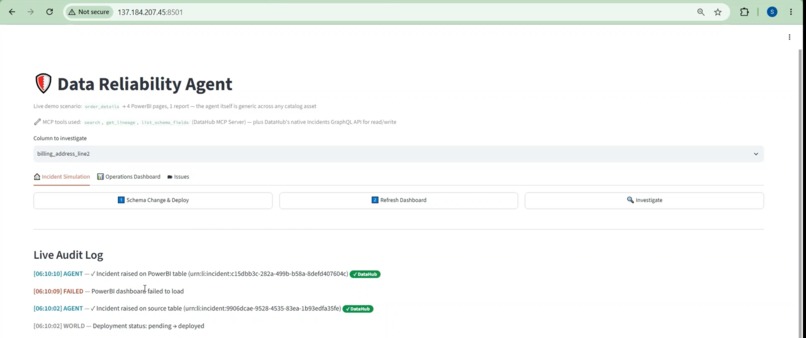
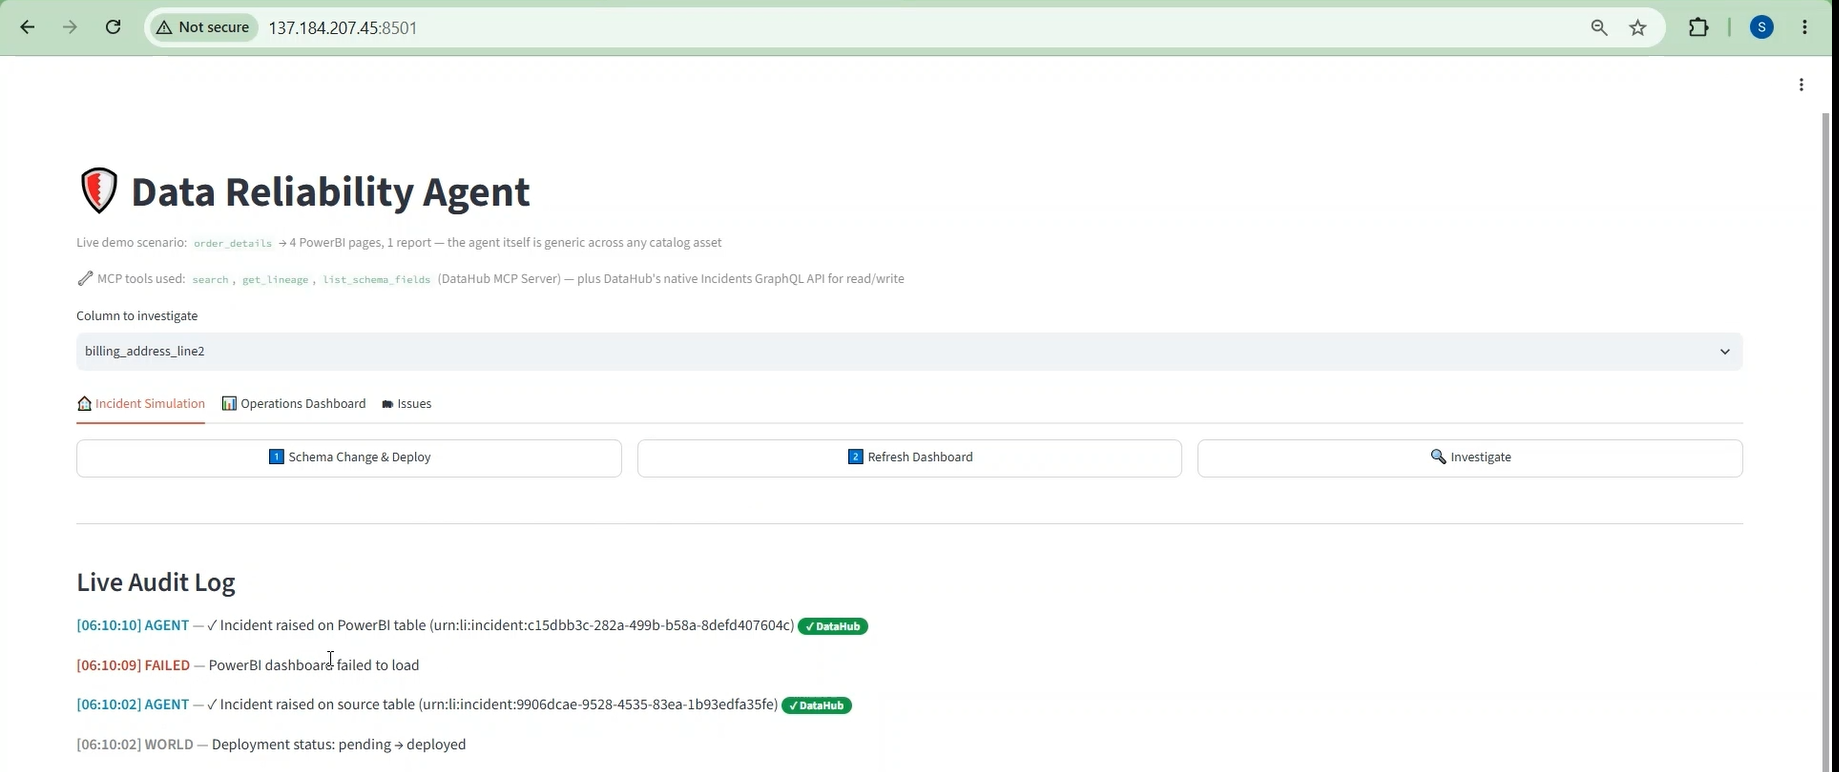
agent-writes-incident-to-datahub-powerbi
-
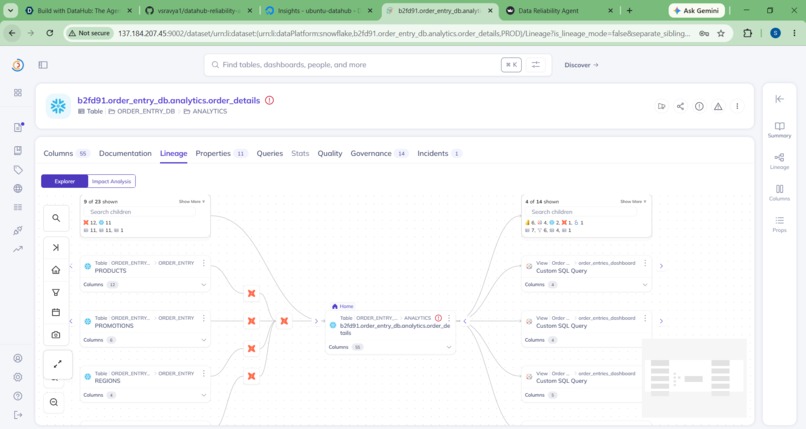
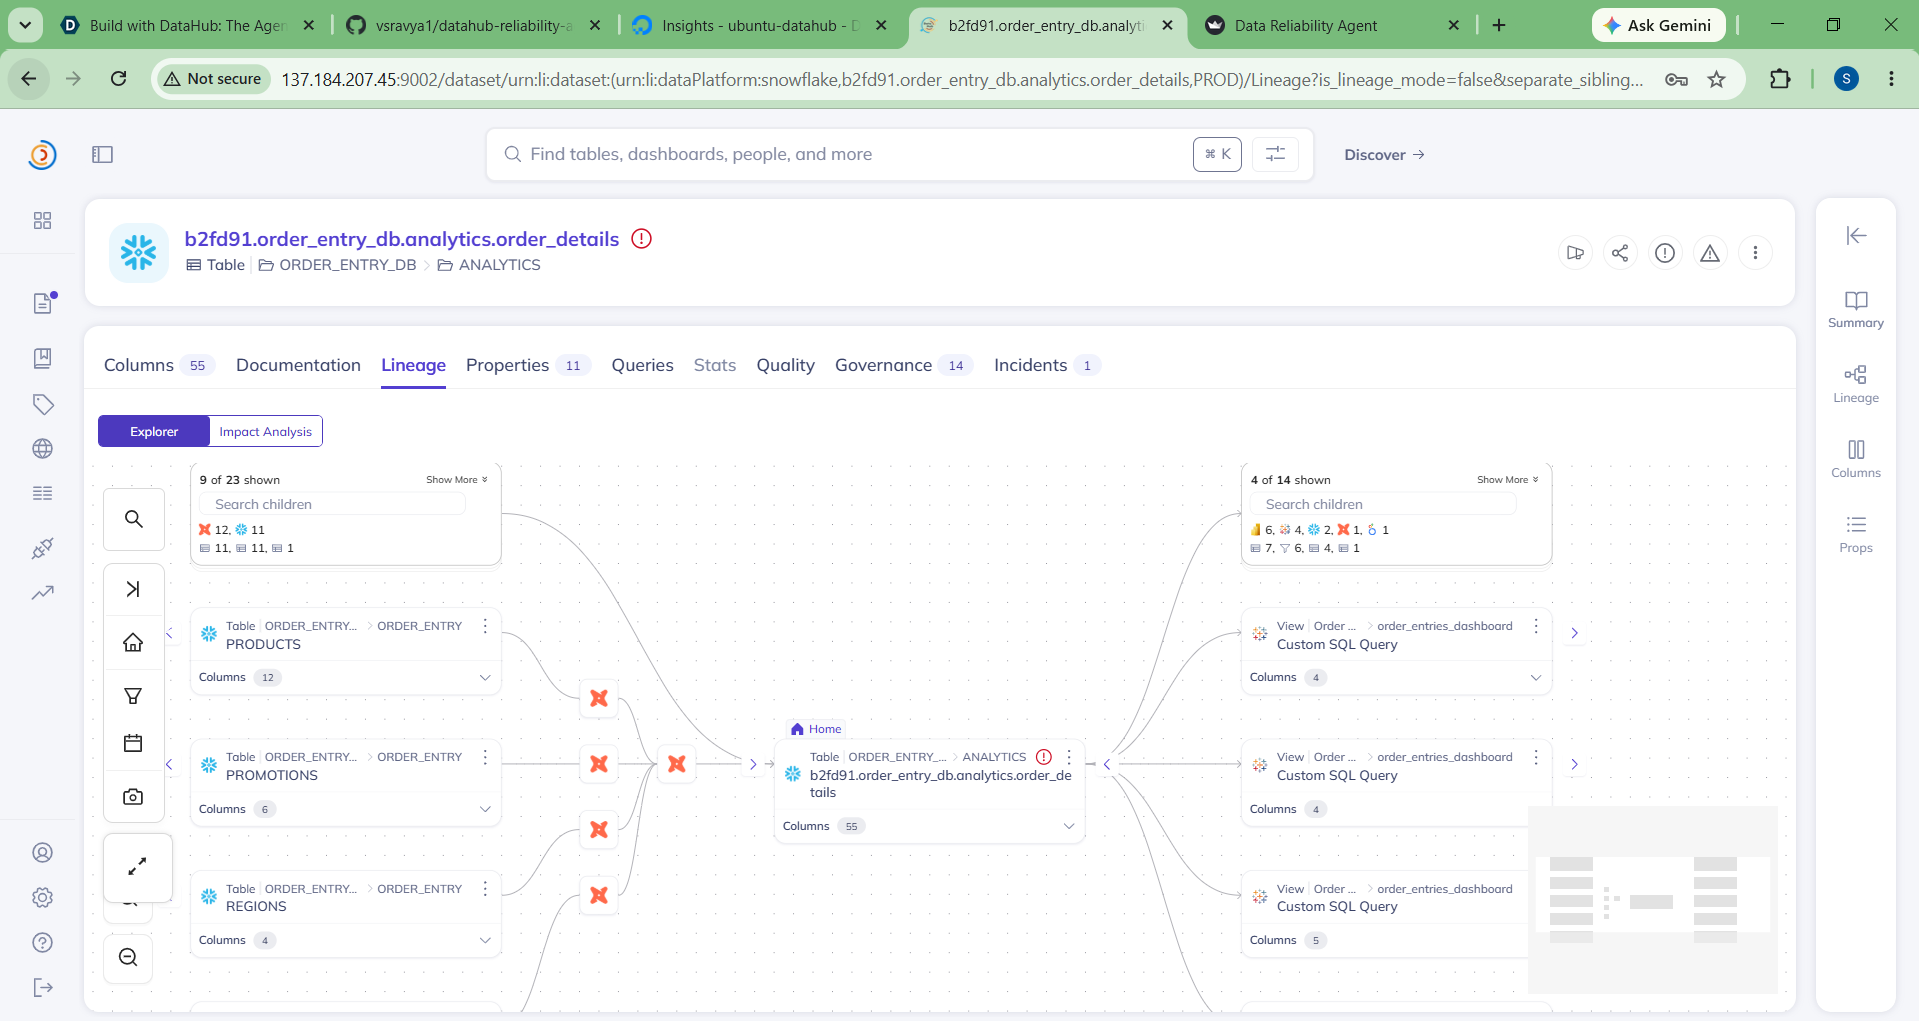
Lineage
-
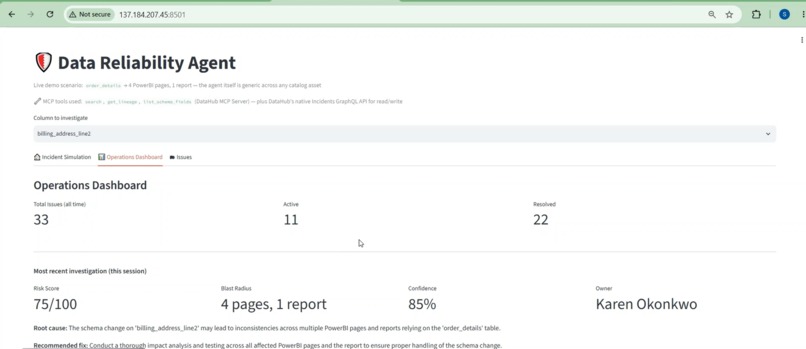
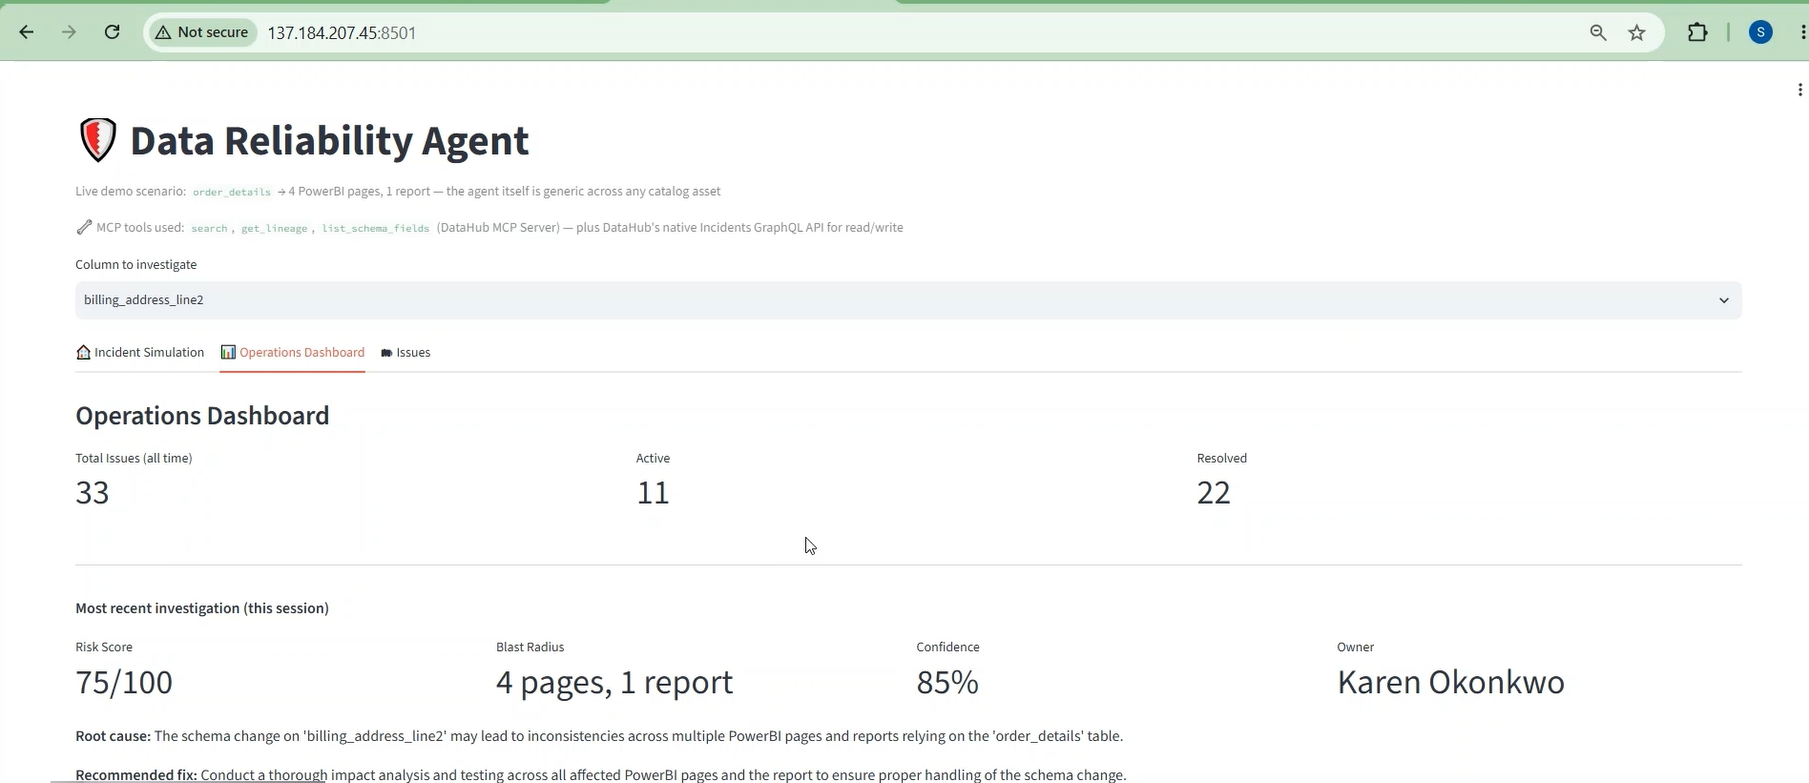
Operations dashboard
-
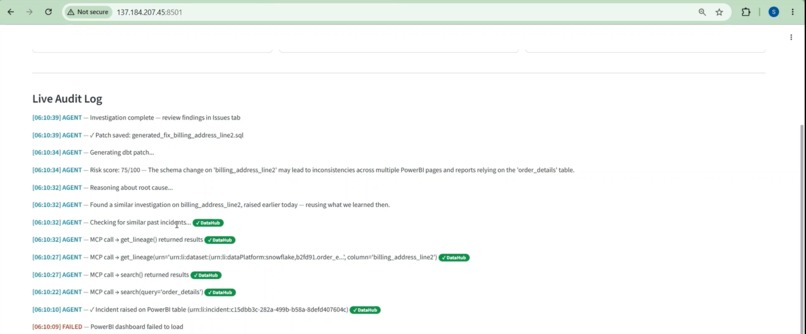
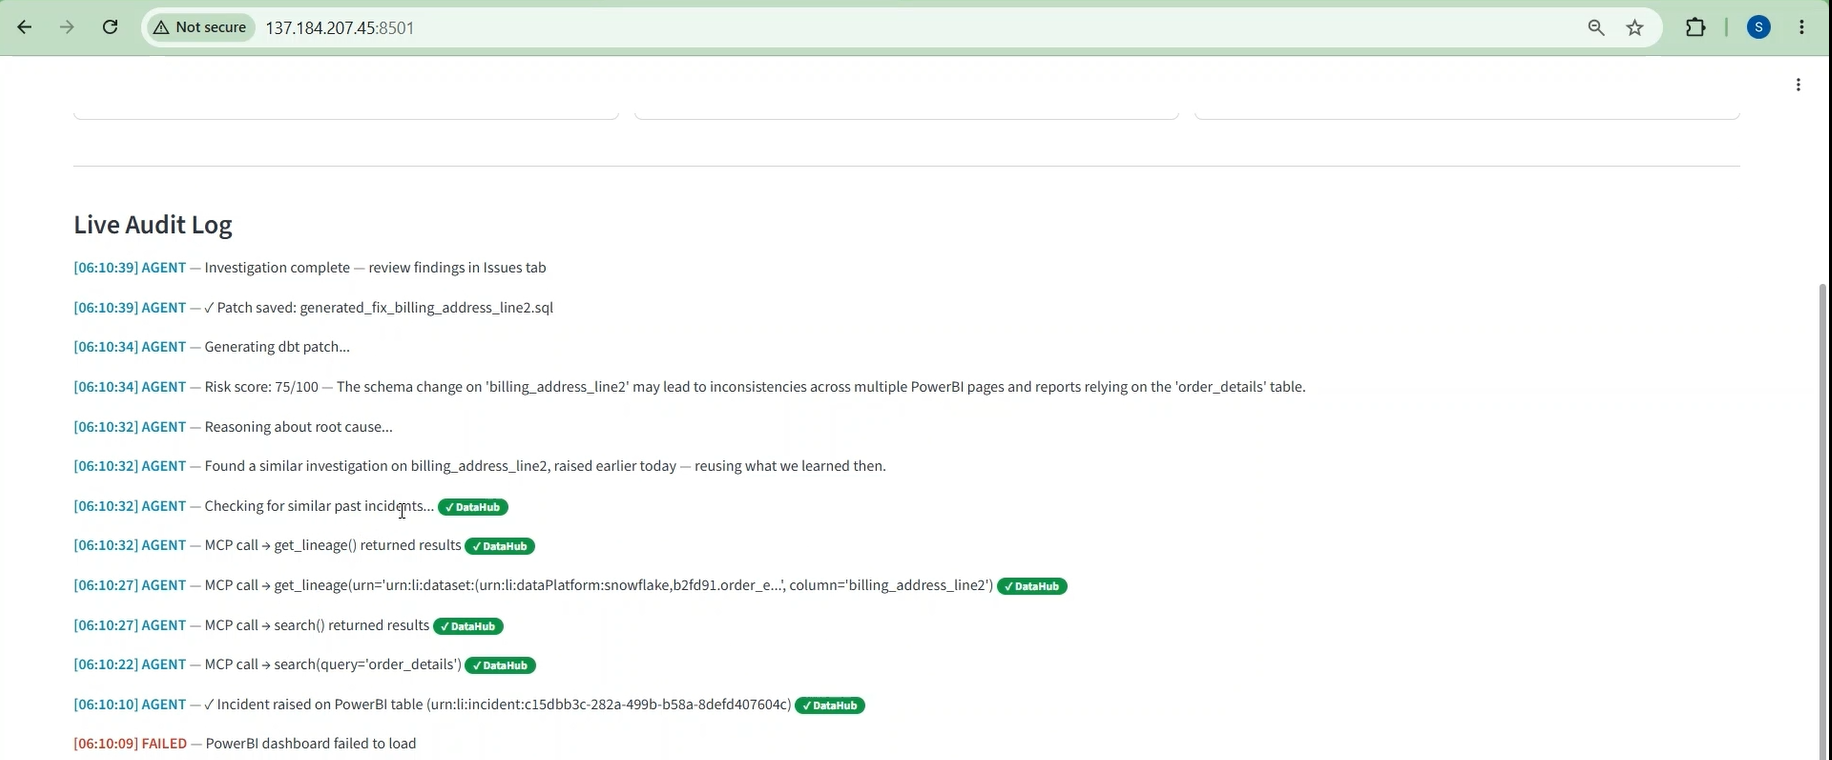
Agent Log highlighting Dathub mcp/api calls
-
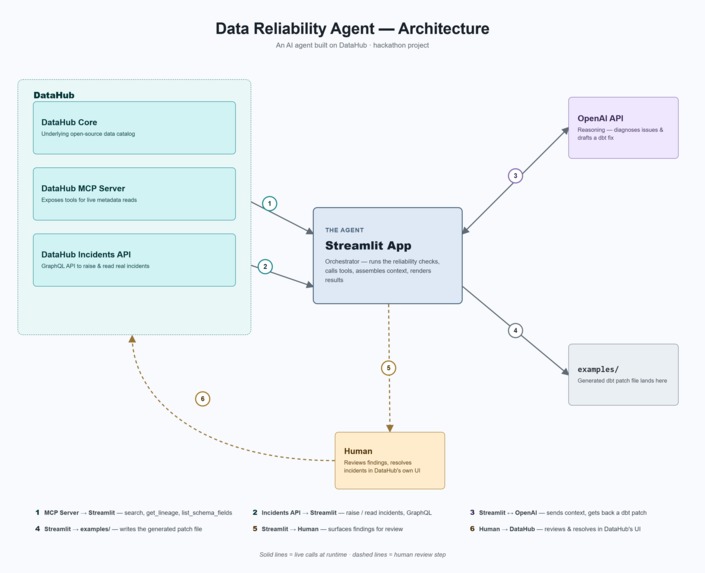
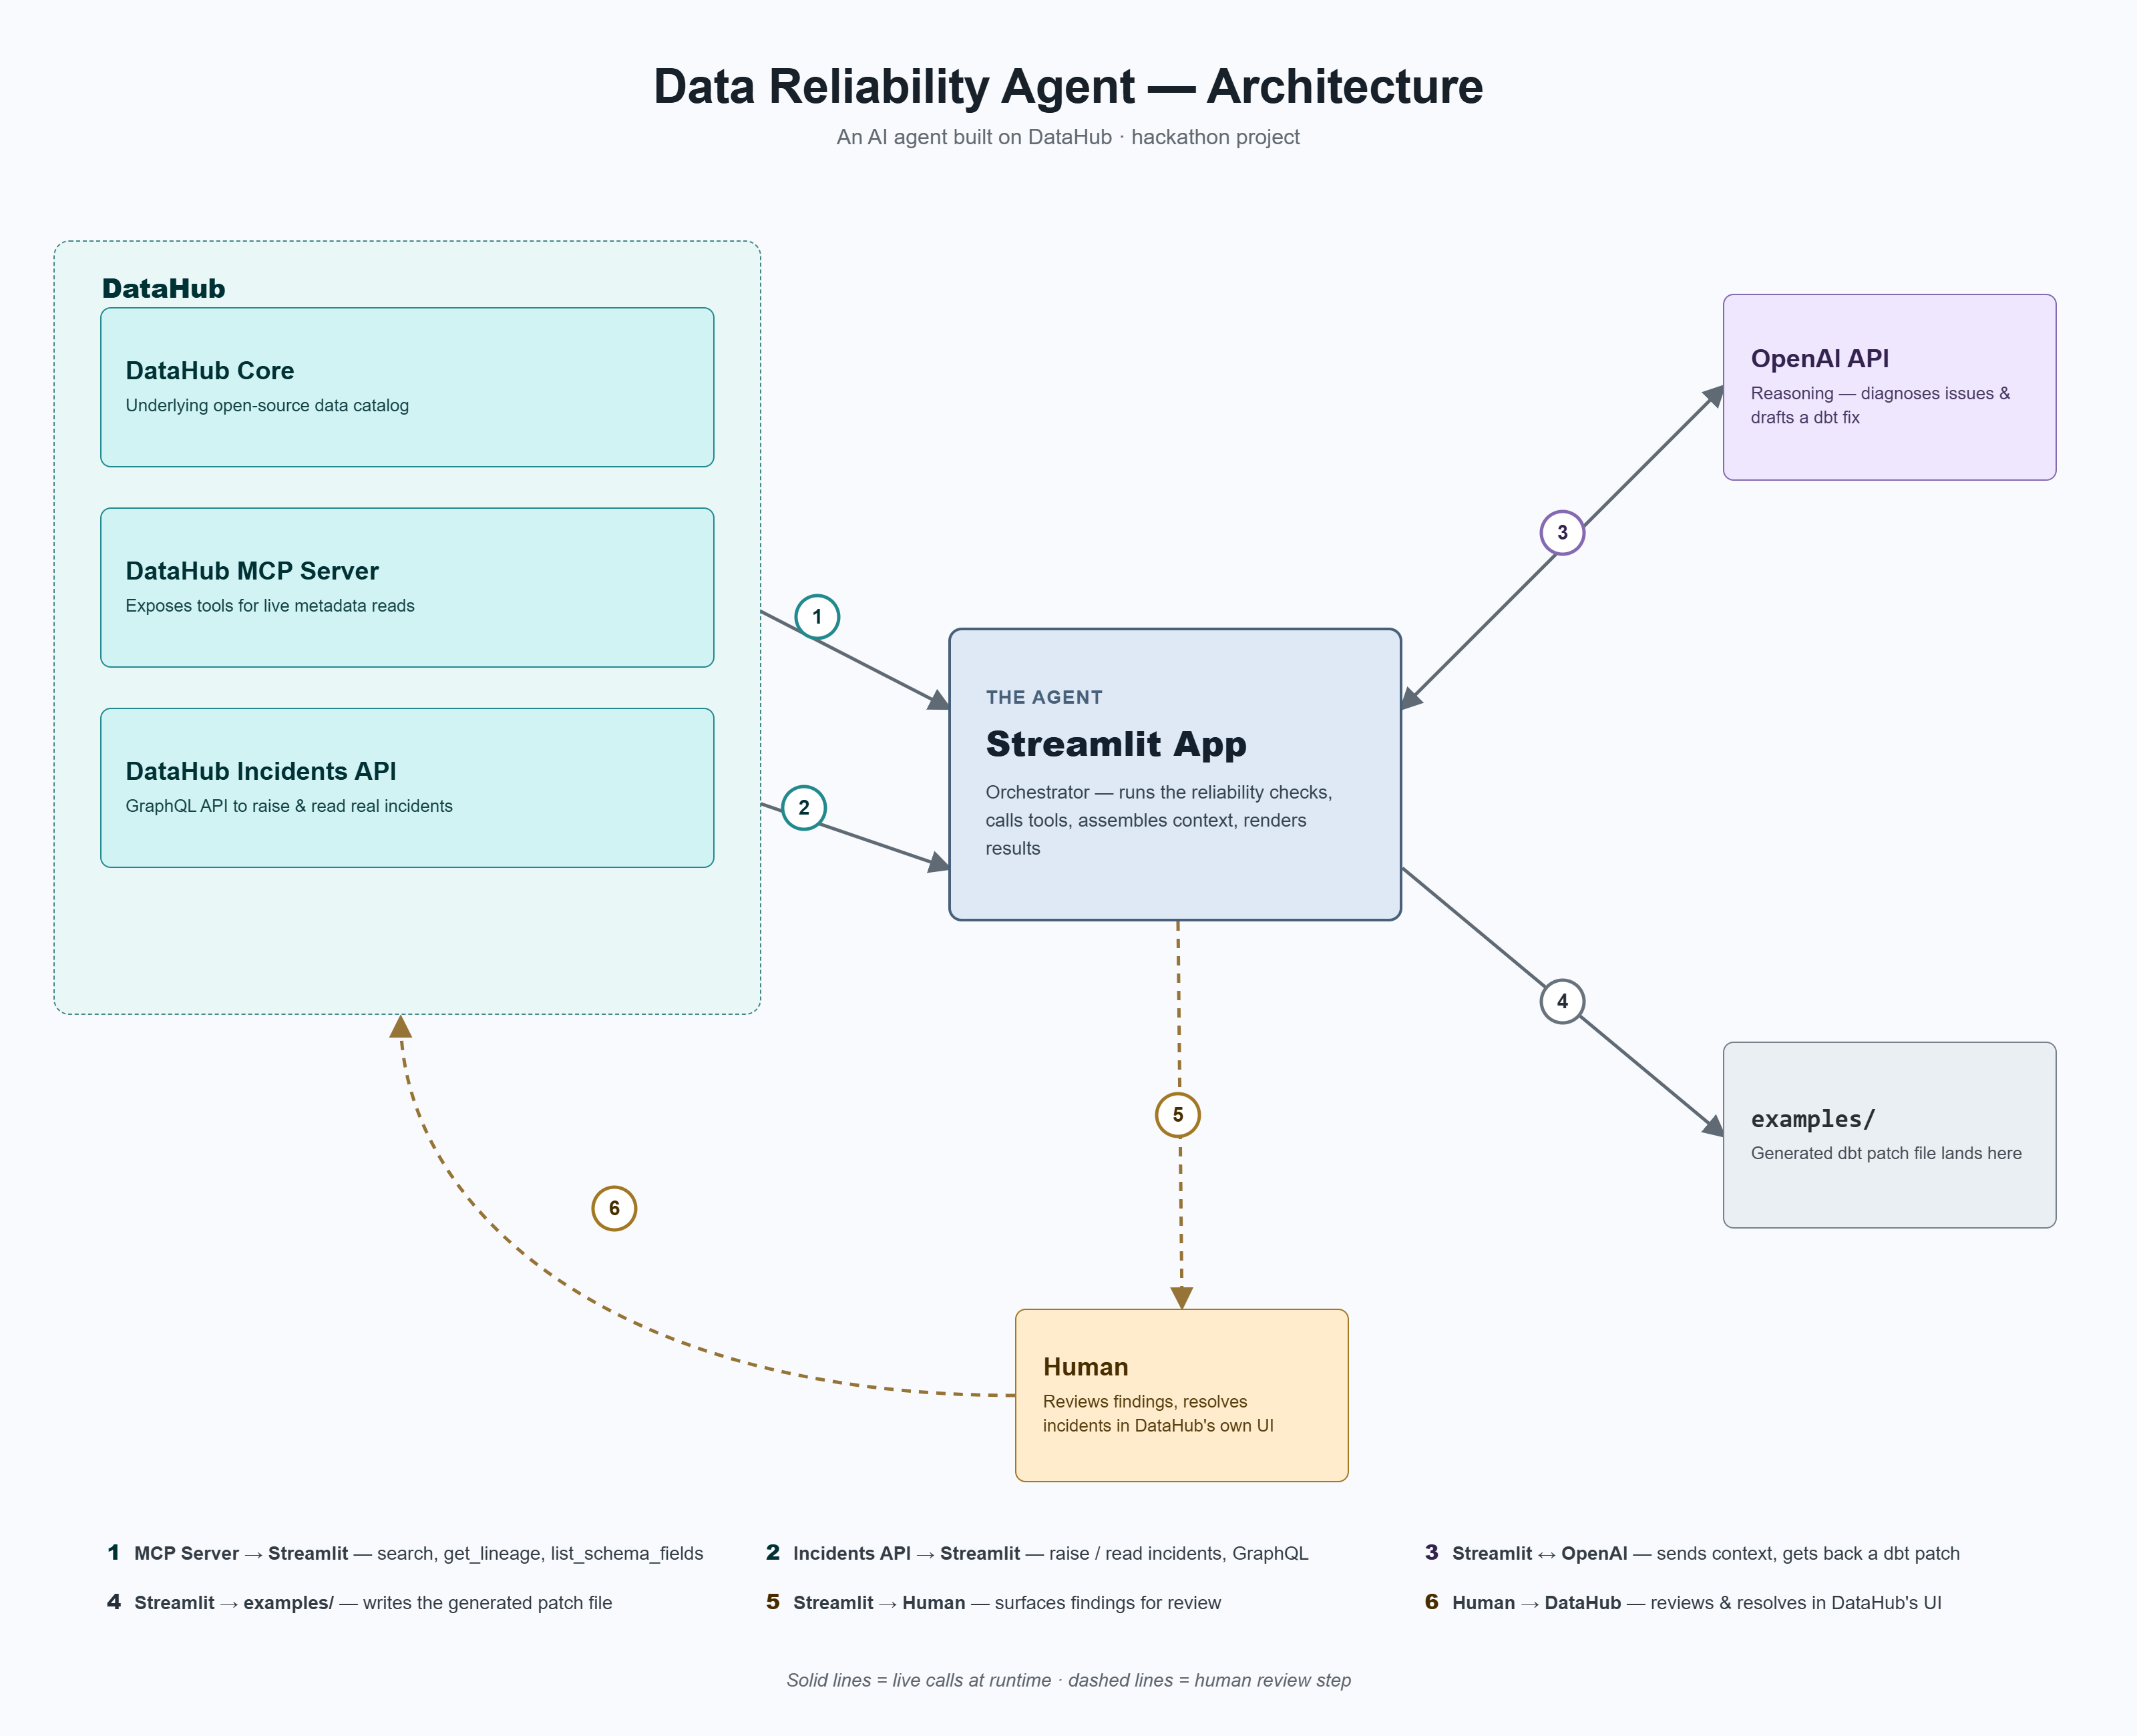
Architecture diagram
Inspiration
A common problem in data teams is that someone changes a column, deploys the change, and later a dashboard stops working. Finding the cause usually takes a lot of manual effort—checking lineage, old tickets, Slack messages, and dashboards. Even if someone fixes it, that knowledge is often lost and the same investigation gets repeated later.
I wanted to build an AI agent that could automatically investigate these issues, suggest a fix, and save what it learned back into DataHub so future incidents are easier to resolve.
What it does
The agent monitors a data pipeline using DataHub metadata.
When it detects a risky schema change, it warns before deployment. If a downstream dashboard fails, it investigates using DataHub's lineage, schema, and previous incidents. It identifies the likely root cause, generates a suggested dbt fix, and creates a real incident in DataHub with everything it learned.
A human still reviews the recommendation and decides how to resolve the issue.
Challenges I ran into
The biggest challenge wasn't building the AI—it was getting the environment running.
I first tried building everything on my Windows laptop, but Docker and WSL gave me several issues. After that I moved to GitHub Codespaces, but I ran into storage and memory limits because DataHub requires multiple containers. I eventually switched to a small DigitalOcean server, which gave me a stable environment.
I also spent time debugging DataHub itself. I ran into authentication issues with the GraphQL API, telemetry causing long delays, and OpenSearch indexing problems after reloading sample data. Solving those issues took much longer than I expected.
What I learned
This project taught me that building AI agents is only part of the work. Having a stable environment and understanding how the platform works is just as important.
I also learned how much useful information DataHub stores. It's not just a catalog of tables—it connects schema, lineage, ownership, incidents, and other metadata together. That made it possible for the agent to trace a schema change all the way to the affected dashboard and understand the impact.
Another lesson was to keep the demo honest. The failure is simulated so it can be reproduced every time, but the agent reads real metadata from DataHub and writes real incidents back into DataHub.
What's next
Some improvements I'd like to make are:
- Support monitoring multiple pipelines instead of one example pipeline.
- Generate different types of fixes instead of only dbt patches.
- Improve the memory feature using semantic similarity instead of simple matching.
- Add notifications through Slack or Microsoft Teams.
- Support automatic risk scoring based on downstream business impact.

Log in or sign up for Devpost to join the conversation.