-
-
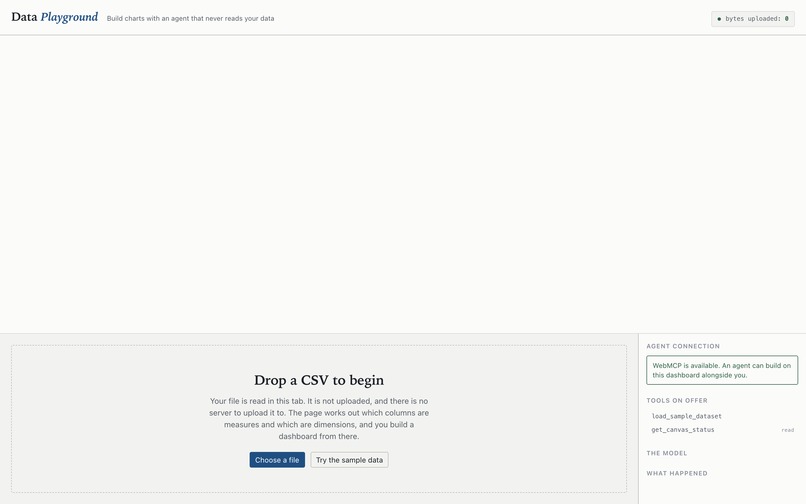
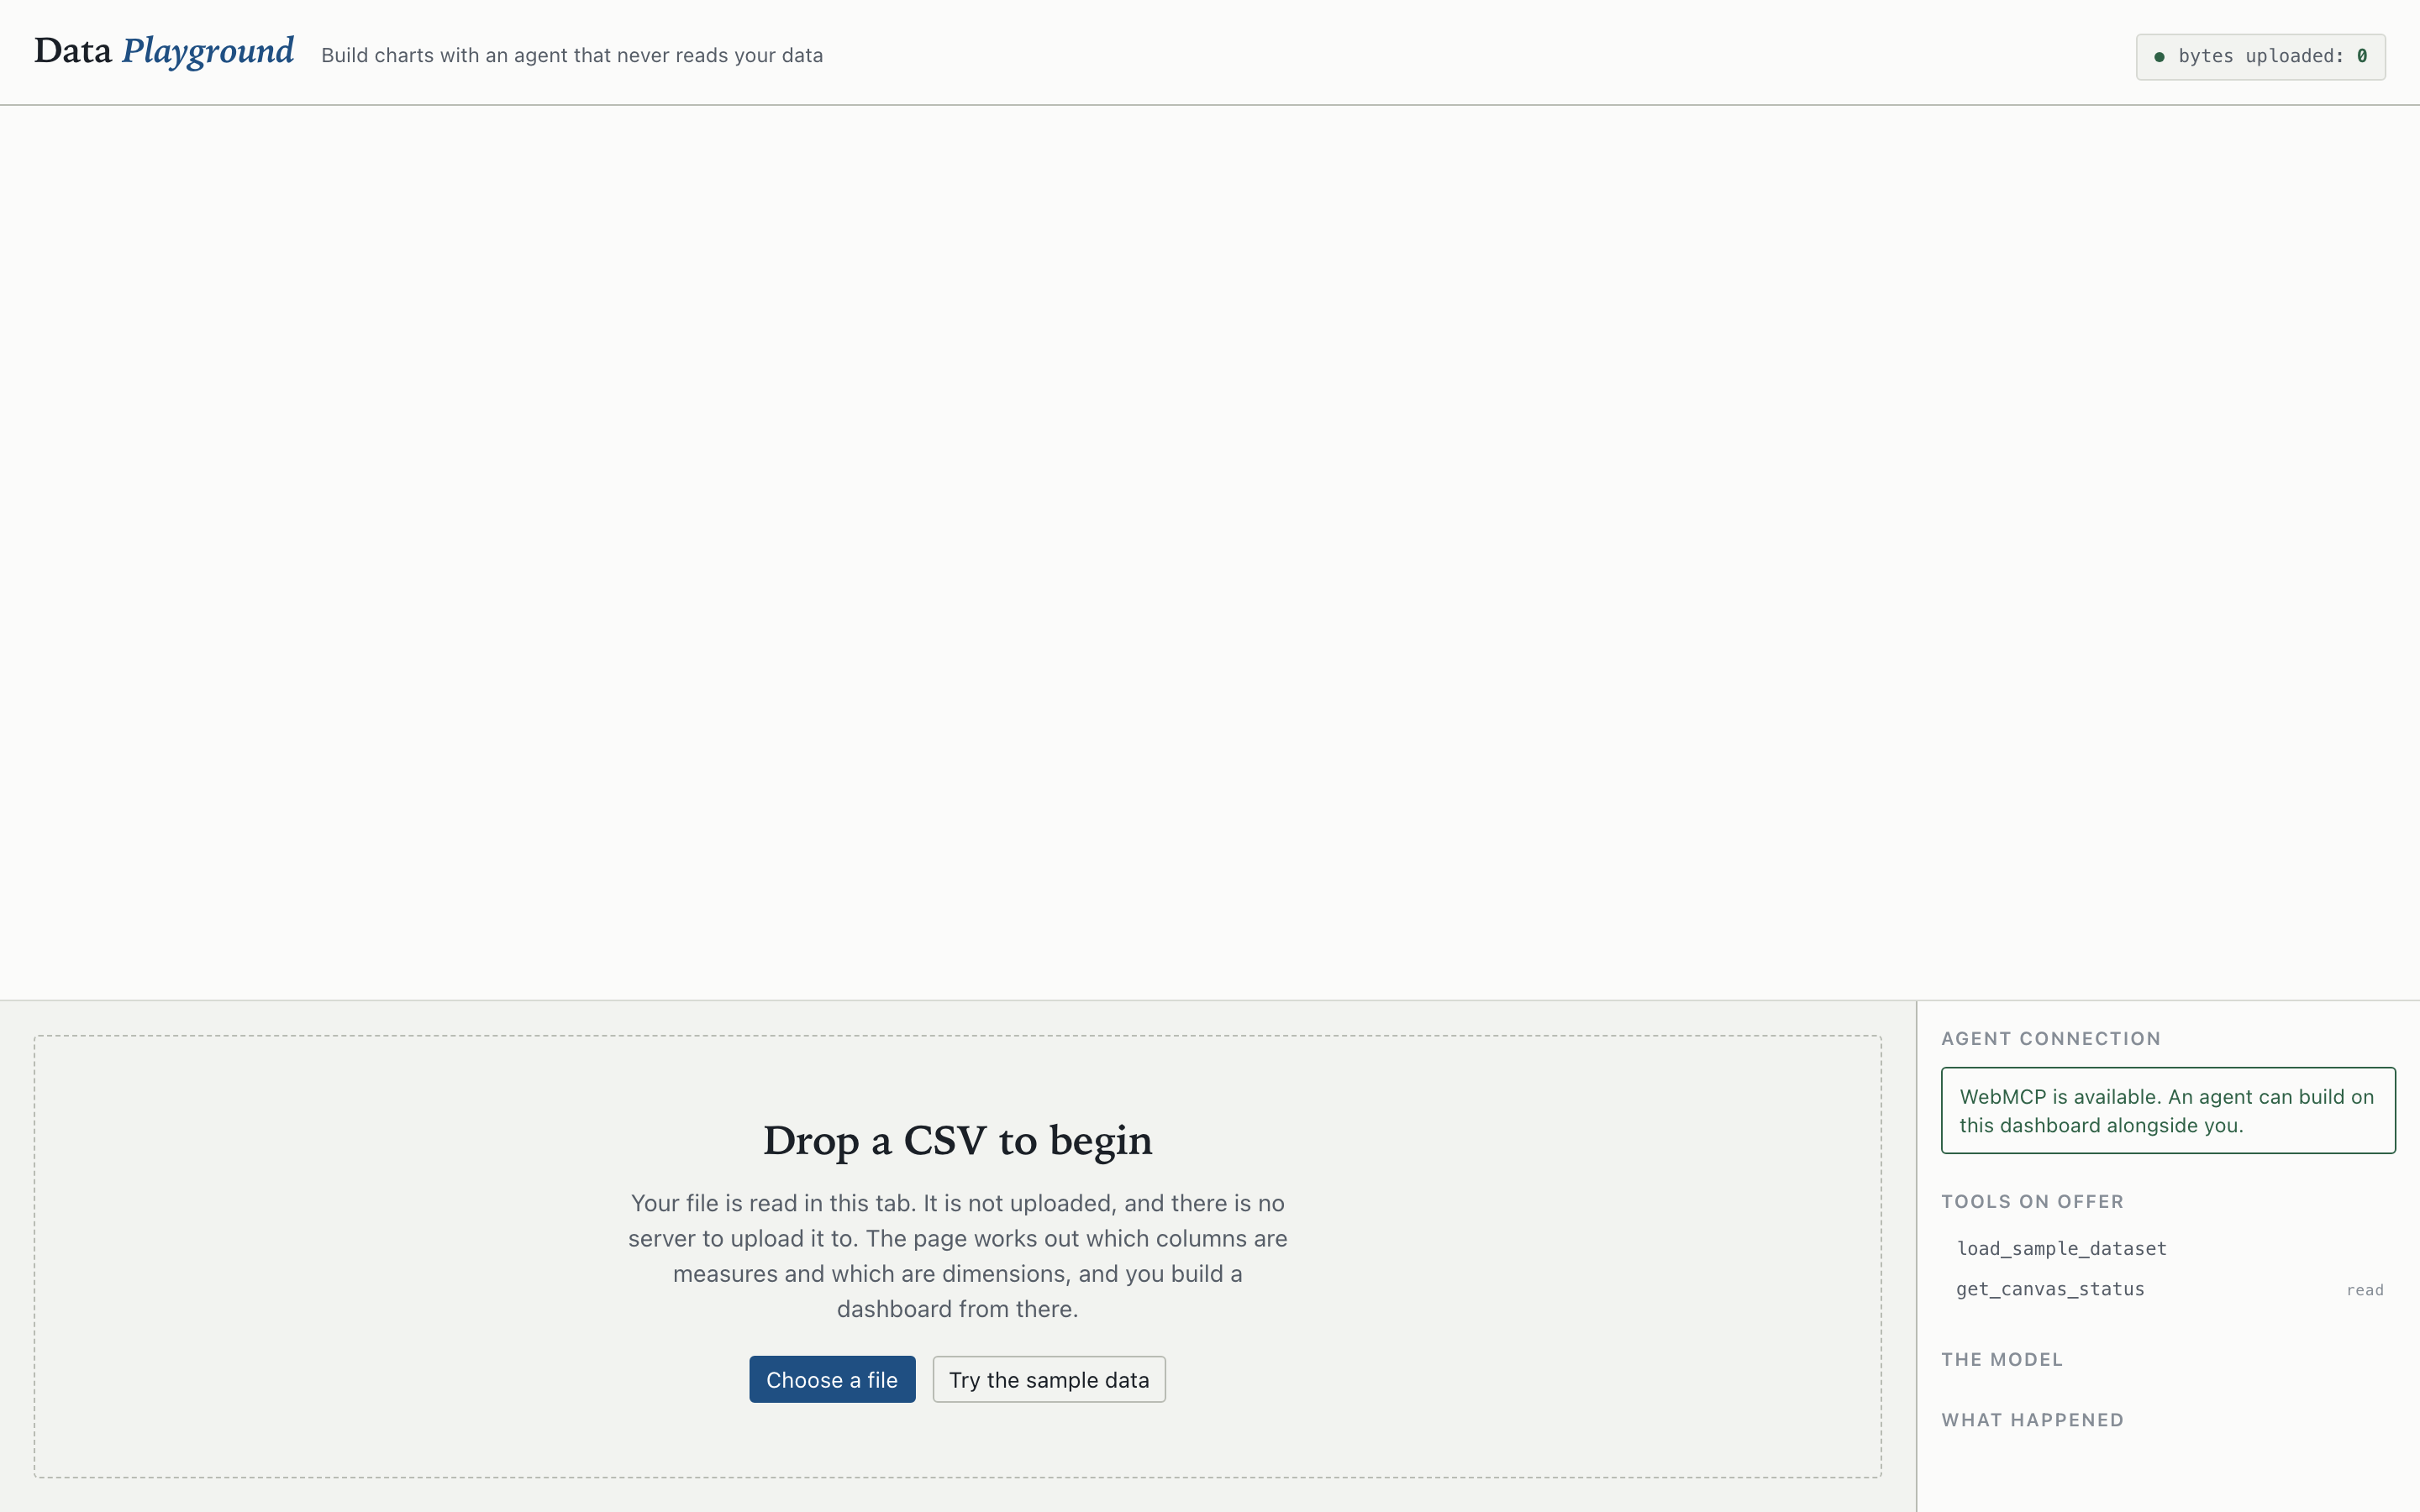
empty playground
-
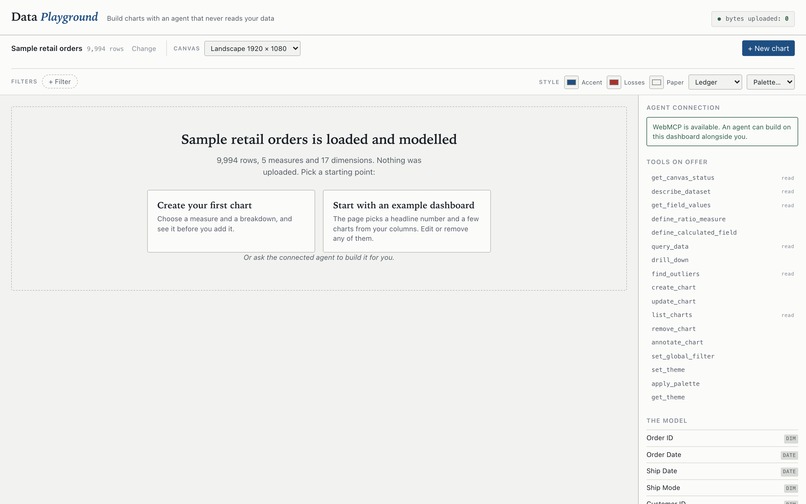
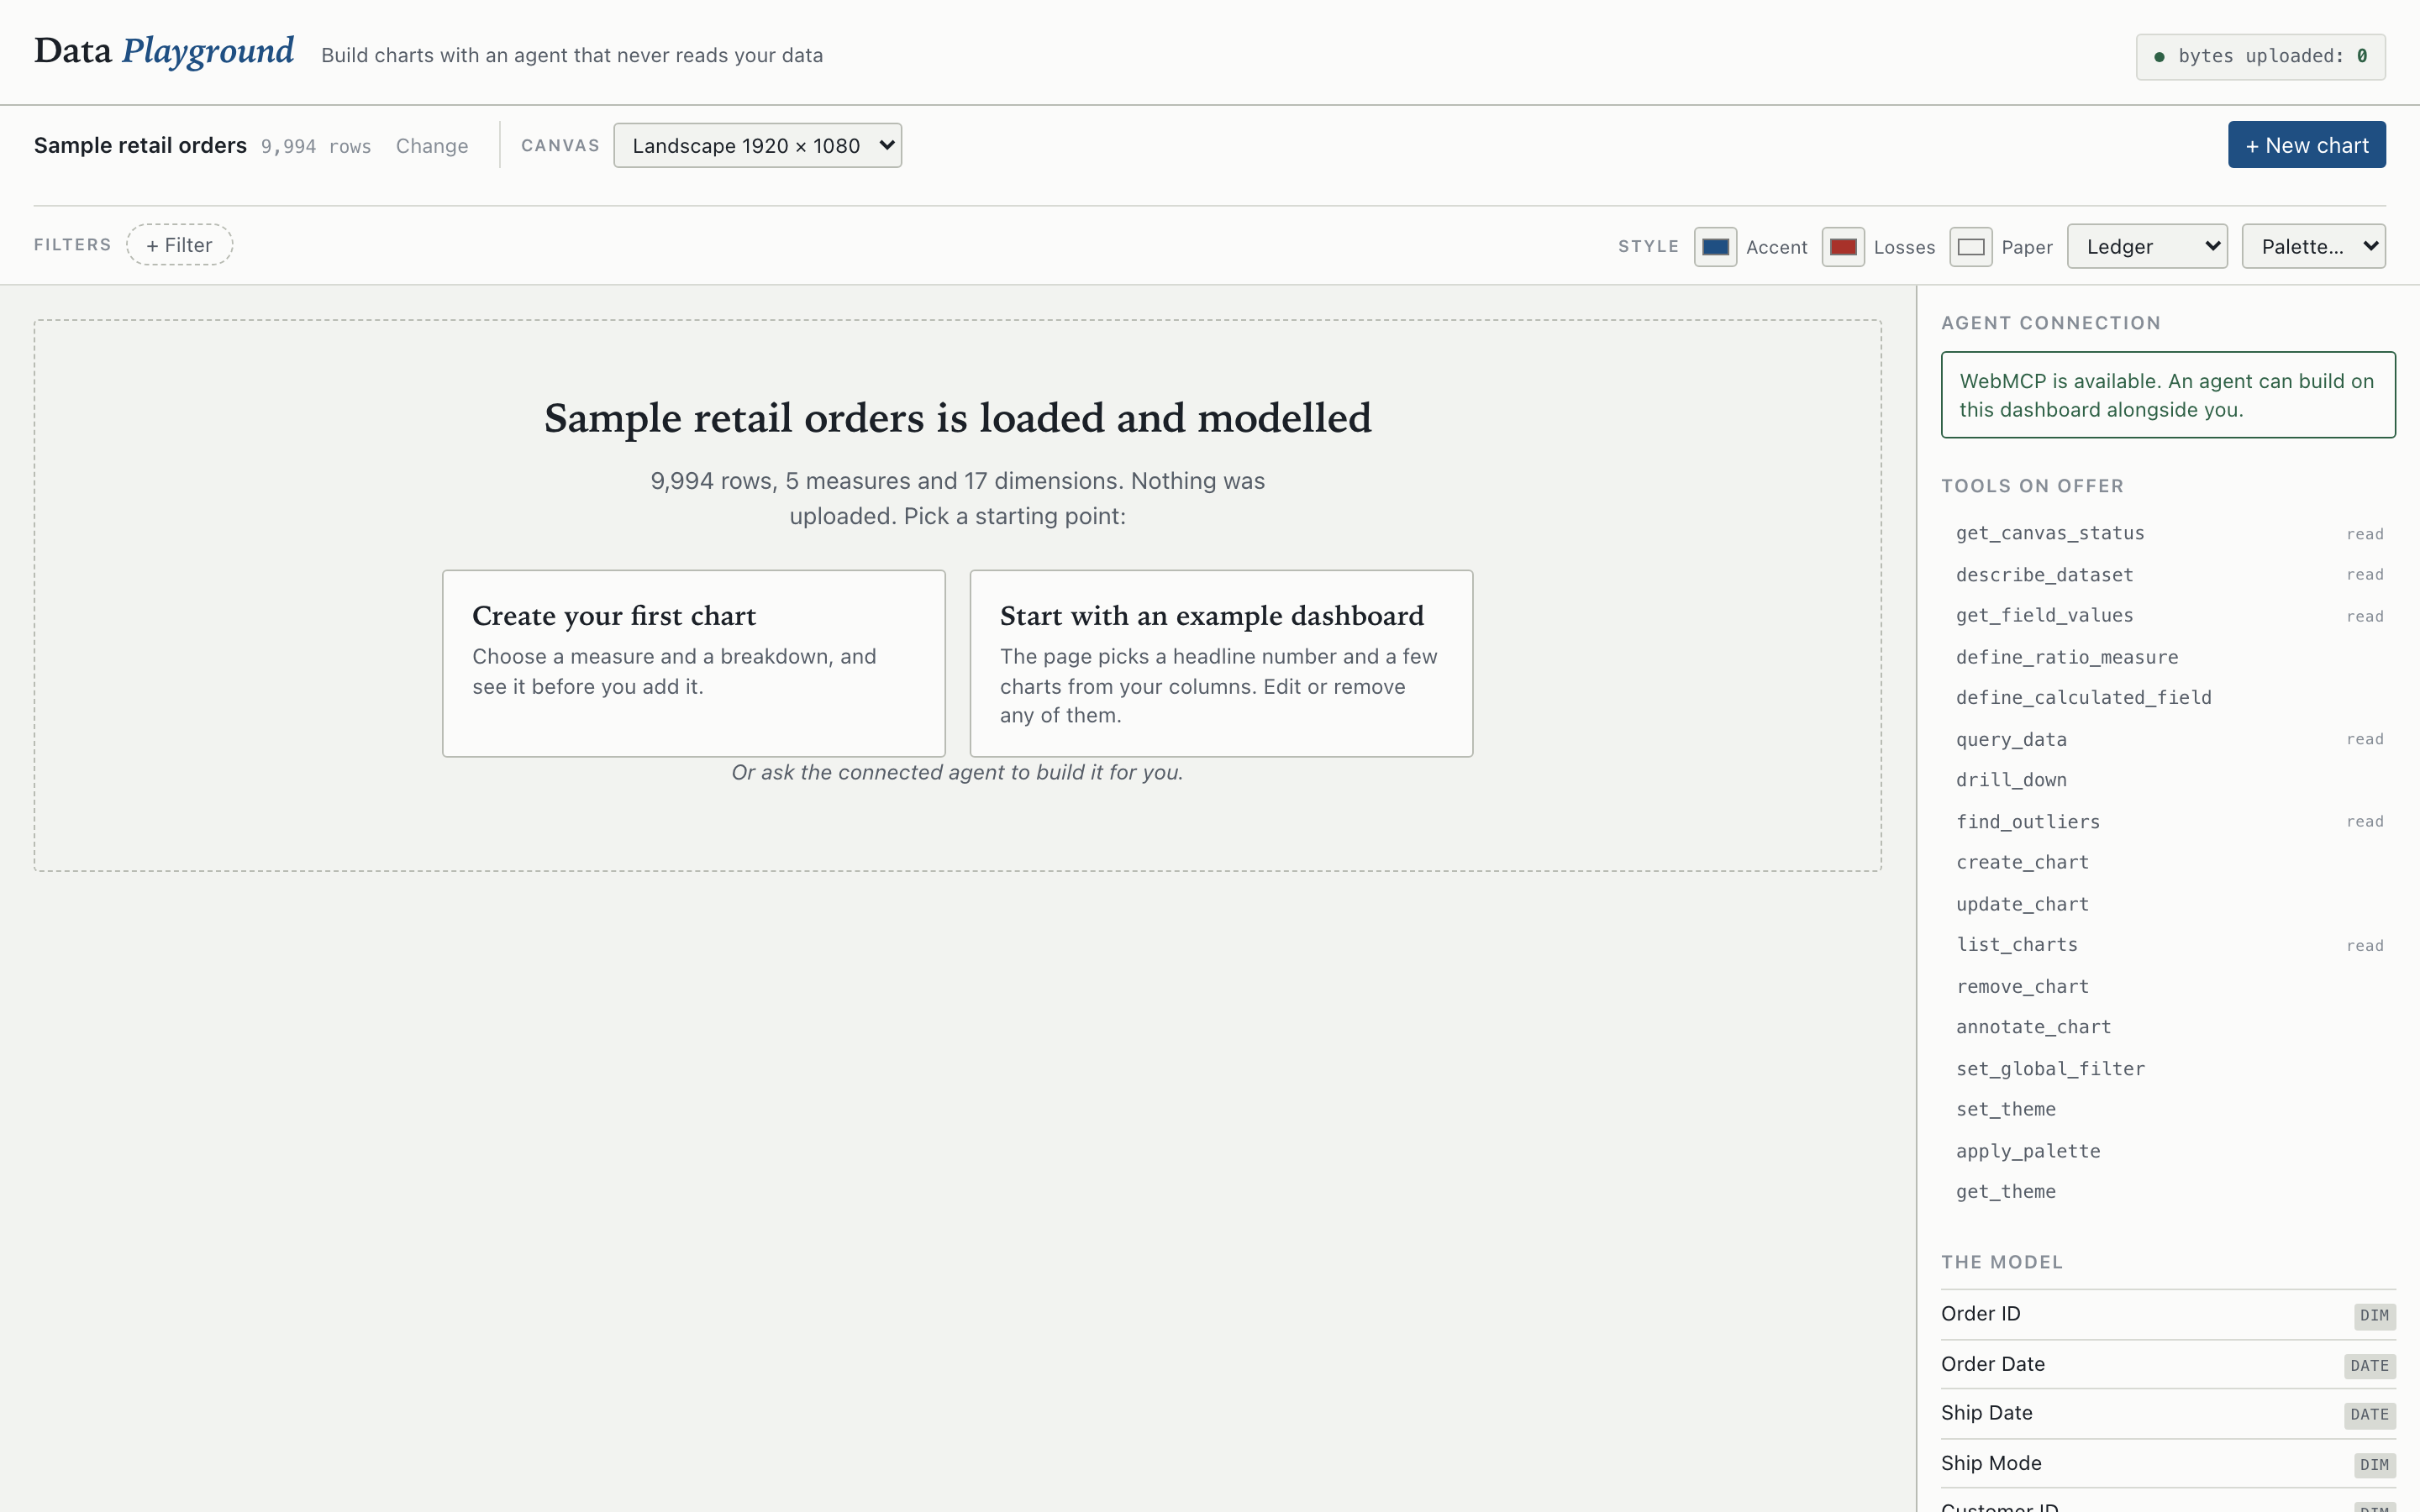
loaded seventeen tools
-
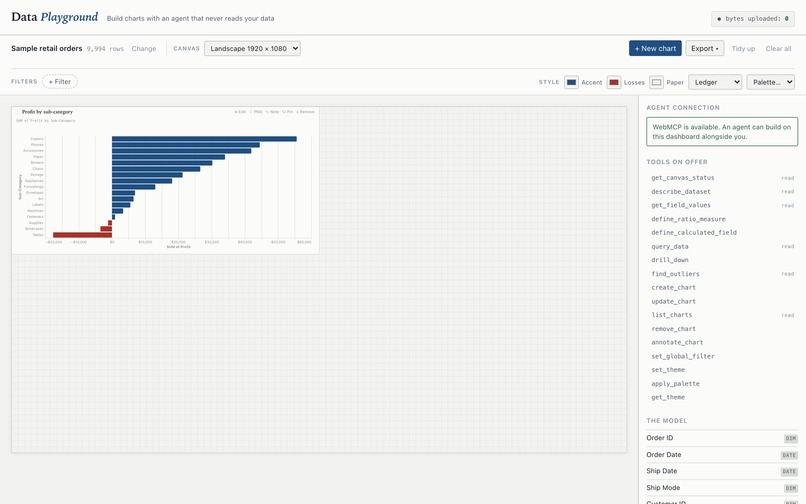
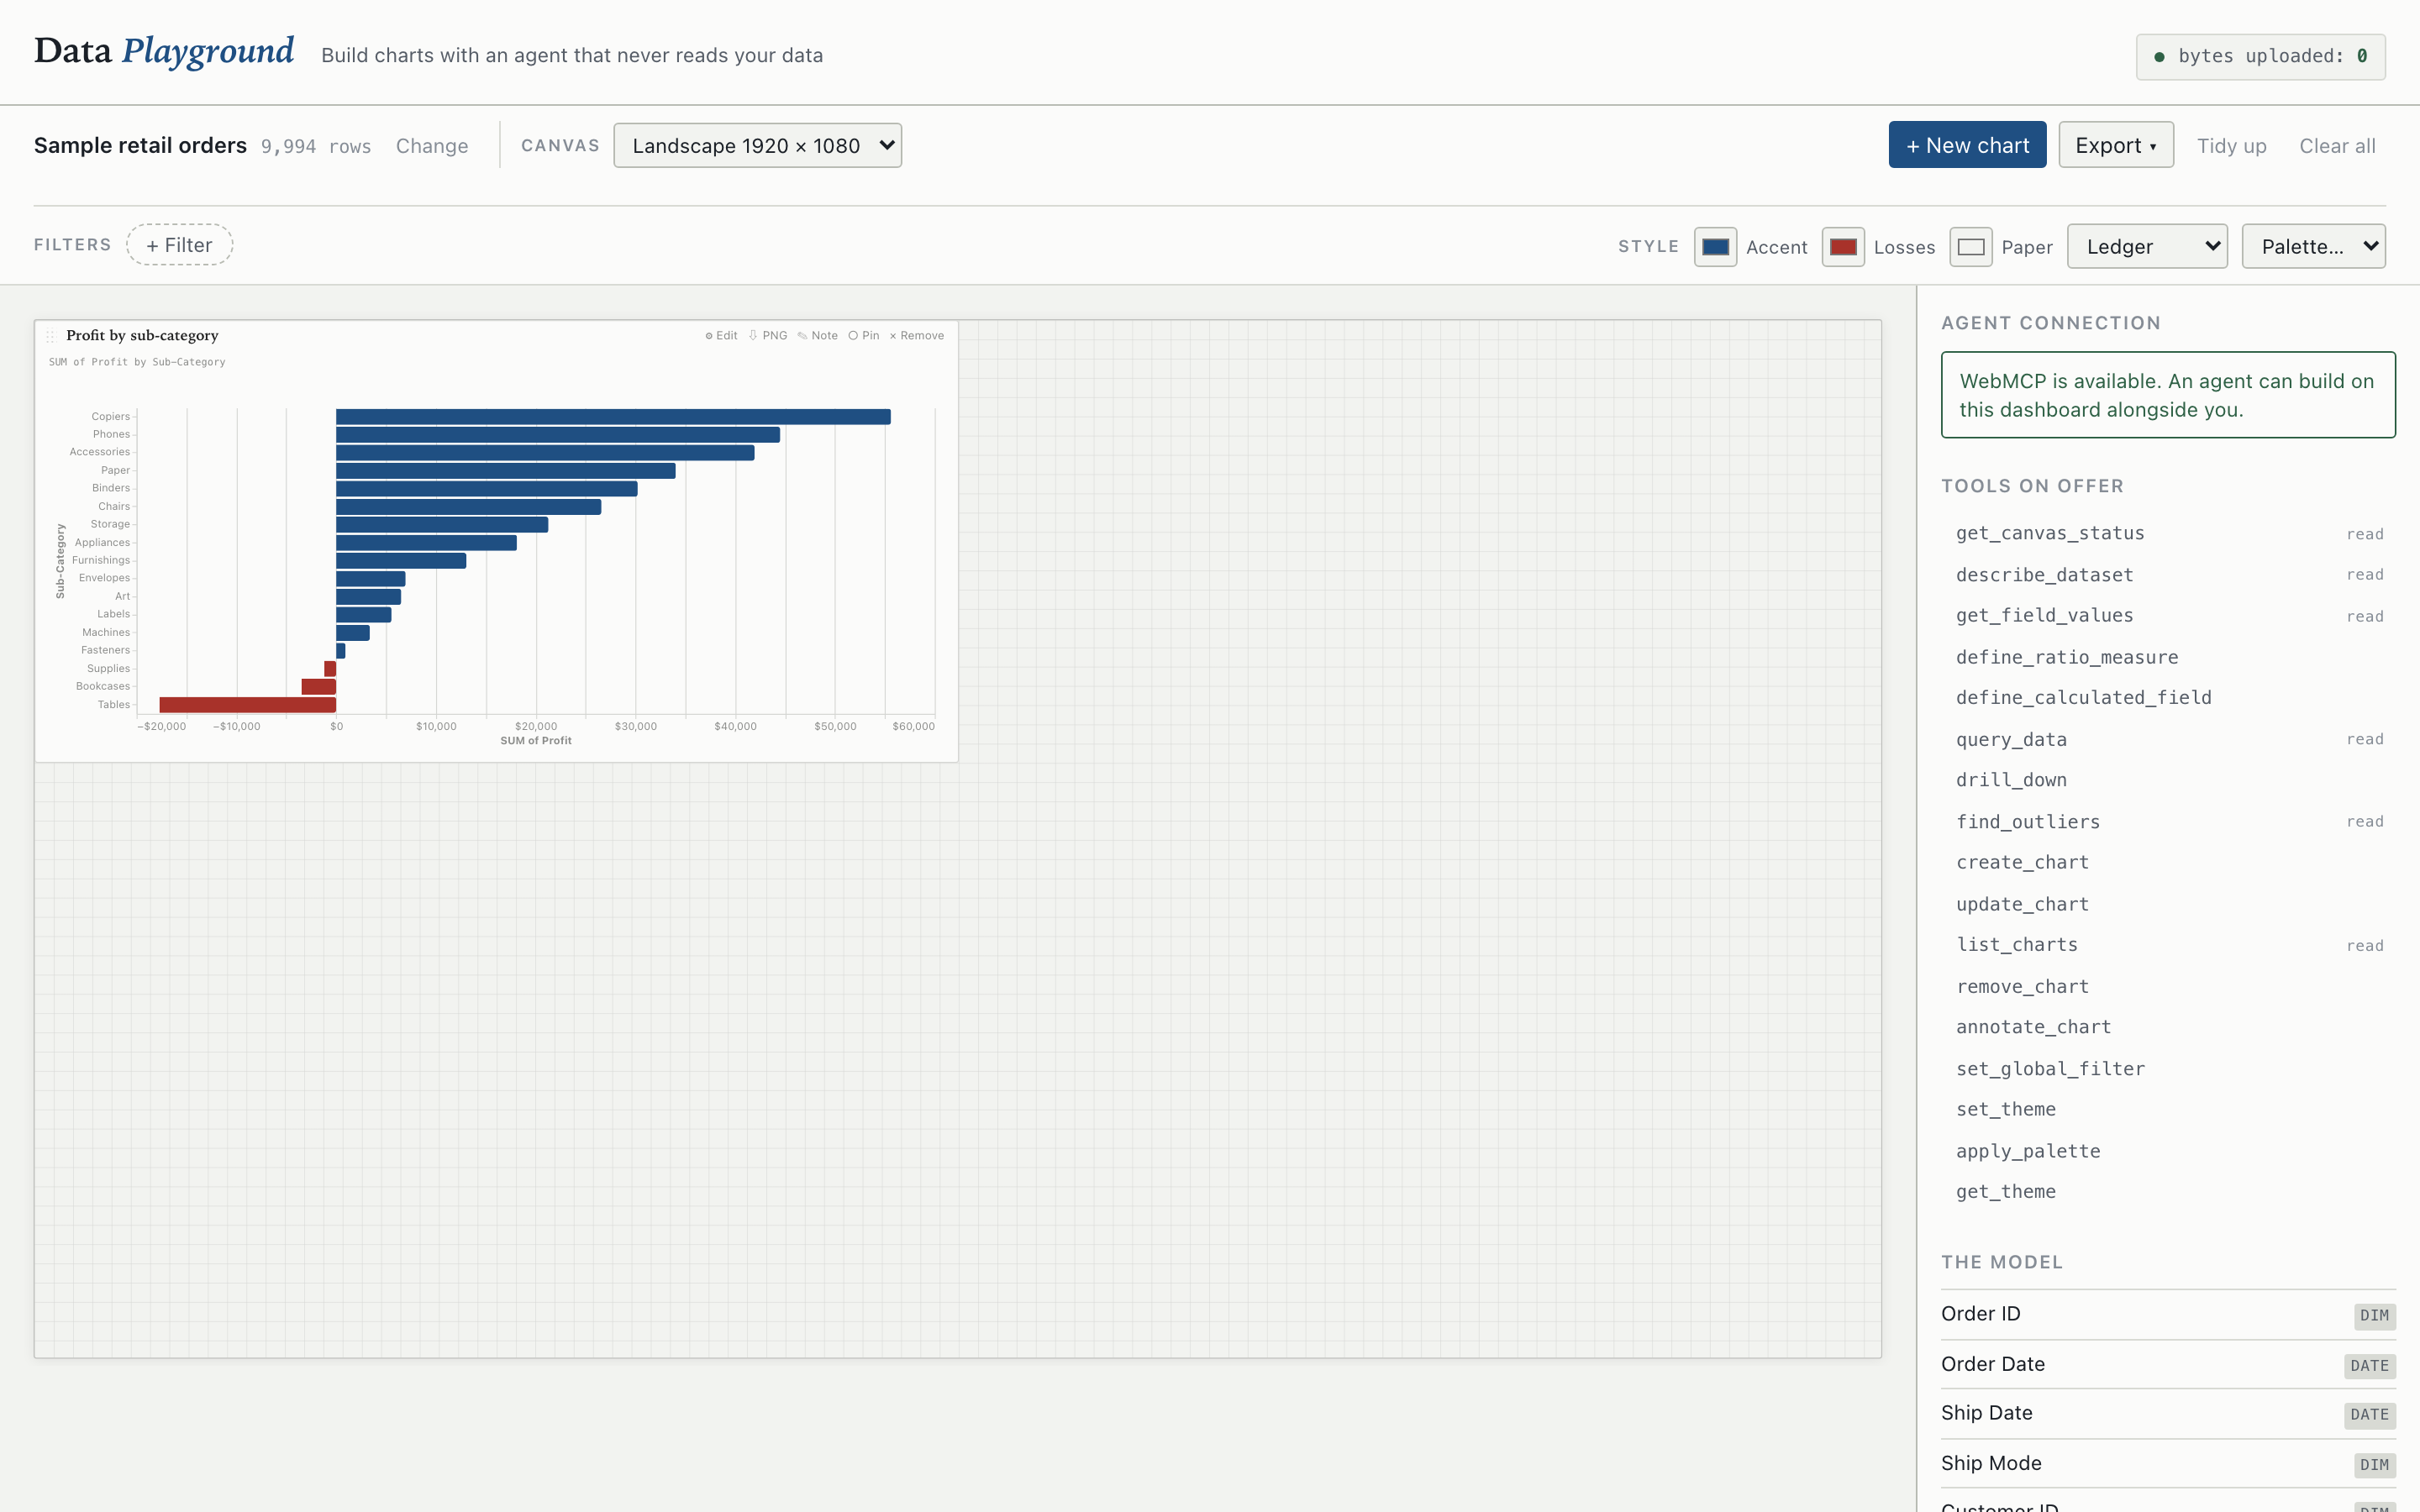
agent drew a chart
-
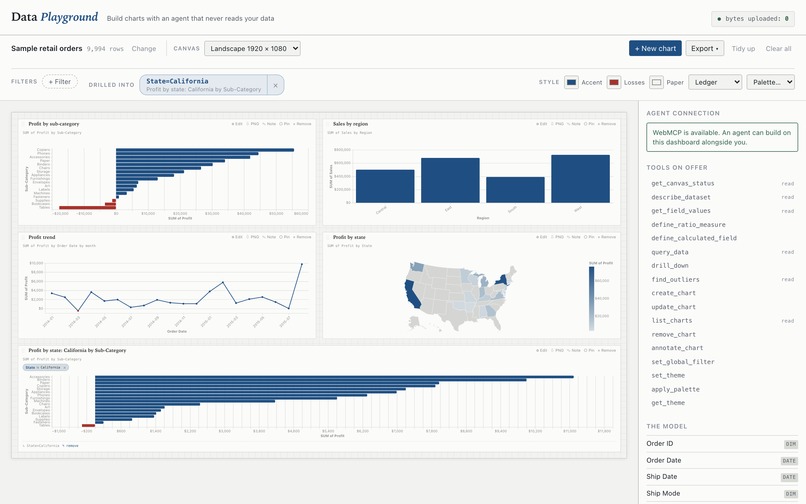
drilled into california
-
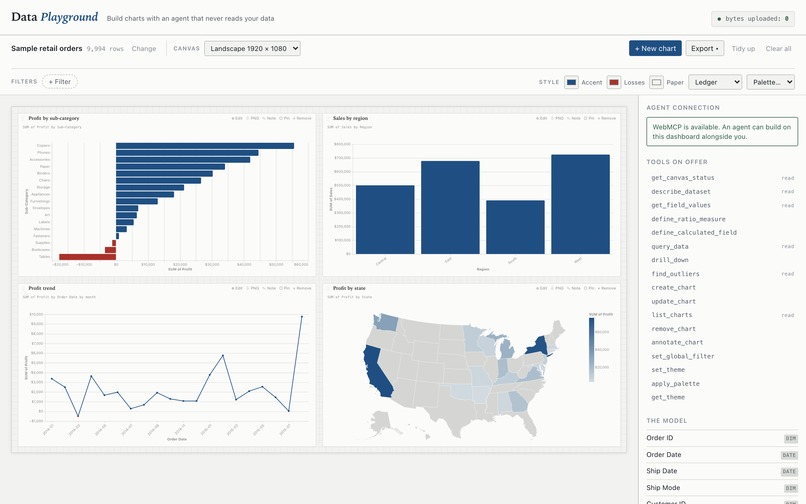
dashboard with map
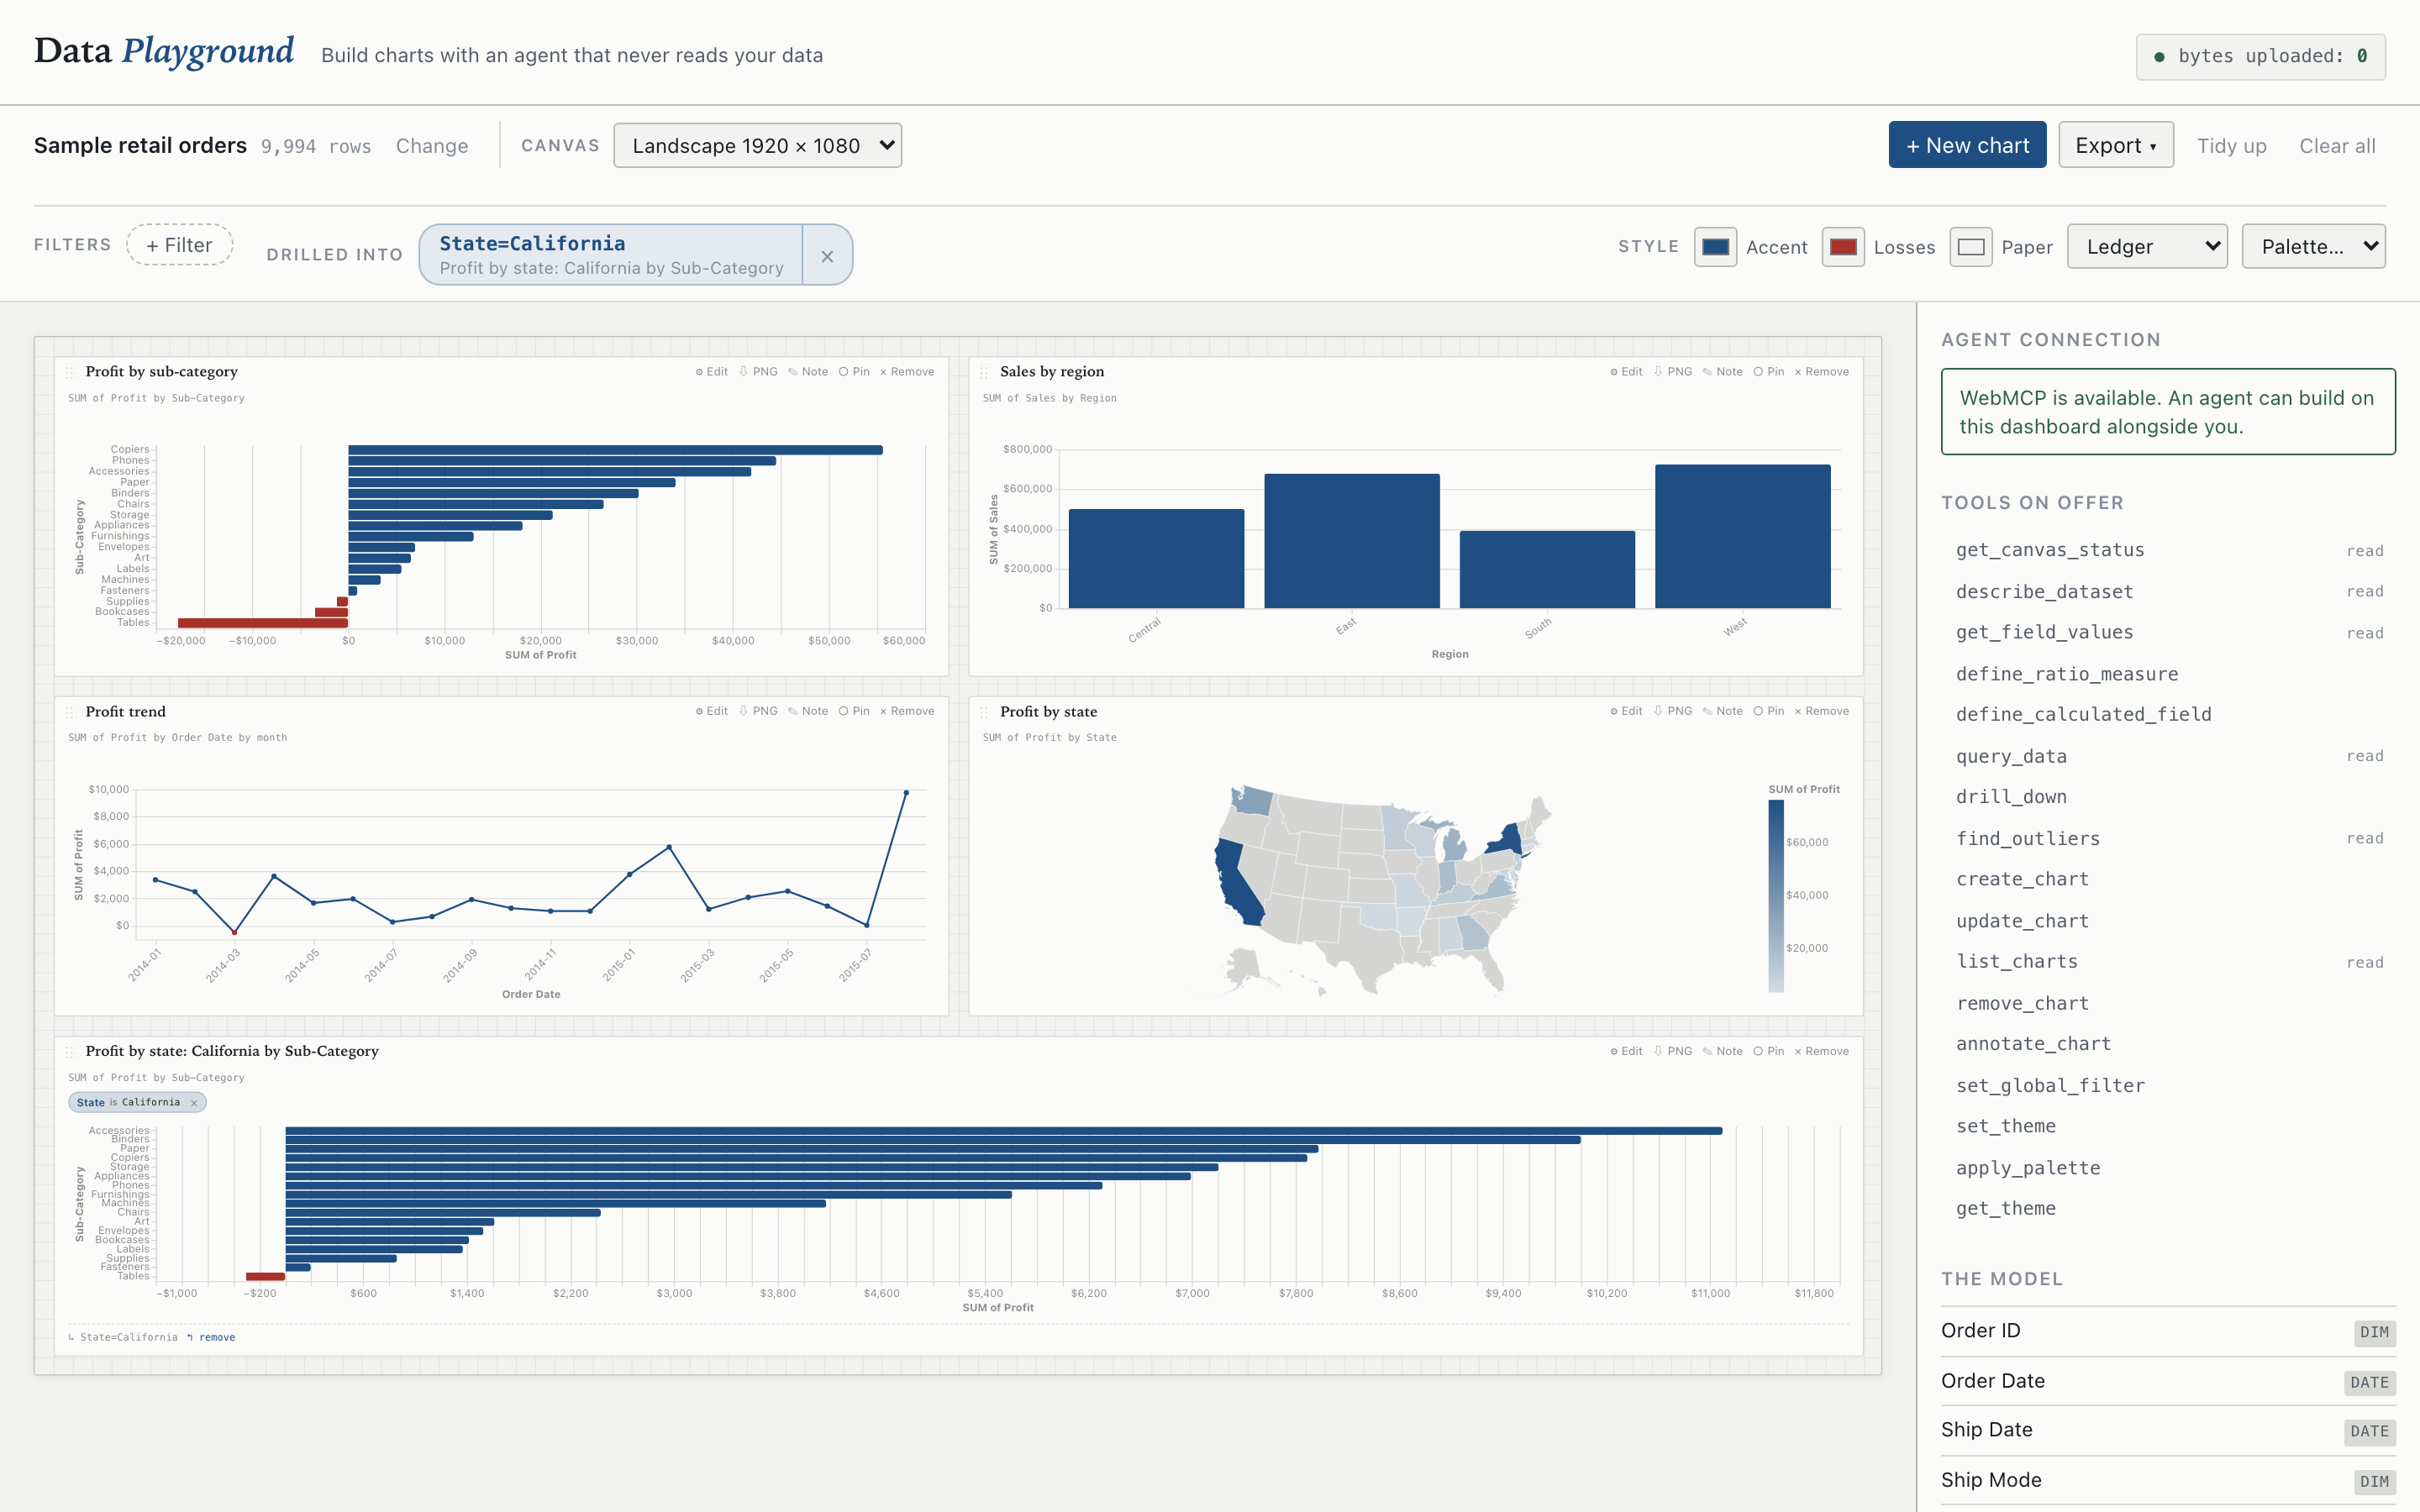
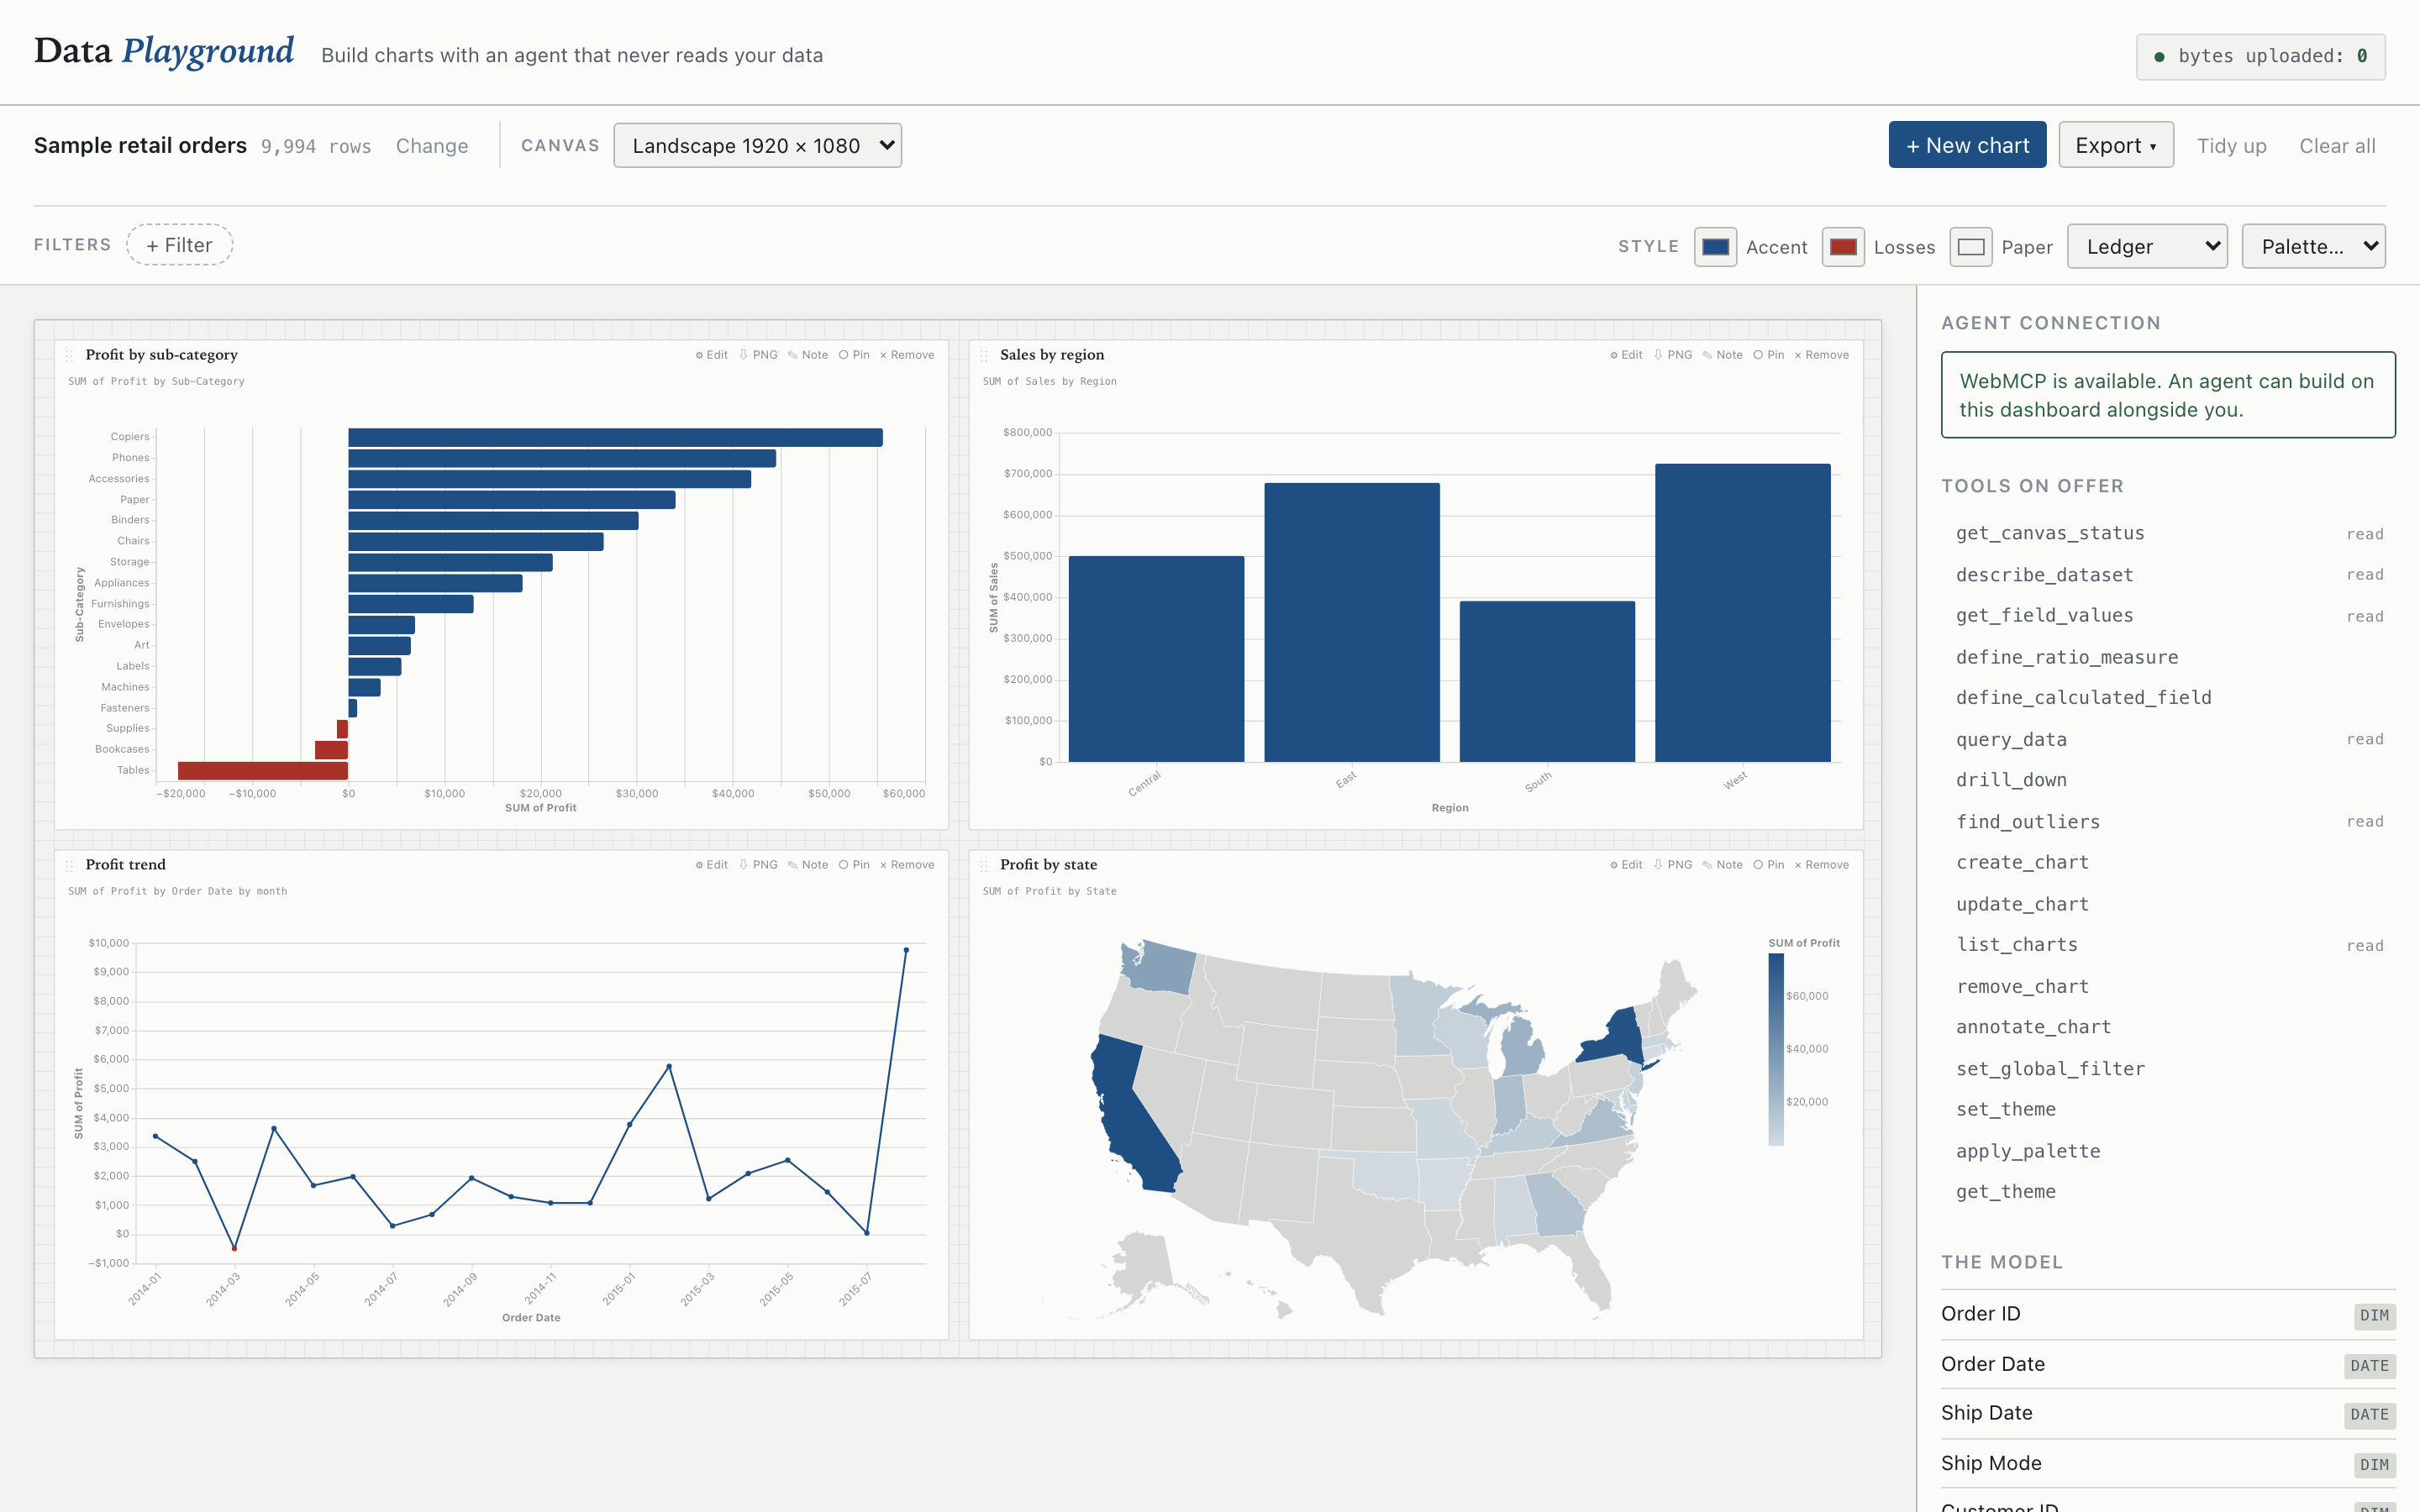
The inspiration definitely came from Tableau!
I wanted to create something more user-friendly for quickly making graphs without having to struggle with such a large software, or even Excel.
What it does
Drop a CSV and the page builds a semantic model of it: which columns are measures, which are dimensions...The agent gets that model. It never gets the rows.
Then manually build your charts, or ask for specific things to the agent.
How we built it
No framework, no build step, no server. Plain ES modules, Vega-Lite for rendering, and a CSV parser.
Challenges we ran into
Keeping the agent honest was harder than expected.
Accomplishments that we're proud of
The page knows more about the data than the agent does, and says so. That inversion is only available when the tools run inside the page that holds the data.
What we learned
Well, webMCP! :)
What's next for Data Playground
More types of charts, better canvas sizes, maybe an infinite one, geography beyond US states...
Built With
- css3
- d3.js
- html5
- javascript
- netlify
- topojson
- vega
- vega-lite
- webmcp

Log in or sign up for Devpost to join the conversation.