-
-

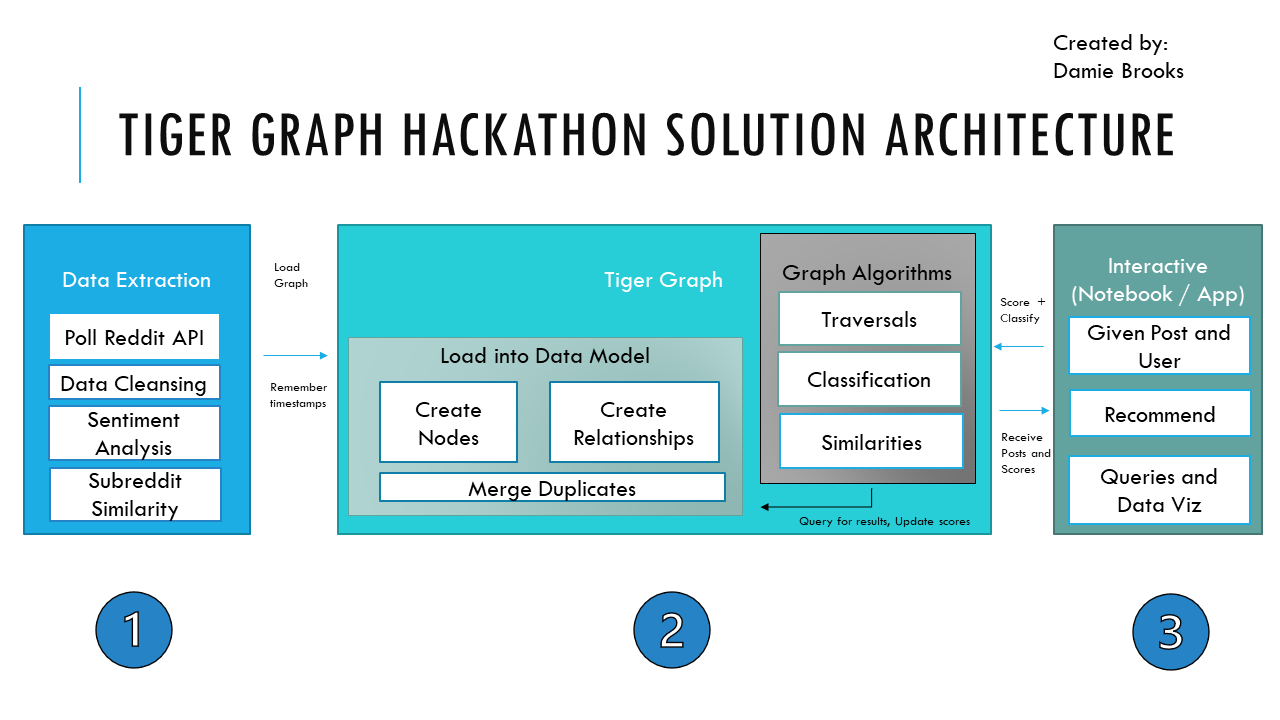
Solution Architecture for Project
Inspiration
"What does it mean to 'think'?" - was my final philosophy research project in college, both from the human and computer perspective. Critical thinking is essential to a peaceful society in a world where media tends to only show one viewpoint, what they want you to believe. Transforming user generated content into a graph structure opens up exciting opportunities that can be enhanced with Natural Language Processing.
What it does
My graph project extracts Reddit in regular intervals, manages duplicates, embeds in sentiment and similarity, then publishes it to a Tiger Graph solution to be queried, visualized, and analyzed. The end project offers alternative post suggestions based on a given post. A graphistry visualization is added for further exploration.
How I built it
Because I knew the timeline was aggressive, I began with a project plan. Everything I built in this project was new to me, so the learning curve had to be factored in and time-boxed. I knew I wanted my "end-solution-interactive-project" to load quickly without performance issues, so I moved analysis and text processing work upstream. 20% of my project time was spent writing the Python data extraction pipeline. A good chunk of time was spent learning and iterating on an effective data model to map into Tiger Graph. Because GSQL was new, my aim was to simplify the queries into multi-hop traversals. My final solution is built with Streamlit, which publishes a UI from Python code, and though I have a lot of web development experience, I had never used Streamlit.
Challenges I ran into
- TigerGraph translating my understanding of graph queries to GSQL syntax was non-trivial. Once I got the hang of the syntax for the traversals and learned accumulators, things got easier.
- I had issues with loading in large Reddit extraction CSV files. Though I wanted to put in a much larger set of posts, I had to pare it down to get the solution to load the file in without freezing. My solution crashed 6 times without recovery before I got a sample size that would work without problems.
- Python doesn't behave like Javascript, selectors for CSS are not the same when using Streamlit vs a straight HTML web-app.
Accomplishments that I'm proud of
I enjoyed learning how to work with GSQL. The Graph Studio, Jupyter, and Graphisty were really fun to learn. I also am proud of the sentiment analysis embedded in to the data and the data model I came up with.
What I learned
I learned a lot about the social nature of the Reddit community. I spent time consdering how people think and what types of suggestions would be helpful to foster critical thinking without just angering someone or turning them off. I'm much more comfortable now with the Tiger Graph Graph Studio as well as GSQL. I'm especially thankful for the great resources Tiger Graph provides such as the Data Model workshop and the Graph Gurus Graph Data Science videos.
What's next for Data Mining Perspectives
Though I wanted to do more word vectorization to analyze similarity at the post body level, it was hard to do since many posts don't have bodies but instead use images or videos. If I had more time I would love to do more visualizations beyond bar graphs and also learn Graphistry more so I can see how to uncover insights from the graph itself. If I had more time, I would dive deeper into more complex graph data science to identify Reddit influencers and other patterns within the community.
Built With
- css
- graphistry
- gsql
- html
- jupyter
- python
- streamlit
- tigergraph


Log in or sign up for Devpost to join the conversation.