-
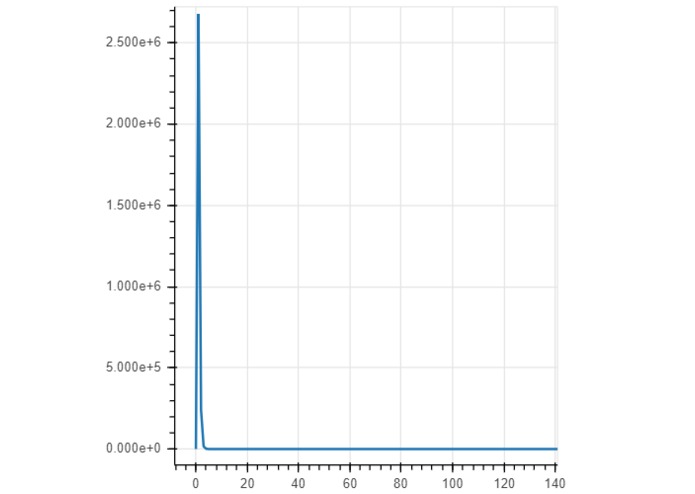
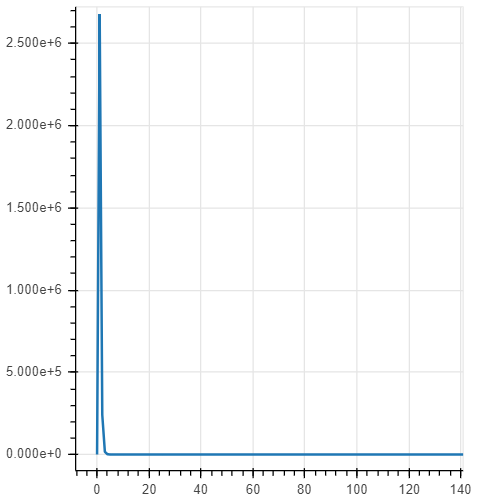
x-axis: number of people, y-axis: number of people on a particular route
-
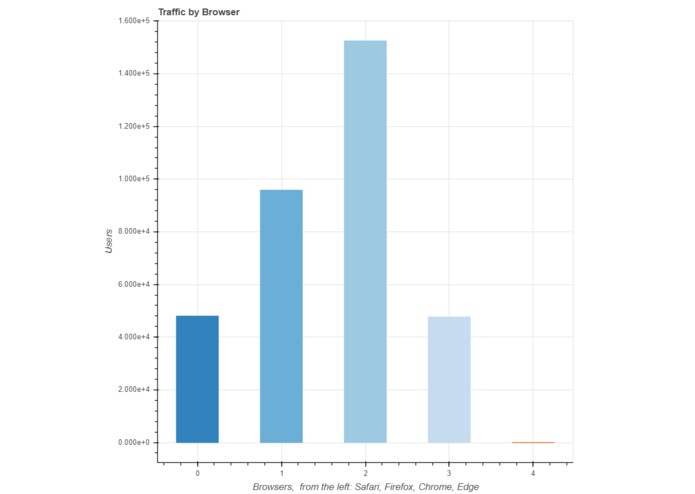
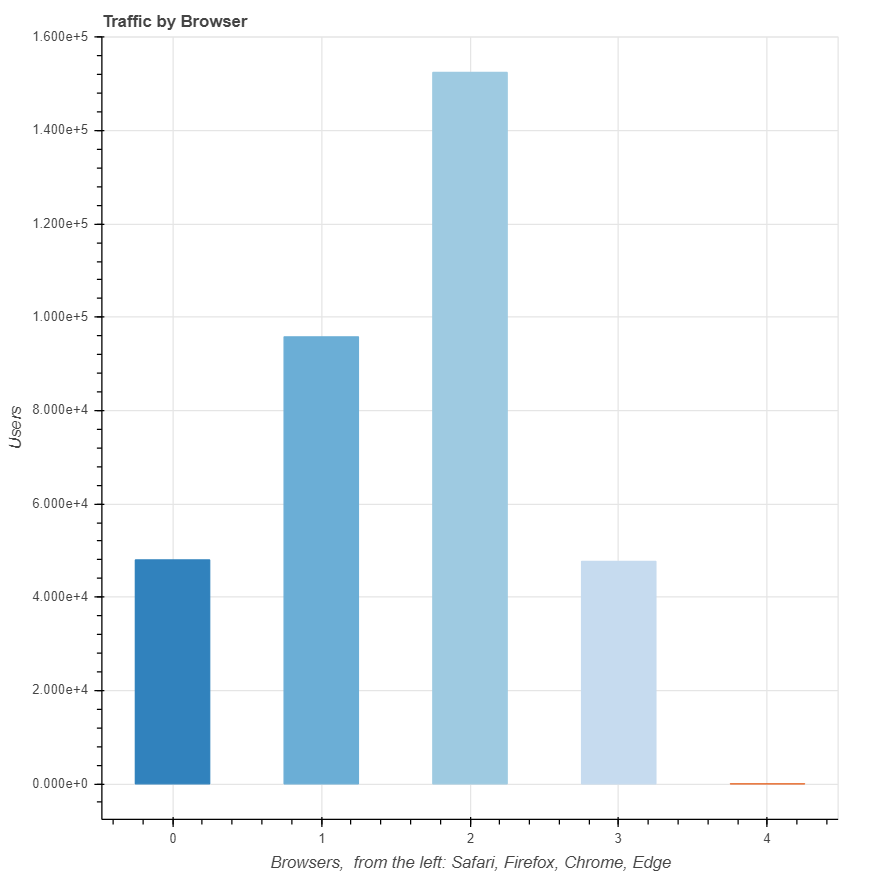
Users by browser
-
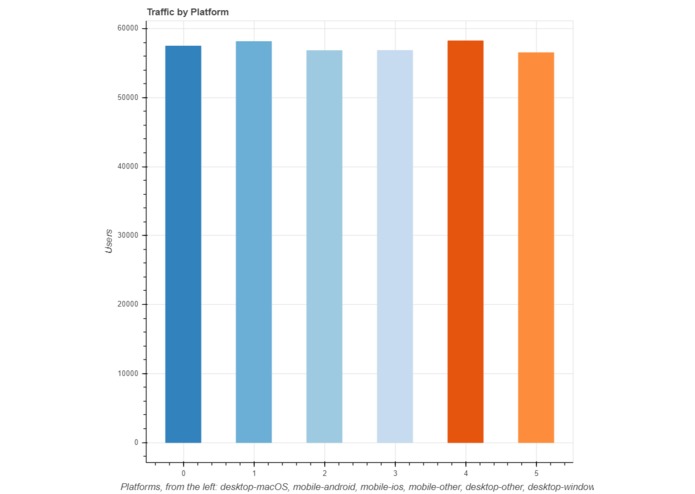
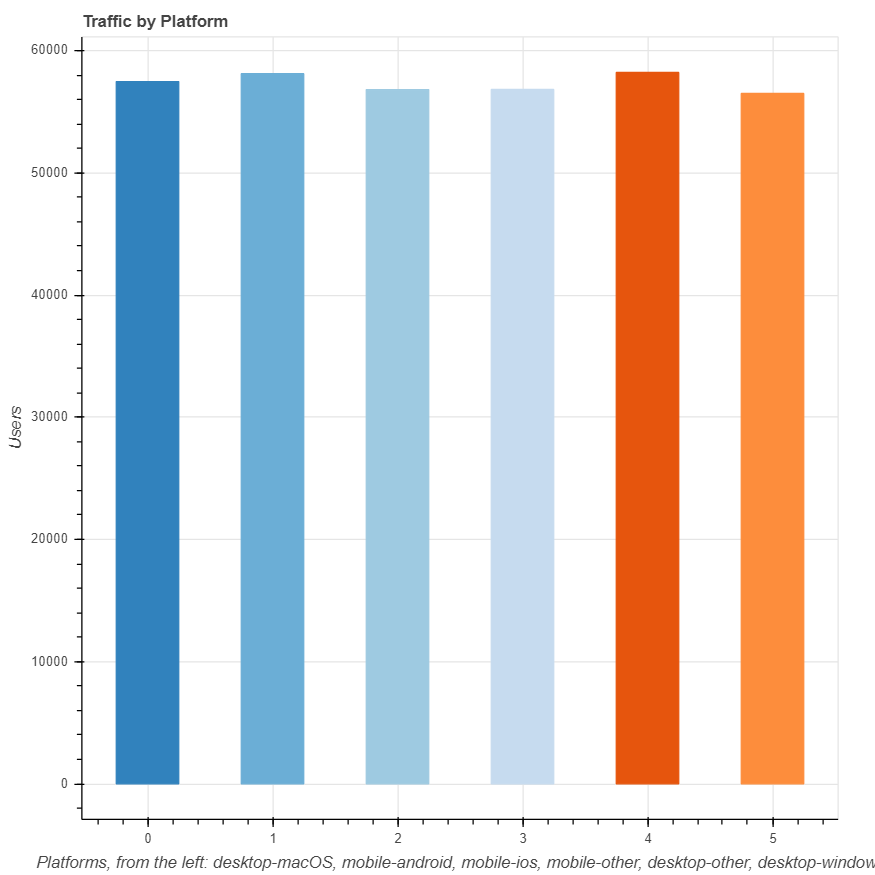
Users by platform
-
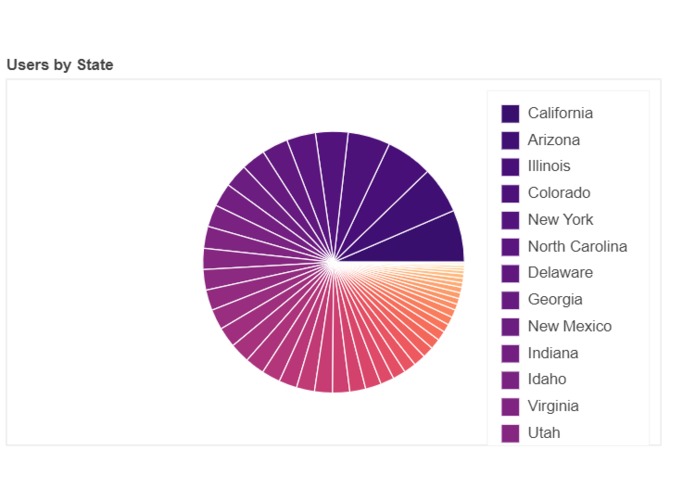
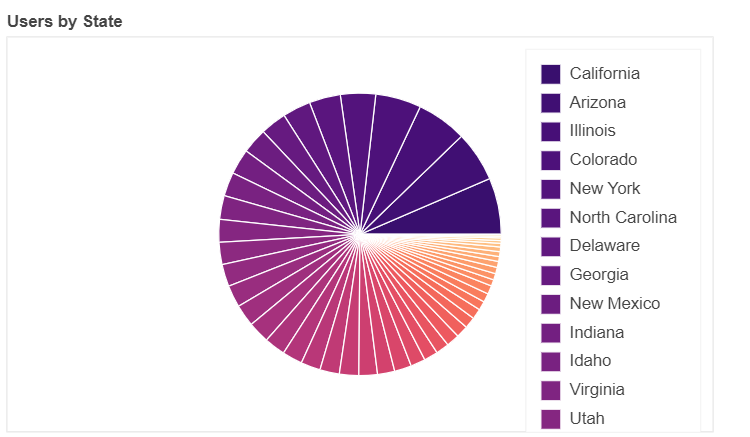
Users by state
Inspiration
We had an interest in data science, and Oppenheimer Funds had a large set of data that needed analyzing.
What it does
The project attempts to organize seemingly unrelated clickstream data into a group of clusters that should cover roughly 80% of web traffic to oppenheimerfunds.com
How we built it
We used python and Unix terminal commands to break down the data into smaller groups that were then funnelled into the Google Cloud platform to produce graphs.
Challenges we ran into
The data sets produced graphs that were too complex to be generated on a local machine. We needed to utilize the computing provided by Google's Cloud computing to generate some of the graphs.
Accomplishments that we're proud of
We succeeded to graph a number of the data sets we produced.
What we learned
Never try to export a directed graph with 3 million nodes to a .dot file locally.
Gained a much greater familiarity with graphing packages in Python.
What's next for Data-Mining Clickstreams
Due to the results we achieved, no future projects are planned. The conclusions we have drawn may be used to potentially reshape the current Oppenheimer website, however that is the extent of the usefulness of our findings.
Built With
- bokeh
- google-cloud
- networkx
- pandas
- python

Log in or sign up for Devpost to join the conversation.