Inspiration
We want to see if we’re moving away from fossil fuel to produce electricity which plays an essential role in our community.
Story
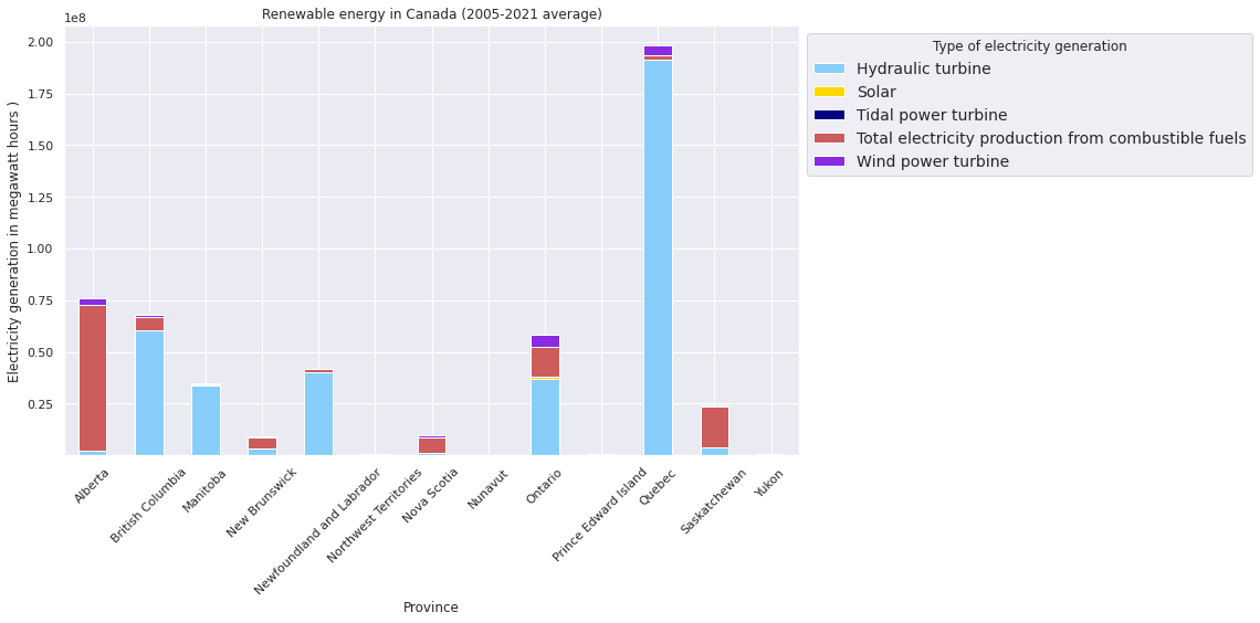
As residents of Canada, we often would want to know how good our country is, and a competitive side of us tends to want ourselves to be the best in said field. The data reveals that Canada is among the highest in terms of greenhouse gas emissions, and emissions per capita. This is unfortunately not a leaderboard we like to rank highly on, and so for the past 10 years Canada have been reducing our carbon footprint through renewable sources of energy. We looked at how Canada produces electricity, whether it's renewable, clean production or fossil fuel. According to the numbers, greenhouse emissions caused by electricity generation has been steadily going down as Canada turns toward renewable sources, with Alberta and Ontario having the most obvious drop in their emissions. However, we may wonder how those greenhouse emissions compare to the respective total emissions produced by the province. In respect to that criteria, we can see that Nova’s Scotia’s emissions are mostly composed of the emissions due to energy production. Again, we can see some provinces have a very low ratio such as Quebec, where almost none of their greenhouse emissions come from energy production. To delve deeper in the energy composition of each province, we can see how throughout the years, provinces such as Nova Scotia and Alberta rely heavily on combustible fuels whereas provinces like Manitoba do not at all. One important notion we can take from this graph is how Canada’s energy relies mostly on Hydroelectricity.
Behind the story: Our Data Analysis
We use the pandas library to retrieve/ organize the data and a mix of pandas plus seaborn to draw the graphs
What are your data sources?
https://www150.statcan.gc.ca/t1/tbl1/en/cv.action?pid=2510002001
What did you do with the data?
First, we read the data from all the csv files, then we trim the unnecessary part, and finally merge the relevant data together to make a chart.
OPTIONAL: What we learned
One of our biggest challenges was where to find credible data sources. Over the 2 days, we have acquired plenty of new skills in python, mainly on how to use the two seaborn, pandas library and how to look/manipulate data with these tools


Log in or sign up for Devpost to join the conversation.