-

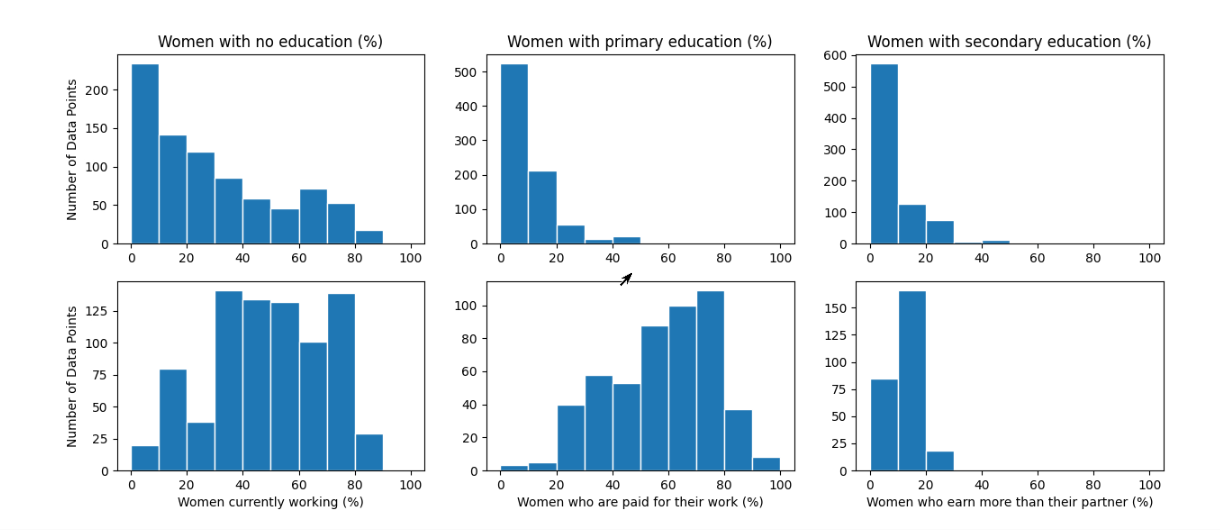
This is the project's histogram graphs configuration that should pop up on the display window when the code is ran.
-
Here is the digital graphic I created for my project that displays the title, "Empowering Data", and my name.
Inspiration
My inspiration for “Empowering Data” was my mom who sacrificed her education and home to immigrate to America. When my mother was a young adult, she packed her bags and moved to America despite having no connections, no higher education, no English, and no money. Her journey was incredibly challenging since getting a job in a new country with no education or work experience to support her family was nearly impossible. Despite her odds, my mother has taught me what true hard work, determination, and grit means. Through my project, I hope to raise awareness of the importance of having accessibility and inclusivity in education and the work field to empower more women to join the tech industry.
What it does
Empowering Data utilizes datasets from Livwell to provide data about important women’s topics for the rest of the code. The imported Panda tool converts the data files into readable variables that can be processed into graphs. By using the matgraphlib tool, I created six histograms regarding education, workforce participation, and equal pay and formed them into a 3x2 configuration. When you hit the run button, the histogram configuration will pop up in the display window with all of the graphs accurately labeled. Please expand the window in order to see the full configuration.
How I built it
I built my code using Replit as my platform, Python as my coding language, and multiple imported tools. I imported pandas in order to convert the livwell datasets from CVS (comma-separated values) files into readable variables for the rest of the code. I also imported mat.plotlib.pyplot in order to aid in creating the histograms and configuration. After that, I had to go through continuous hours of trial and error in order to properly and accurately format the histograms and then configure them into a subplot. While coding Empowering Data, I made sure that all of the graphs would accurately represent that data by setting the x-axis range to [0, 100]. This is to prevent any sort of cherry-picked data or data bias.
Challenges I ran into
A challenge I ran into was trying to figure out how to create and format multiple subplots. I tried to solve this issue for hours on end. I tried debugging, deleting files, creating new files, and redoing my entire project. After countless video tutorials and Reddit posts, I finally figured out the code that worked with my specific set of data. My problem was with the histogram’s code overlapping with one another. I am more experienced with the structure of Java coding from my AP Computer Science A class, so getting familiar again with Python was a learning curve.
Accomplishments that I’m proud of
Through this hackathon, I was able to discover my potential career path in data science. Throughout my high school career, I have always been interested in the programming aspect of computer science, so I was set on becoming a Software Engineer or Computer Programmer. I have tried out different branches of computer science before like cybersecurity and engineering, but this challenge has created a passion for data science for me. In addition, this is my first time ever competing in a hackathon, so I thought that it would only be right for me to compete solo to create something that advocates for an issue that I find extremely important to advocate for. I have always found the idea of competing in a hackathon daunting since computer science is such a heavily male-dominated field. However, through connections and social media, I was able to learn about EmpoweringAI and StemBridge which fully support women's empowerment in the tech field, which I have always believed in and fought for.
What I learned
From this weekend-long hackathon, I learned how to work independently under stressful situations. I started working on Empowering Data at 3:00 PM on Saturday and worked for 8 hours straight til 11:00 PM. I had to teach myself an entirely new branch of computer science because I wanted to challenge myself to create something I fully believe can create an impactful change for women in tech. I believe that through data science, we can learn from past and current events in order to identify trends and make policies in order to improve upon issues. Through my histogram graphs, I discovered how shockingly low the percentage of women who had primary or secondary education was. Even worse, the percentage of women who earned more than their male counterpart/partner was only around %15.
What's next for Empowering Data
I hope to create a website using my experience with web development to have a reliable resource for people to reference and gain awareness of women’s issues. By creating a larger platform for my mission, I strive for researchers to learn and government officials to create policies from my data that can help women pursue higher education and gain rigorous jobs in the tech industry.


Log in or sign up for Devpost to join the conversation.