Inspiration
Modern web frontend development is haunted by invisible "ghosts" — unused properties, broken dependencies, and hidden side effects lurking in complex components. As applications grow, understanding how data flows through React, Vue, or Svelte components becomes increasingly difficult, making code reviews and maintenance a nightmare.
I respected the Data Flow Diagram (DFD) , a classic visualization technique from 1978 that fell out of favor when object-oriented programming dominated. But today's frontend has returned to state-centric, functional patterns — making DFD the perfect "resurrection" candidate for visualizing modern component architecture. I tried to use it for few years. So I tried to create automated visualization tool by using Kiro AI power.
What it does
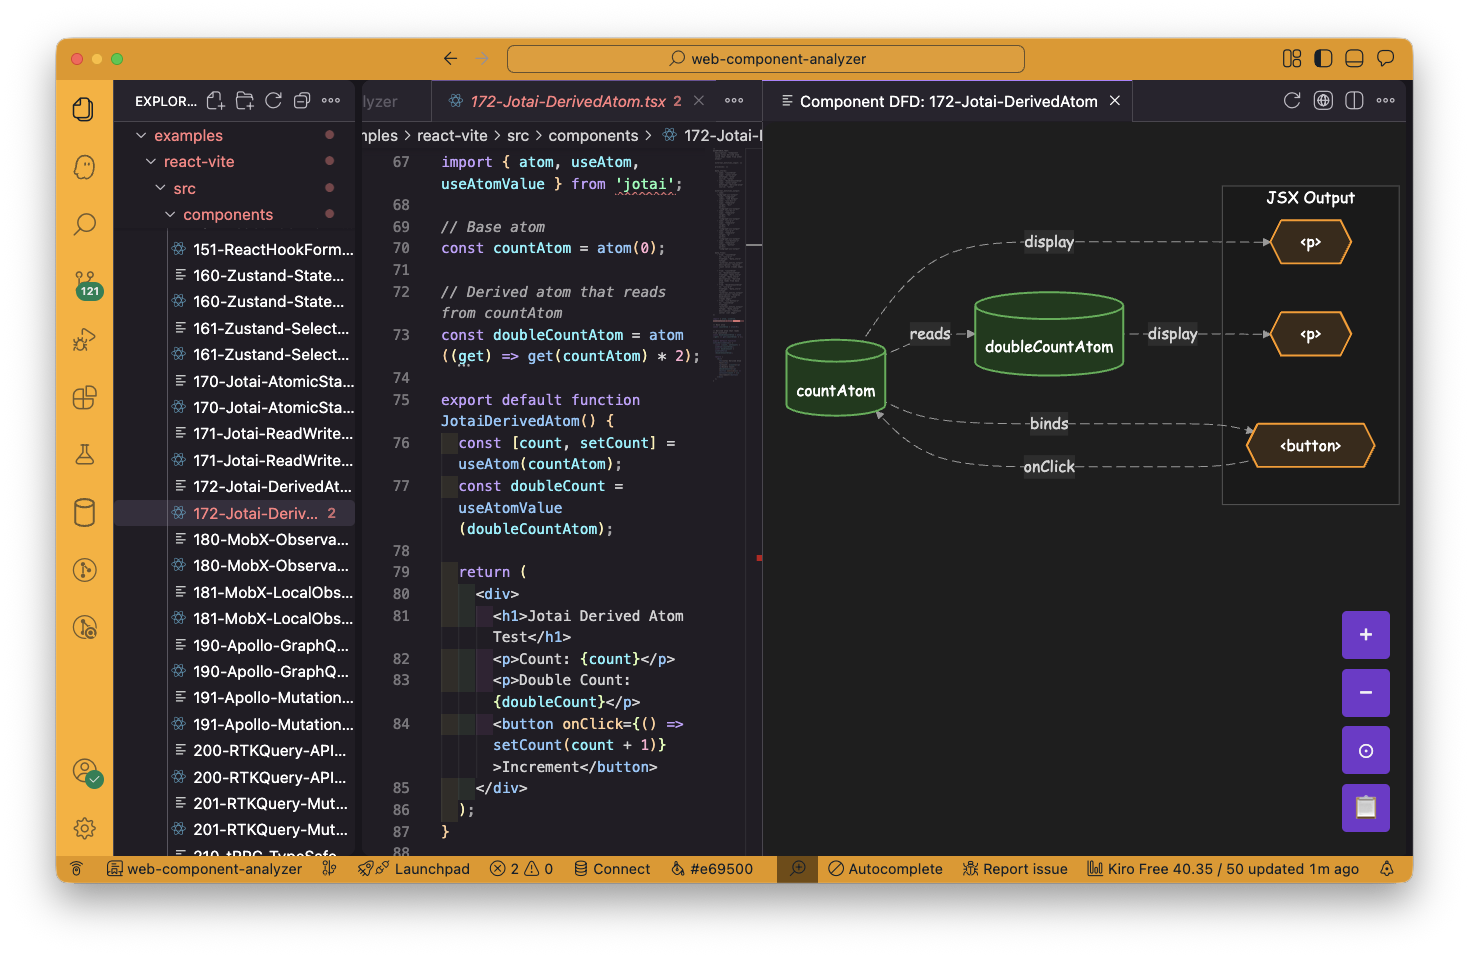
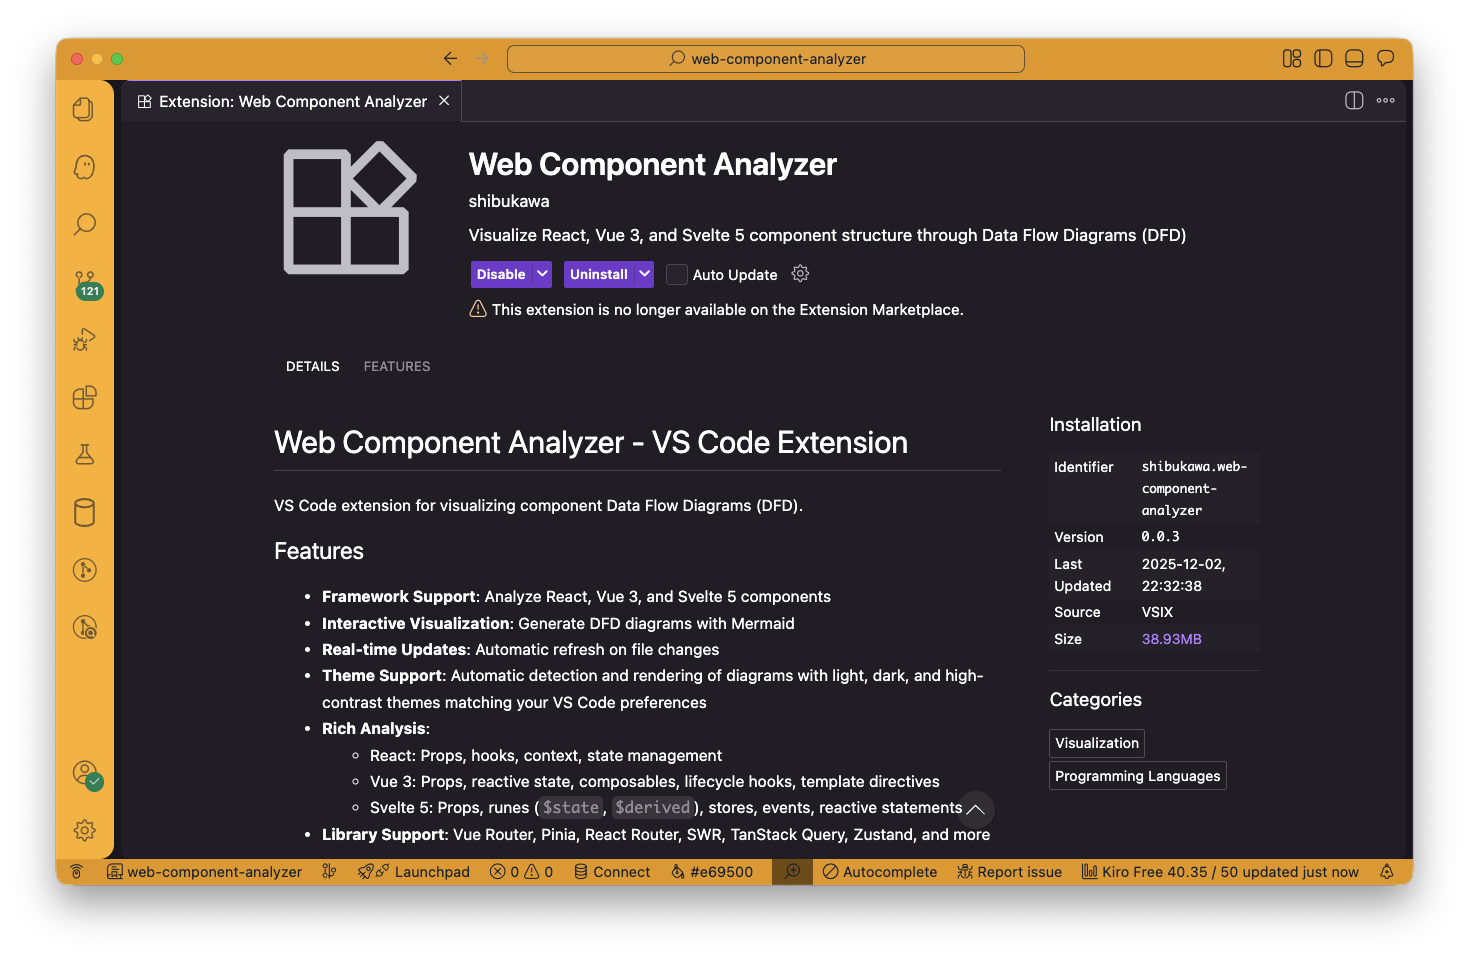
Web Component Analyzer is a VSCode extension (of course, it works on Kiro too!) that performs static analysis on React, Vue 3, and Svelte 5 components to automatically generate Data Flow Diagrams. It visualizes:
- Props and callbacks coming into the component
- Local state and how it's read/written
- Side effects from hooks like useEffect
- External dependencies like routers and global stores
- Data fetching processes
Users can click any node to jump directly to the source code, and the diagram auto-updates when the file is saved. A web-based playground is also available for quick experimentation.
How we built it
- At first, I made React version's VSCode extension by using Kiro. React is the most popular framework. Even if I only could made simplest one, it still would be useful. I reduce risk I couldn't finish. I consumed 500 credits.
- I noticed submission form has "try it" link. So I added web playground version by using 200 credits.
- Then I added many react's third party library support. I consumed 500 credits.
- I still had 1300 credits. I added Vue 3 support first, then Svelte 5 supports.
- Then I consumes all credits for debugging.
Challenges we ran into
- Library selection. At first, I used Vis.js, but switched to Mermaid.js to support nested graph.
- Supporting VSCode Extension and Web. I used to use swc for parsing, but it is written in Rust and @swc/core works only on VSCode/Node. And @swc/wasm-web for web. I took time to keep compatibility for them.
- Quality assurance. I made only acceptance tests and I relied on Kiro for unit testing. Micro management is bad idea to achieve great performance from AI. So I focused on only higher level testing.
- Supporting VSCode and Kiro. I made account VSCode marketplace and OpenVSX to publish my extension for them.
Accomplishments that we're proud of
- Completely automatic visualization with very useful quality.
- Multi-framework support: One tool that works seamlessly across React, Vue, and Svelte
- Halloween Easter egg: Dark mode reveals spooky team emojis in the web playground 🎃
What we learned
- SWC is useful for parsing (Kiro taught me).
- VSCode extension's publish workflow
- Good testing strategy for AI
- Kiro's work style. When I used it first time. I used only spec features, but steering feature is more important than spec. It defines product wide knowledge and rules.
What's next for Data Flow Diagram for Web Frontend
- More library supports (Solid.js?)
- Vue's coverage: It supports only style. Other styles (JSX, options API, composition API and so on) are ignored now.</li> <li>Svelte's coverage: It supports only Svelte5's style now.</li> <li>Cross component analysis.</li> </ul>
Built With
- mermaid.js
- monaco-editor
- ovsx
- svc
- svce
- typescript


Log in or sign up for Devpost to join the conversation.