
Inspiration
I love learning all different types of mathematics and I always wondered what mathematical models would be like with the use of computer science. From how it is structured and what programming languages to use, I started to ease myself into computer science.
What it does
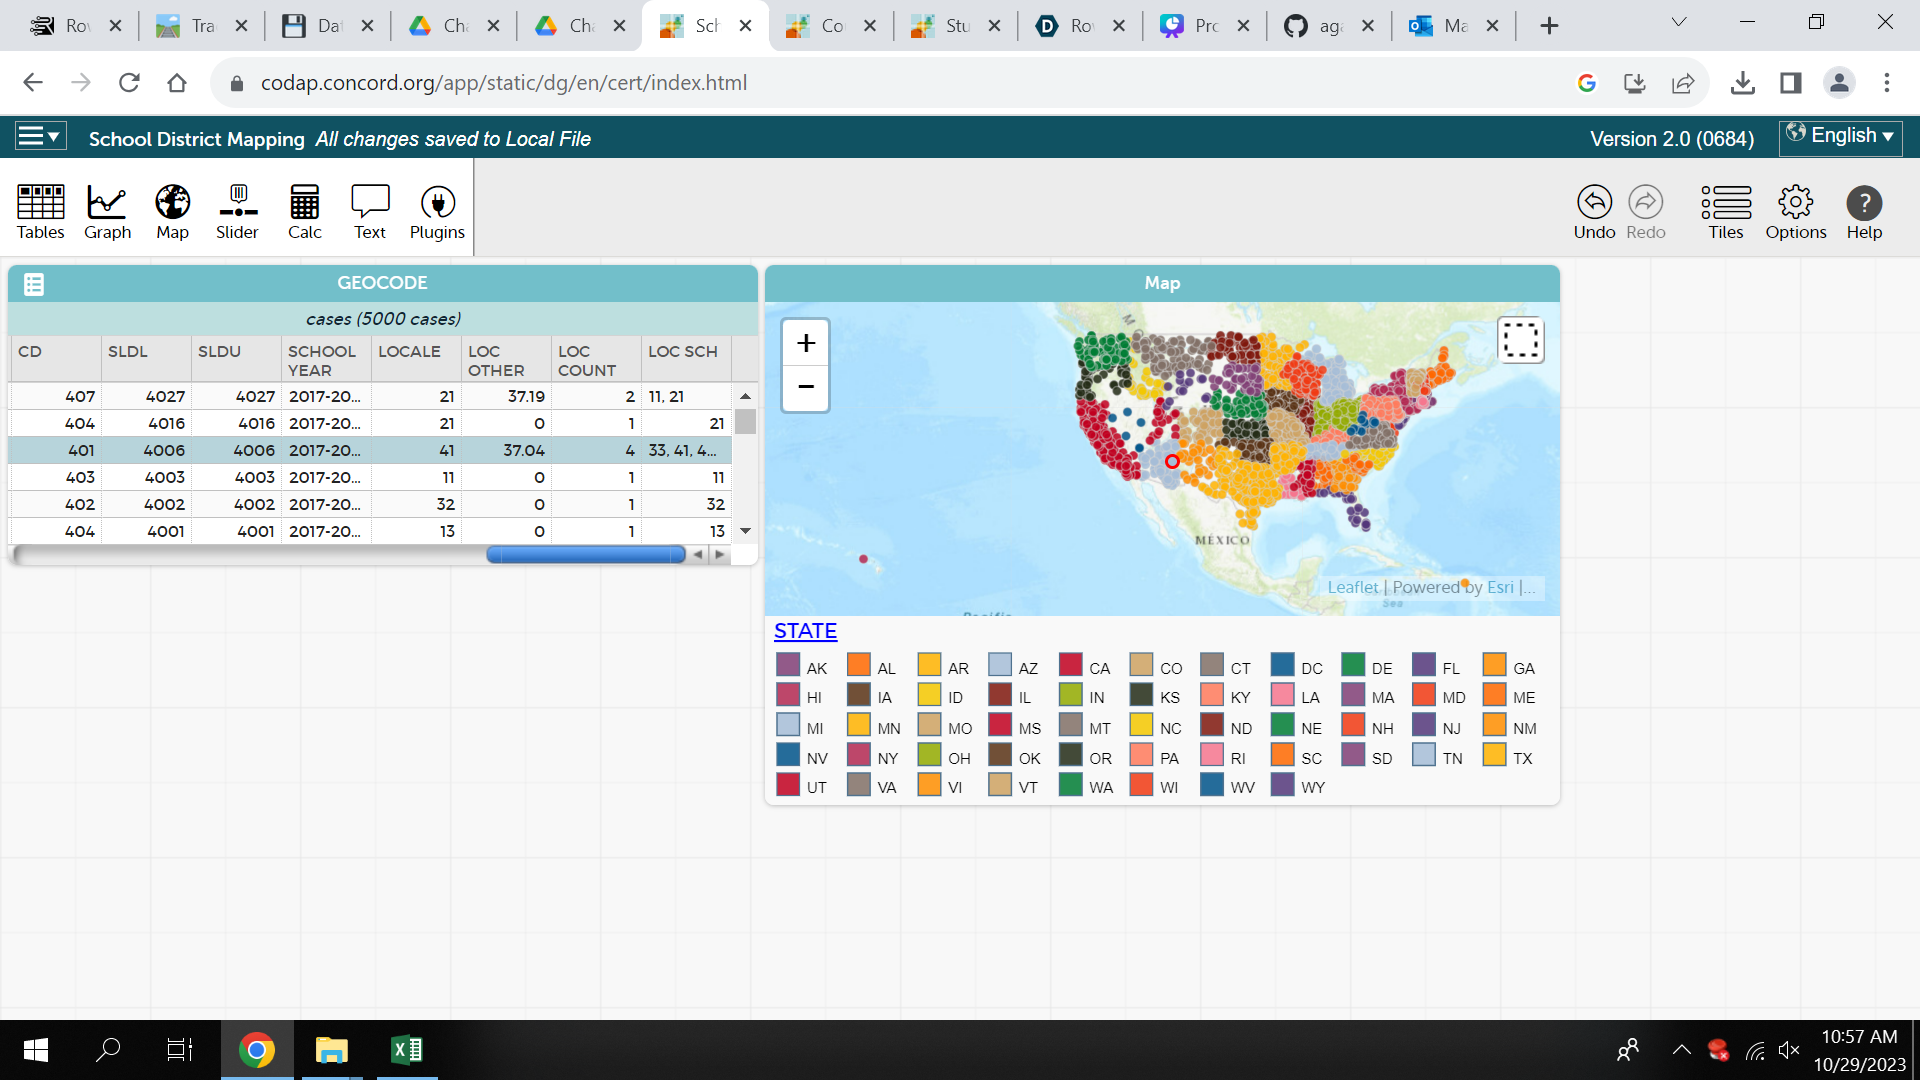
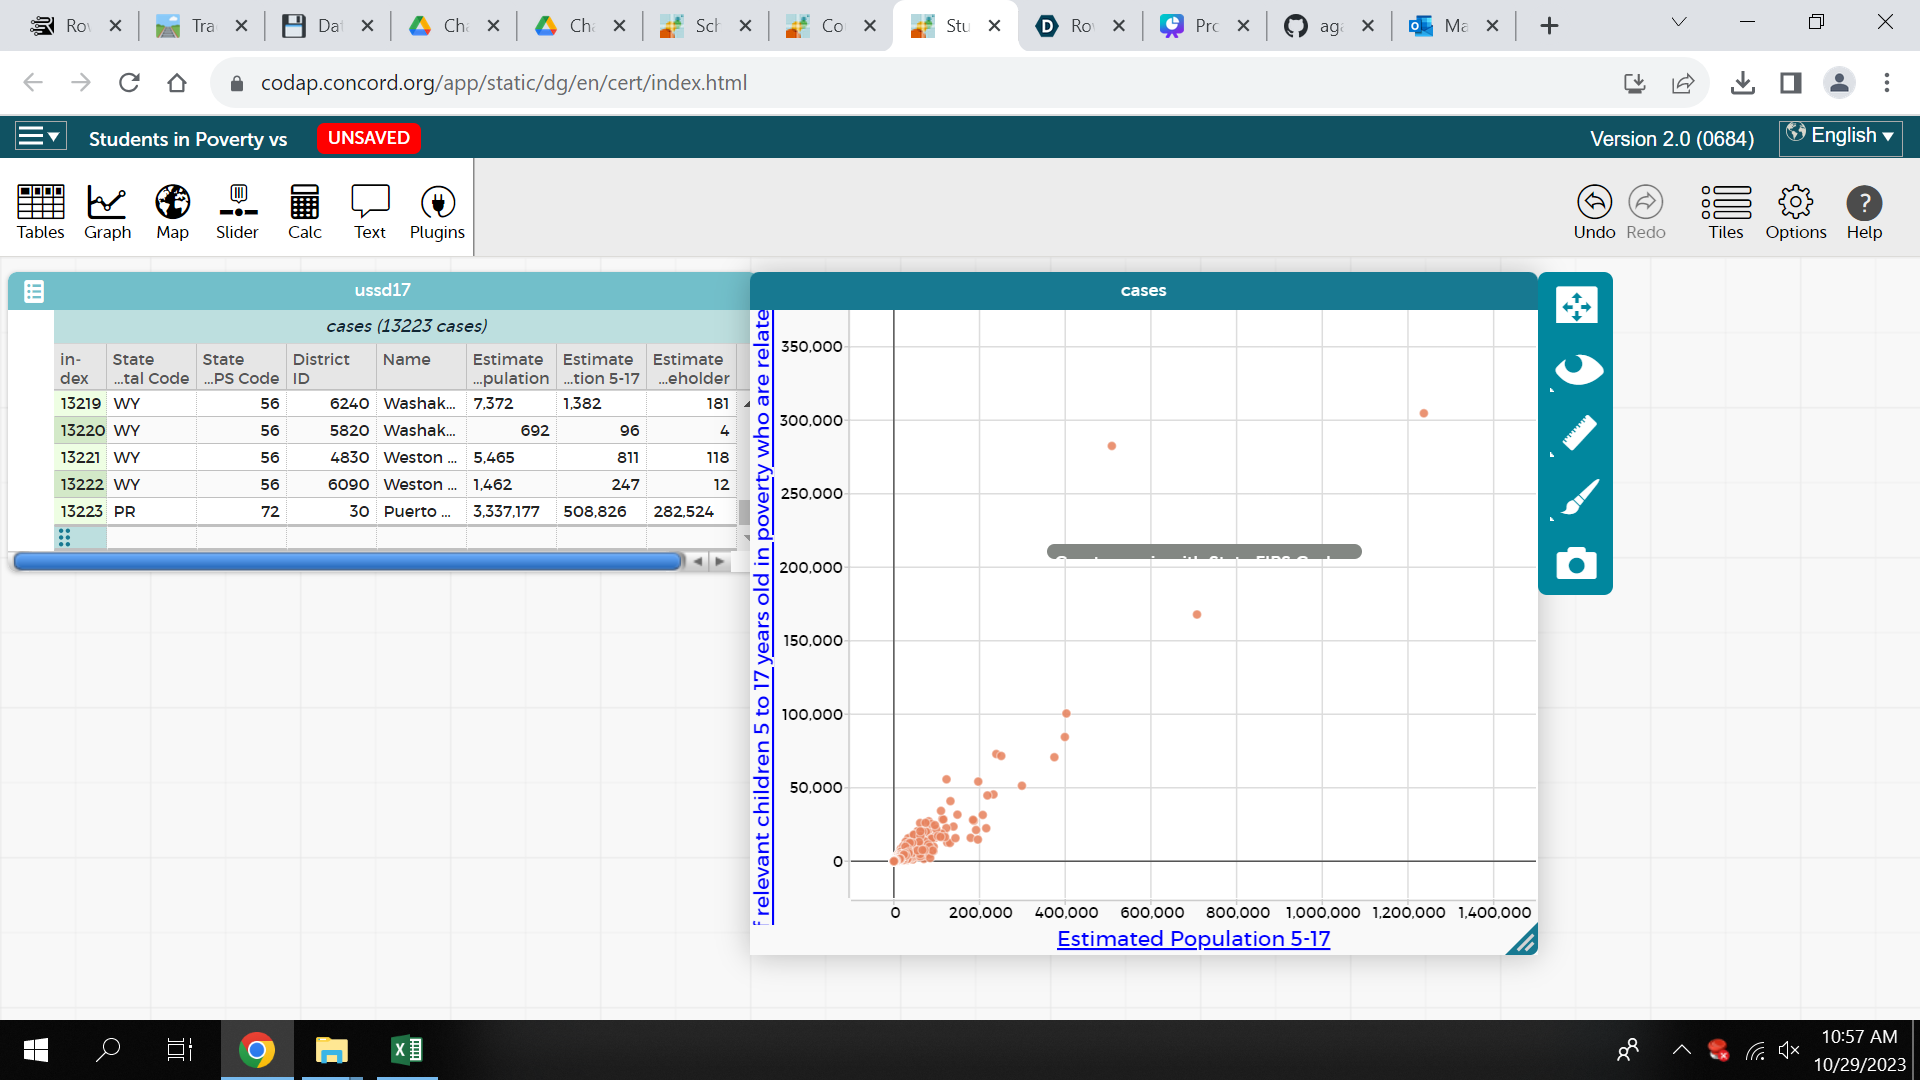
It shows the map of all school districts within all 50 states of the U.S. It also has data of the total number of students living in poverty compared to the rest of the students in each school district.
How we built it
We used the data given to us and created the graphs and map using CODAP.
Challenges we ran into
The different data sets had different number of school districts meaning that not all districts are represented.
Accomplishments that we're proud
We were able to generate the map and the graphs with the data sets given to us
What we learned
We learned how to use CODAP and how it can be used to read .csv files and generate data
What's next for Data-Driven Beginner's Track Find more information regarding each school district regarding students in poverty.
Built With
- codap

Log in or sign up for Devpost to join the conversation.