-
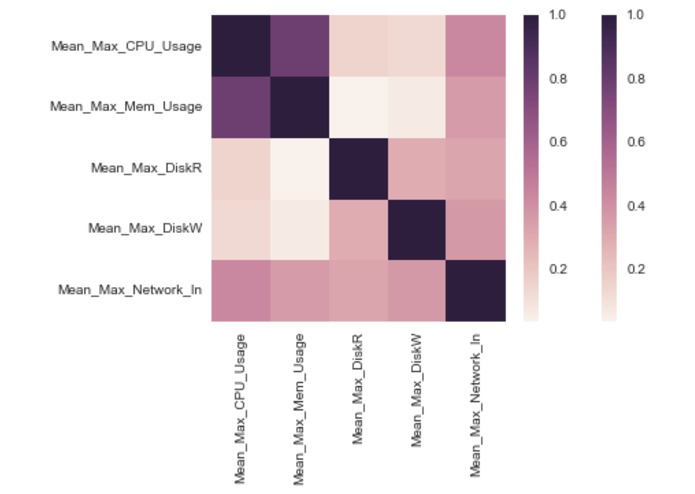
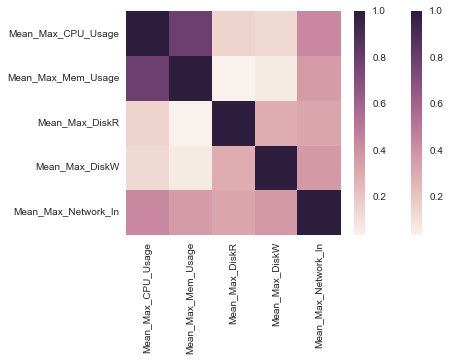
The correlation of 5 features based on 1700+ machines
-
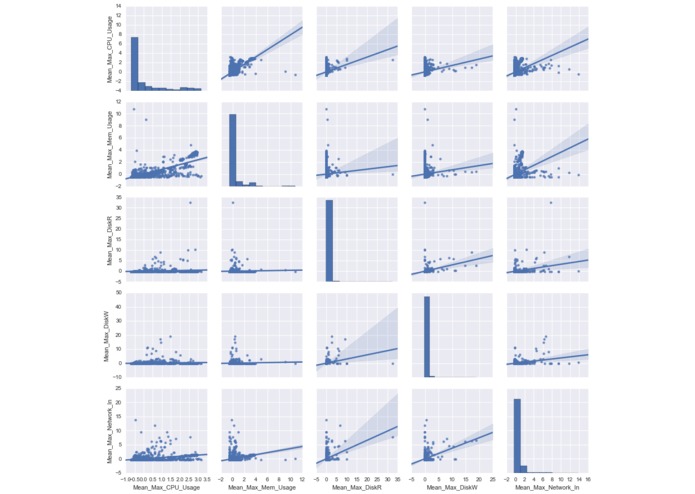
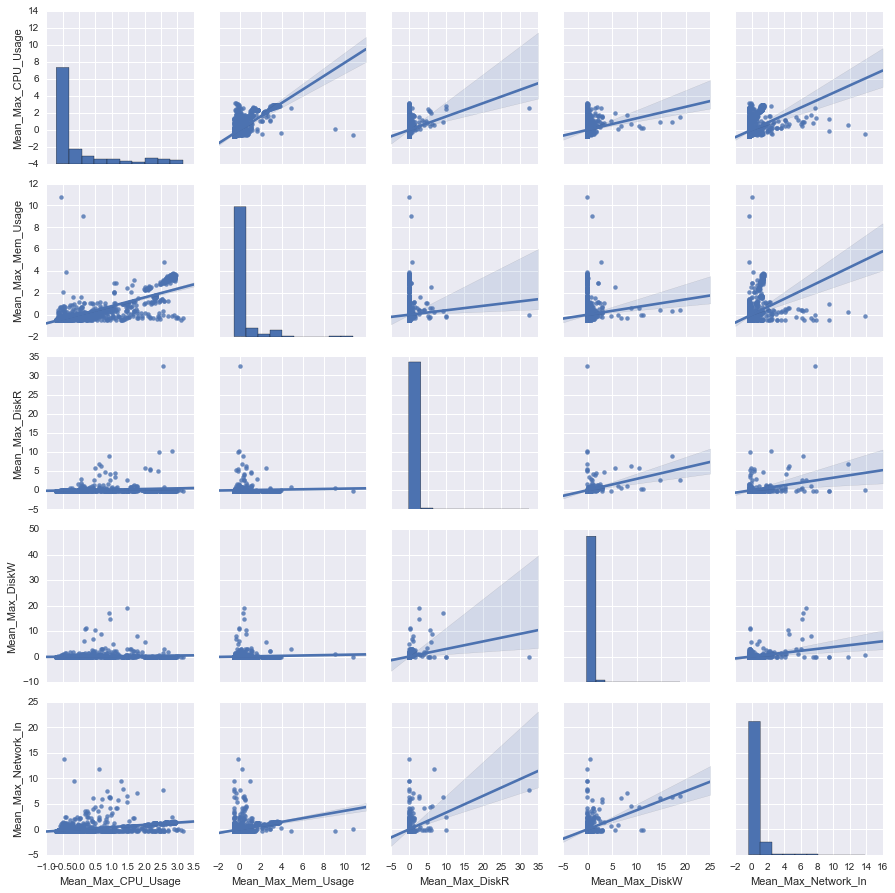
Pairplot for 5 features. Result verifies the correlation heat map.
-
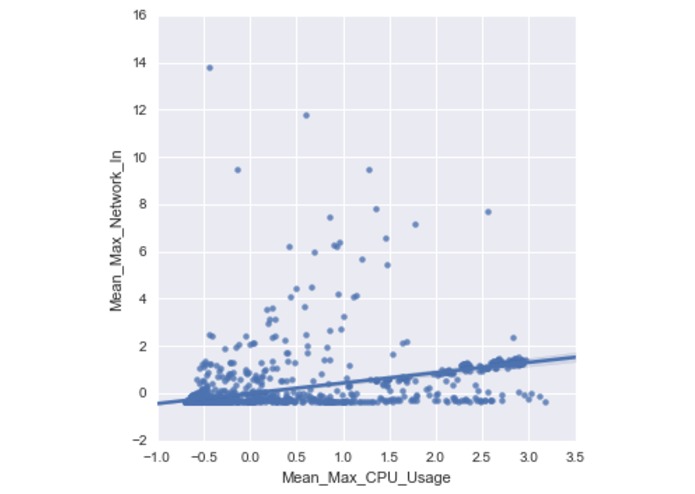
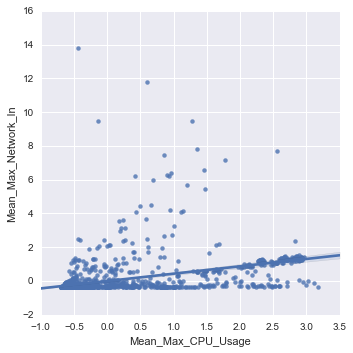
Regression of CPU_Usage and Network_Input
-
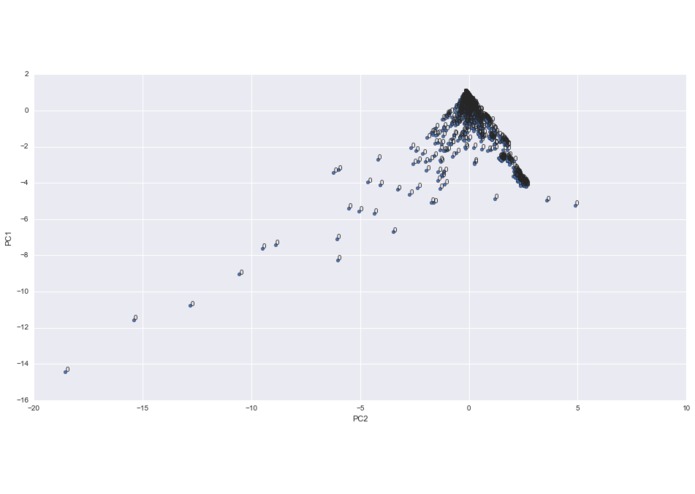
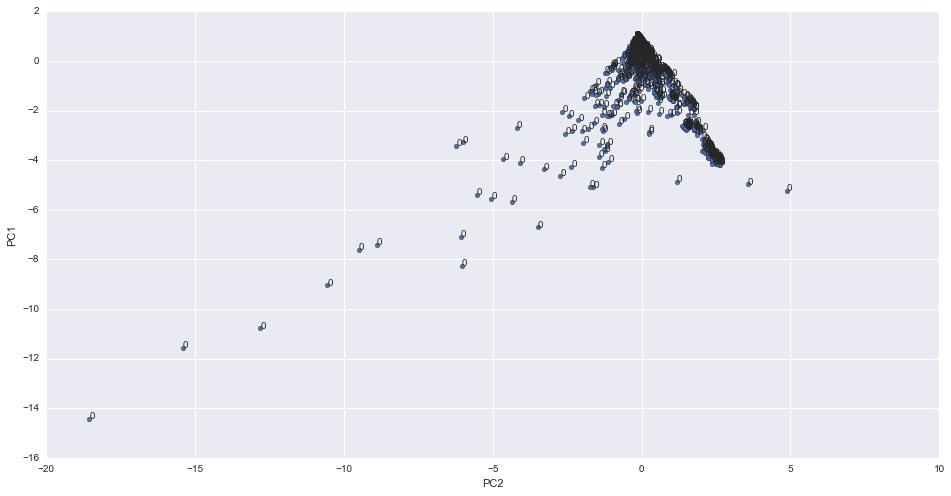
Principal component analysis. Take PC1 and PC2 and map it on a 2D Plain. Result shows the data cannot be perfectly described by using PC1,2.
Inspiration
Analyzing usage of virtual machines in different industry. Providing useful information to assess if a machine is being used efficiently.
What it does
Provide an overall view of 100 csv files about virtual machine's cpu/memory/disk/internet usage.
How I built it
Use Jupyter python note and pandas, seaborn, numpy packages.
Challenges I ran into
The original dataset has less than 10 useful dimension and correlation analysis shows that there is little correlation between them.
Accomplishments that I'm proud of
Analyzed the whole 100 csv files and refine the data to a small dataset contains less than 2000 tuples.
What I learned
Seaborn plot package. There exists correlation between CPU_Usage and Memory_Usage but not strong correlation. Internet Input will contribute to all other features but also not strong correlation.
What's next for Data Challenge: Virtual Machine Data Analysis
Build a better scoring system to give each machine a usage score.


Log in or sign up for Devpost to join the conversation.