-
-

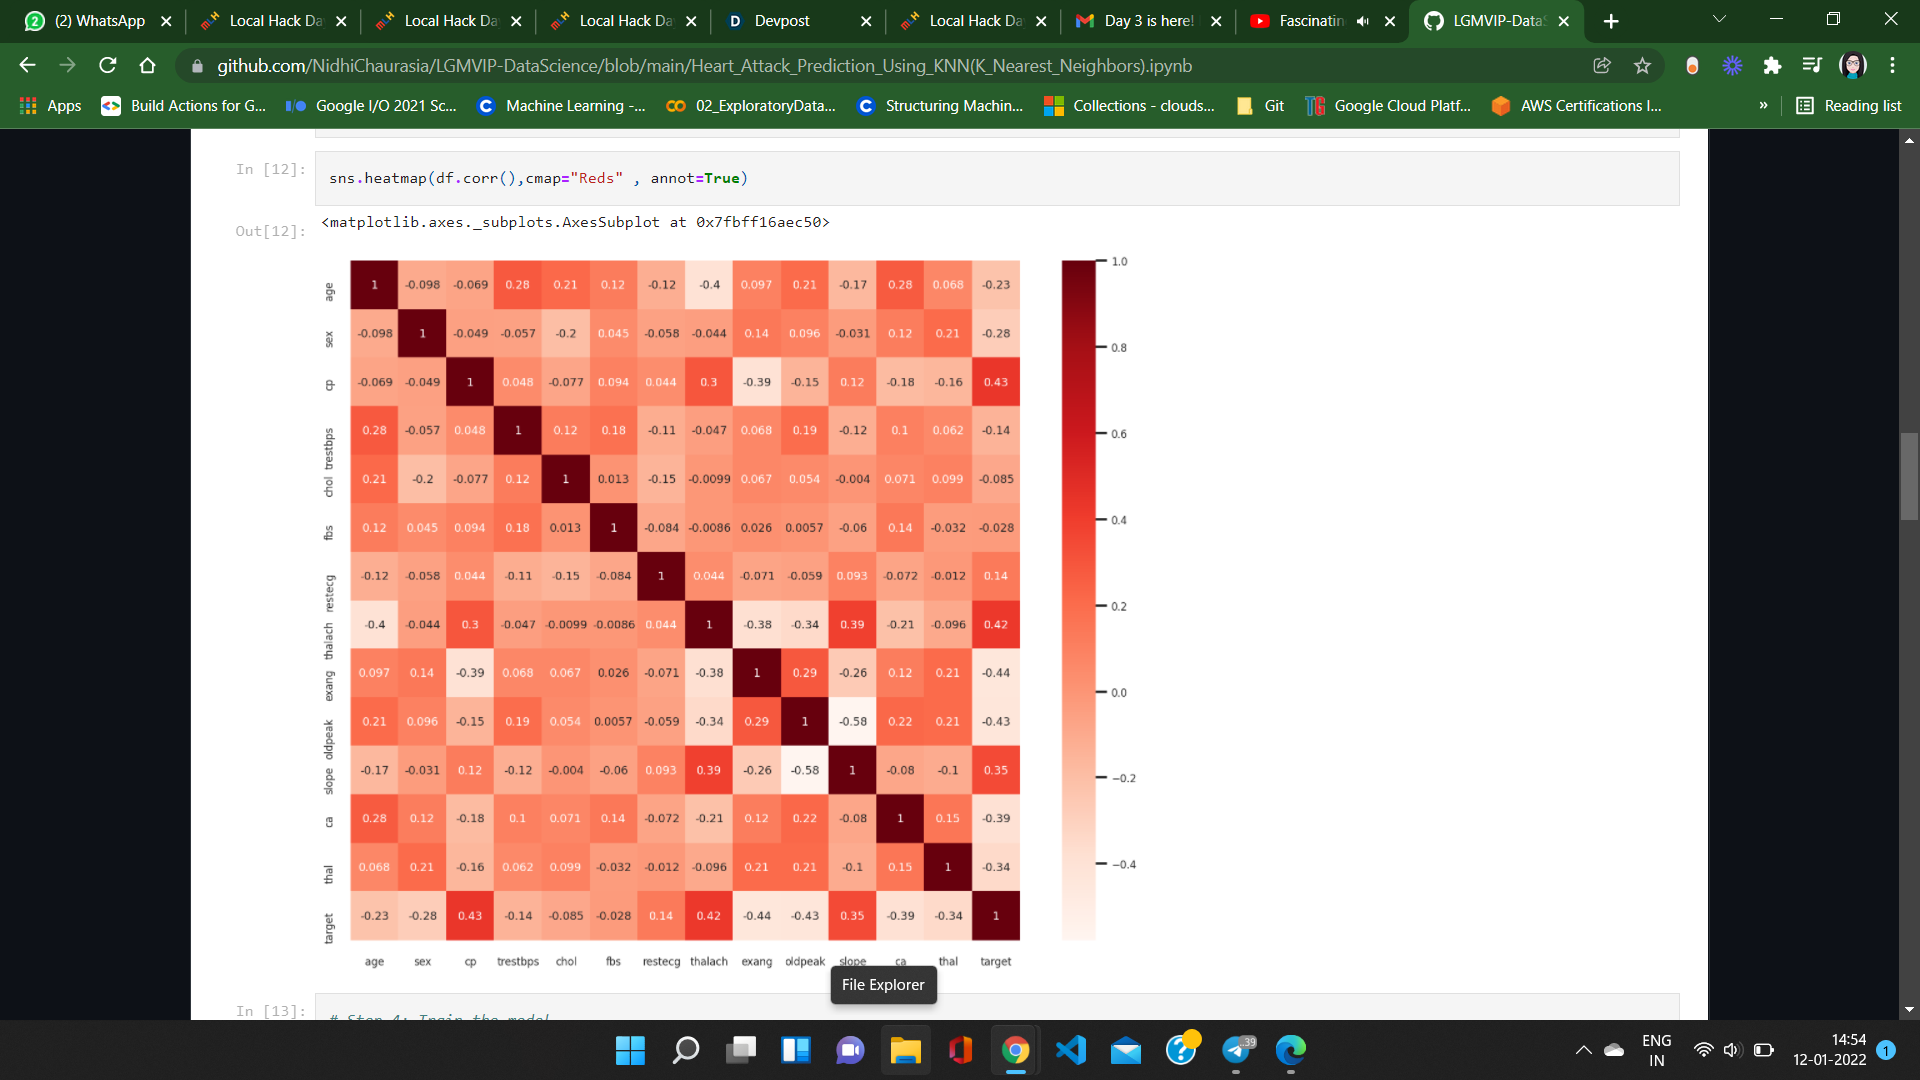
Snapshot of just one part of the Project
Inspiration
The inspiration behind the project is that I wanted to kick-start my Data-Science career after learning Python-Programming and these projects helped me out to get my hands dirty on Data-Analytics and examine the data through various resources.
What it does
Health care: Heart attack possibility By Predicting the heart attack using dataset :-
About data set This database contains 76 attributes, but all published experiments refer to using a subset of 14 of them. In particular, the Cleveland database is the only one that has been used by ML researchers to this date.The "target" field refers to the presence of heart disease in the patient. It is integer valued 0 = no/less chance of heart attack and 1 = more chance of heart attack.
To know more about Health care: Heart attack possibility dataset click this link :- https://archive.ics.uci.edu/ml/datasets/Heart+Disease
IRIS Flowers Classification ML Project By predicting various features of the Flower like Sepal length and width ,petal length and petal width of the 3 different flowers (Setosa,Virginica,Versicolor) .
About data set This particular ML Project is usually referred to as the "Hello World" of Machine Learning.The IRIS flowers dataset contains numeric attributes, and it is perfect for beginners to learn about supervised ML algorithms,mainly how to load and handle data.Also,since this is a small dataset, it can easily fit in memory without requiring special transformations or scaling capabilities.
To know more about IRIS Dataset : Please checkout this link :- http://archive.ics.uci.edu/ml/datasets/Iris
Stock Market Prediction Using Decision Tree Regression Model in sklearn and Linear Regression Model Dataset used to build this stock price prediction model, is the NSE TATA GLOBAL dataset. This is a dataset of Tata Beverages from Tata Global Beverages Limited, National Stock Exchange of India: https://raw.githubusercontent.com/mwitiderrick/stockprice/master/NSE-TATAGLOBAL.csv
Gan-for-generating-hand-written-digits What is a generative adversarial network ?
-> A generative adversarial network (GAN) is a type of construct in neural network technology that offers a wide range of applications in the world of artificial intelligence. Generative Adversarial Networks, or GANs, are a deep-learning-based generative model. More generally, GANs are a model architecture for training a generative model, and it is most common to use deep learning models in this architecture.
Fashion_Accessories_prediction_model_using_Convolutional_Neural_Network I have imported dataset from tf.keras.datasets.fashion_mnist as it was predefined into the keras library.
It gradually Loads the Fashion-MNIST dataset.
This is a dataset of 60,000 28x28 grayscale images of 10 fashion categories, along with a test set of 10,000 images. This dataset can be used as a drop-in replacement for MNIST.
The classes are:
Label Description 0 T-shirt/top 1 Trouser 2 Pullover 3 Dress 4 Coat 5 Sandal 6 Shirt 7 Sneaker 8 Bag 9 Ankle boot
To know more about the api references and built-in small datasets visit this -> https://keras.io/api/datasets/fashion_mnist/
VGG19Model_(CIFAR100) : Feature extraction and fine-tuning. This model is a Keras Applications of deep learning models that are made available alongside pre-trained weights. These models can be used for prediction, feature extraction, and fine-tuning.
Weights are downloaded automatically when instantiating a model. They are stored at ~/.keras/models/. The list of classes in this model are ['airplane', 'automobile', 'bird', 'cat', 'deer', 'dog', 'frog', 'horse', 'ship', 'truck'].
Upon instantiation, the models will be built according to the image data format set in your Keras configuration file at ~/.keras/keras.json. For instance, if you have set image_data_format=channels_last, then any model loaded from this repository will get built according to the TensorFlow data format convention, "Height-Width-Depth".
To know more about the API references and predefined model visit -> https://keras.io/api/applications/vgg/#vgg19-function
Image to Pencil Sketch with Python We will read the image in RBG format and then convert it to a grayscale image. This will turn an image into a classic black and white photo. Then the next thing to do is to invert the grayscale image also called negative image, this will be our inverted grayscale image. Inversion can be used to enhance details. Then we can finally create the pencil sketch by mixing the grayscale image with the inverted blurry image. This can be done by dividing the grayscale image by the inverted blurry image. Since images are just arrays, we can easily do this programmatically using the divide function from the cv2 library in Python.
The image I have used in this project is this https://static.independent.co.uk/s3fs-public/thumbnails/image/2016/09/02/11/mother-teresa-3.jpg?width=1200
Basically, it's absolutely beginner-friendly project that can be made using OpenCV, Python, and Matplotlib library for visualizations of the image transformation.
Challenges we ran into
I referred online resources to learn Data-Analytics and by the time when I ran into some issues I discussed with my Seniors and Professors.
What we learned
I learnt implementing various ML models and learnt to use Python libraries for making awesome projects.
Built With
- analytics
- data
- data-science
- machine-learning
- python


Log in or sign up for Devpost to join the conversation.