Inspiration
We wanted to take a closer look at Grundfos' dataset concerning a dormitory.
What it does
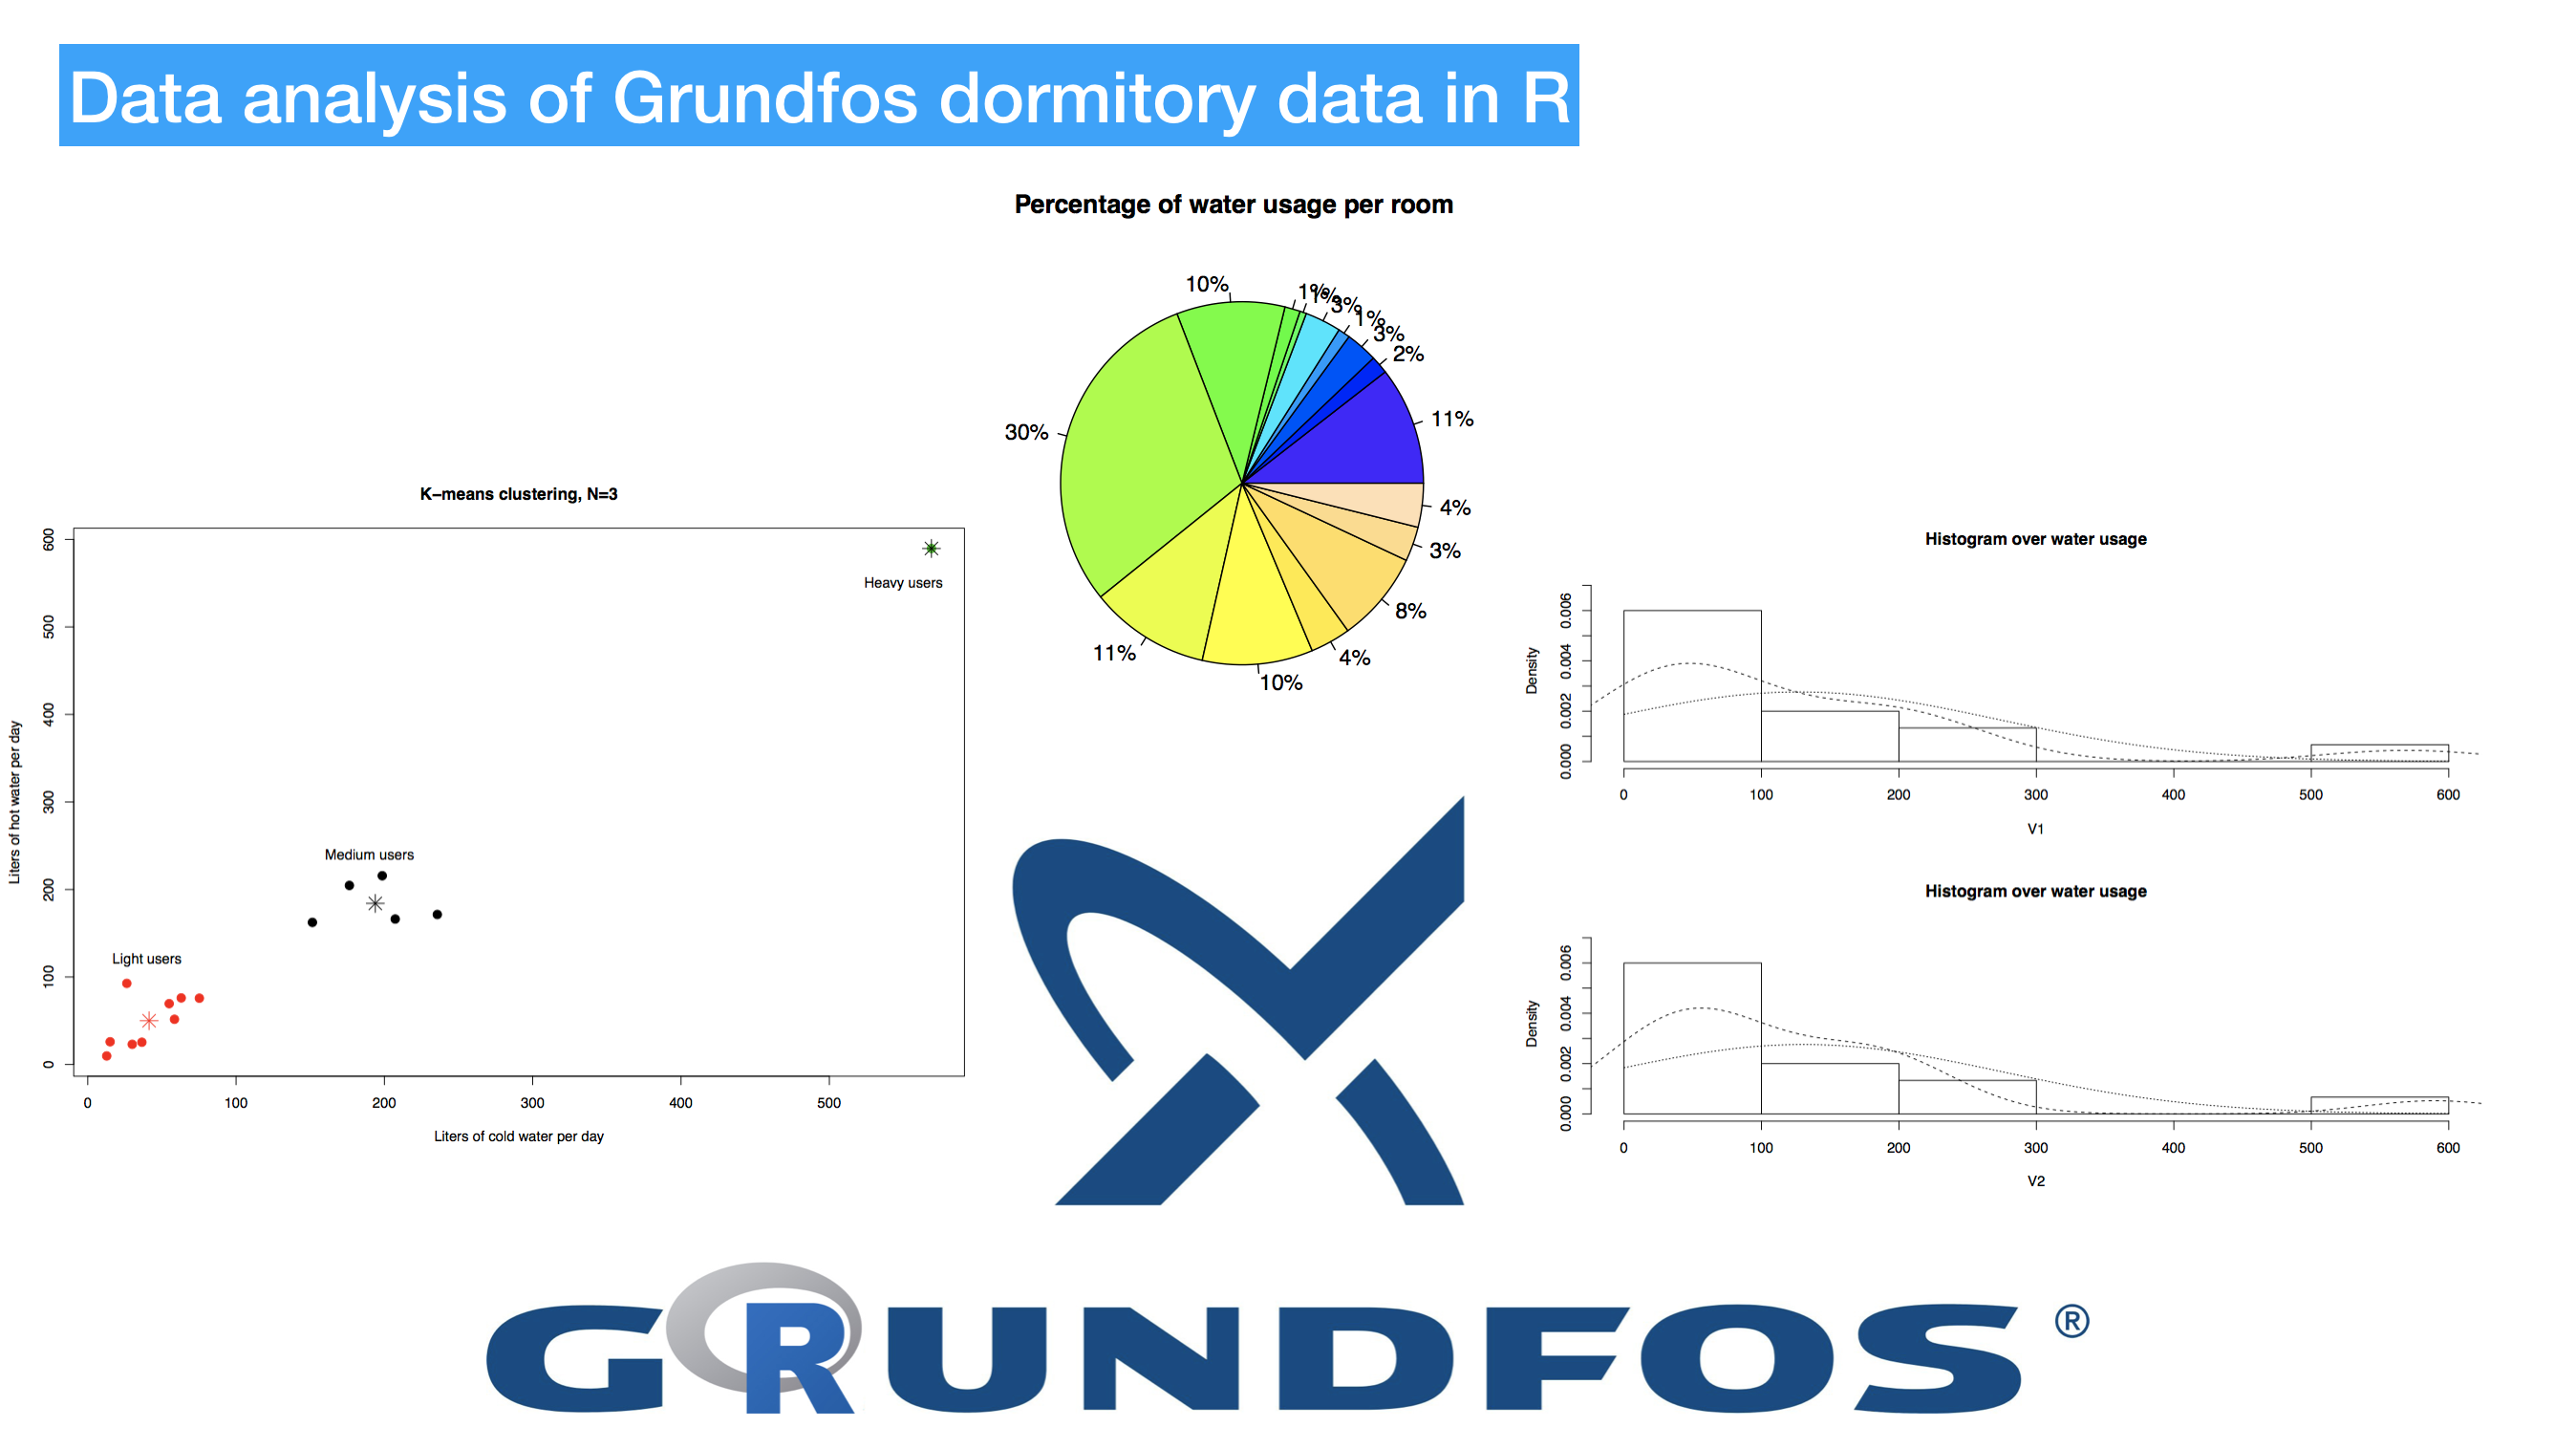
Gives insight to the provided dataset. Unfortunately, a small subset of the data was actually usable.
How I built it
We used R to perform analysis on the data
Challenges I ran into
Extracting the data, formatting the data, finding our way around the data, coding in R
Accomplishments that I'm proud of
We managed to process the data and give some output
What I learned
Dumb data is useless. If you're gathering data, make sure it is accessible and take the time to look at it. It may even show that your gathering methods are sub-optimal ;)
What's next for Data analysis of Grundfos dormitory data in R
Provide some interesting - maybe interactive - frontends for the data. Telling people the importance of their water usage is a big concern in modern society.

Log in or sign up for Devpost to join the conversation.