-
-

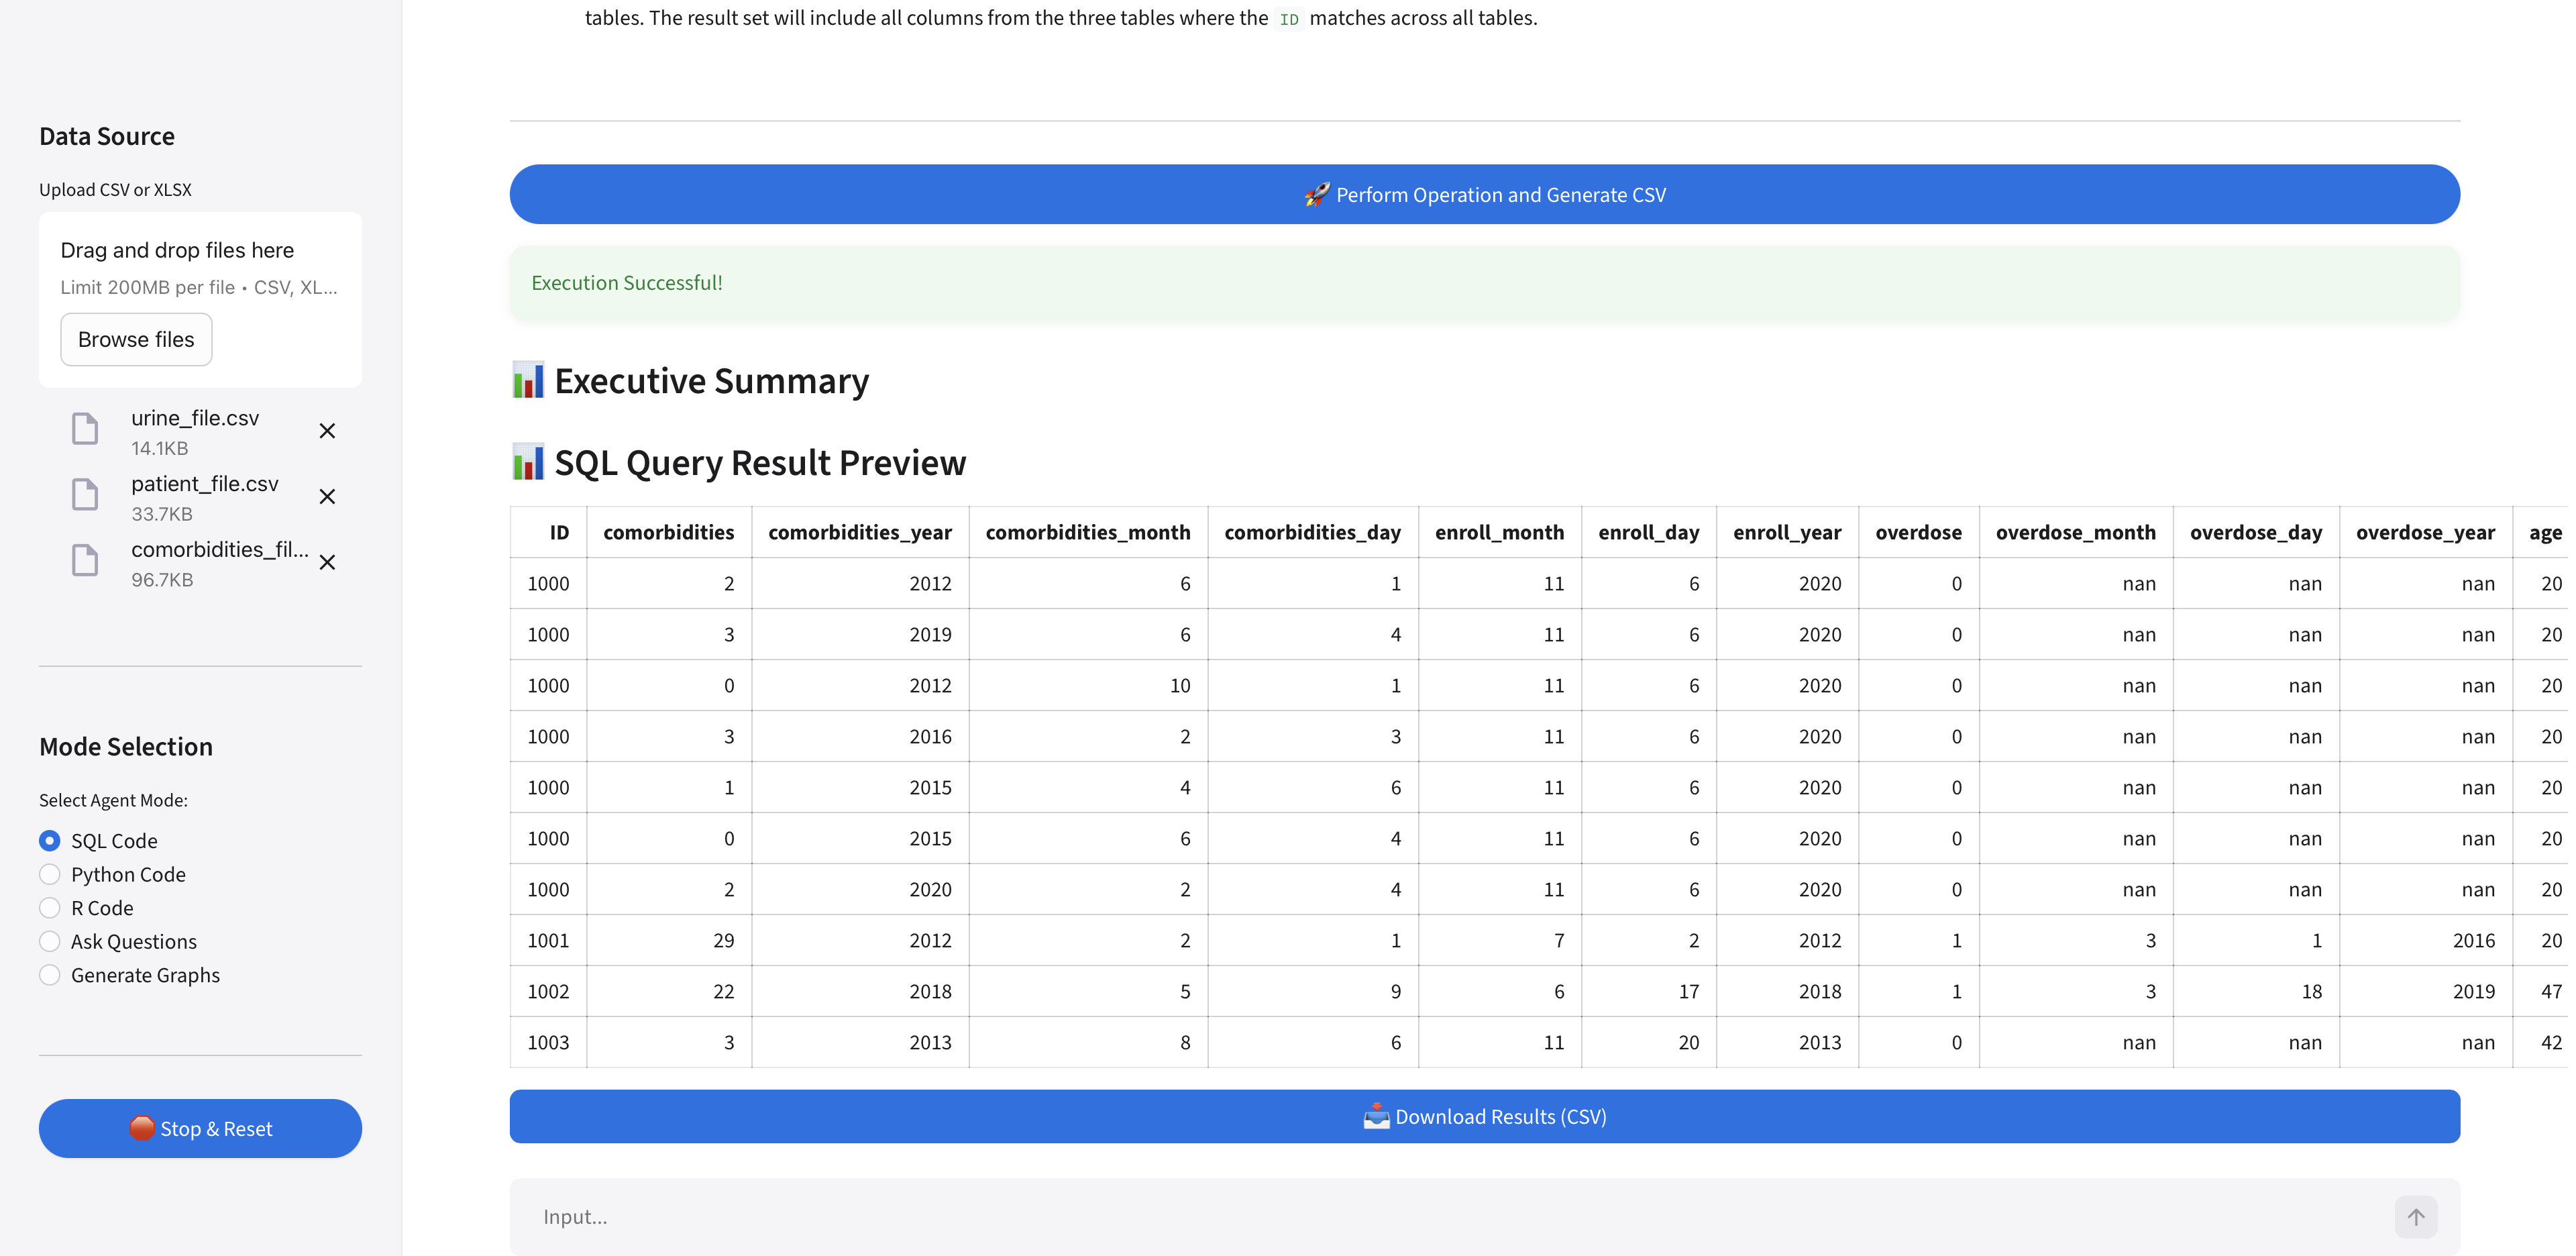
Uploaded and Joined three tables
-
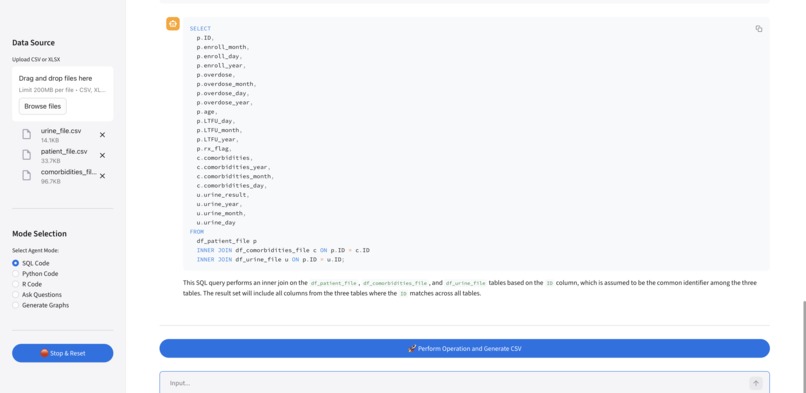
Generated SQL code
-
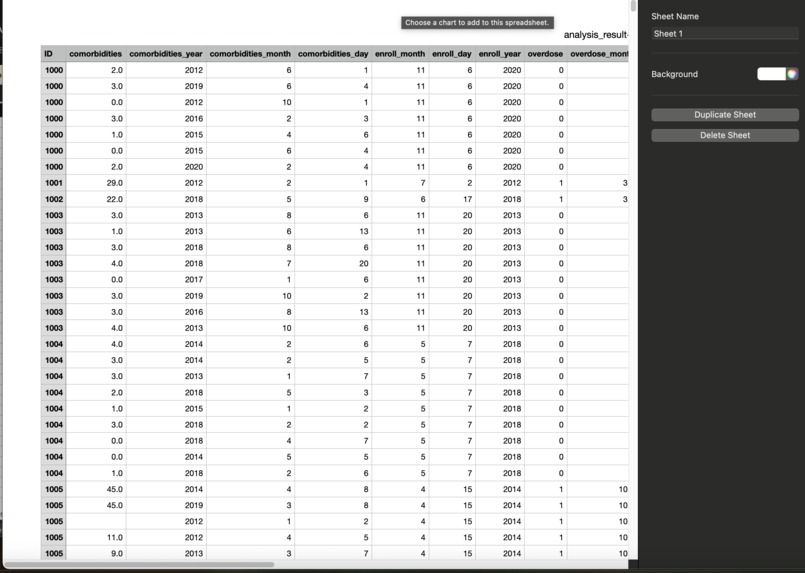
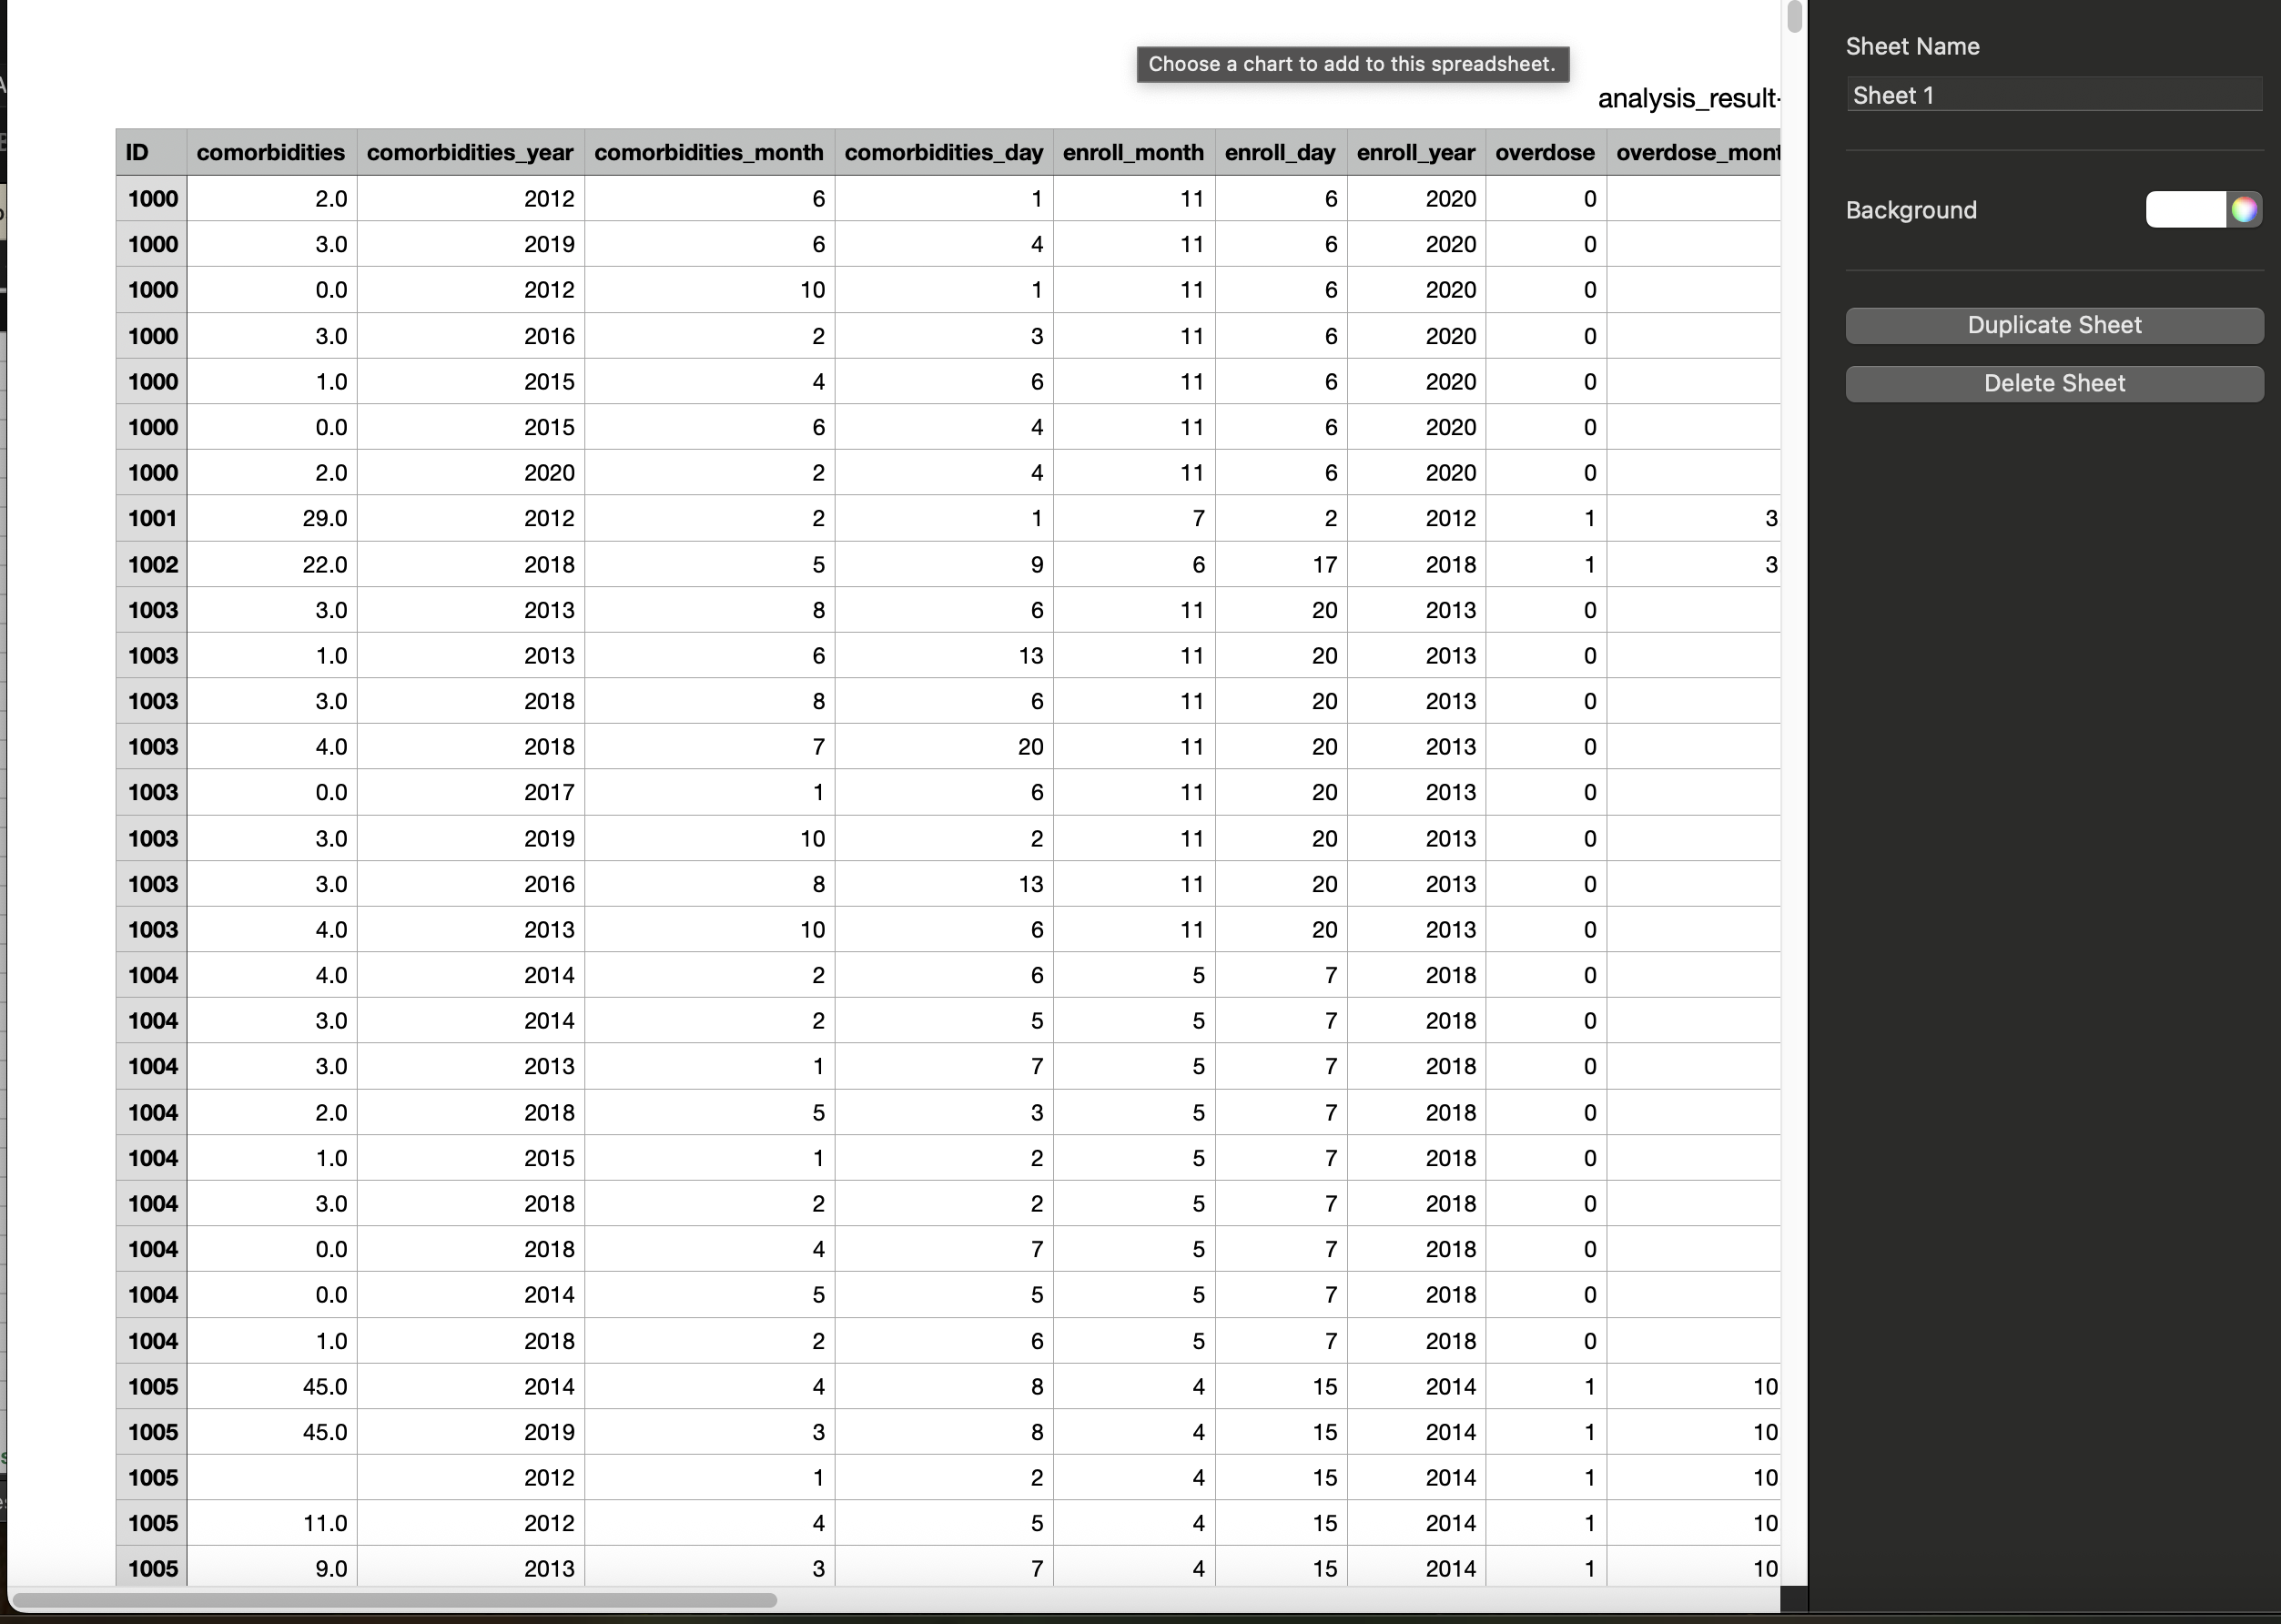
Generated CSV data of the joined table
-
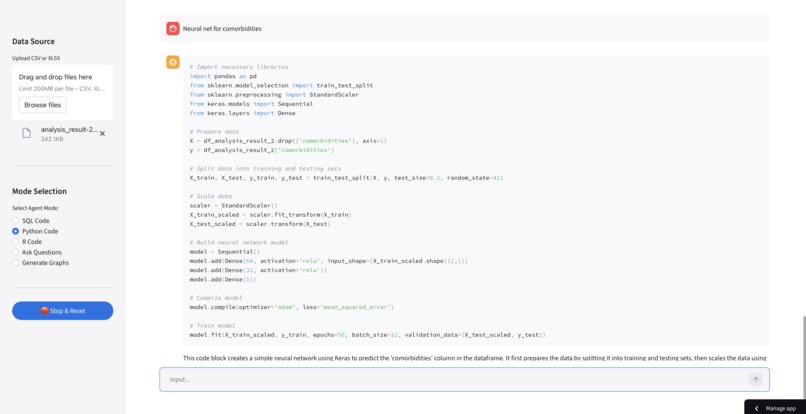
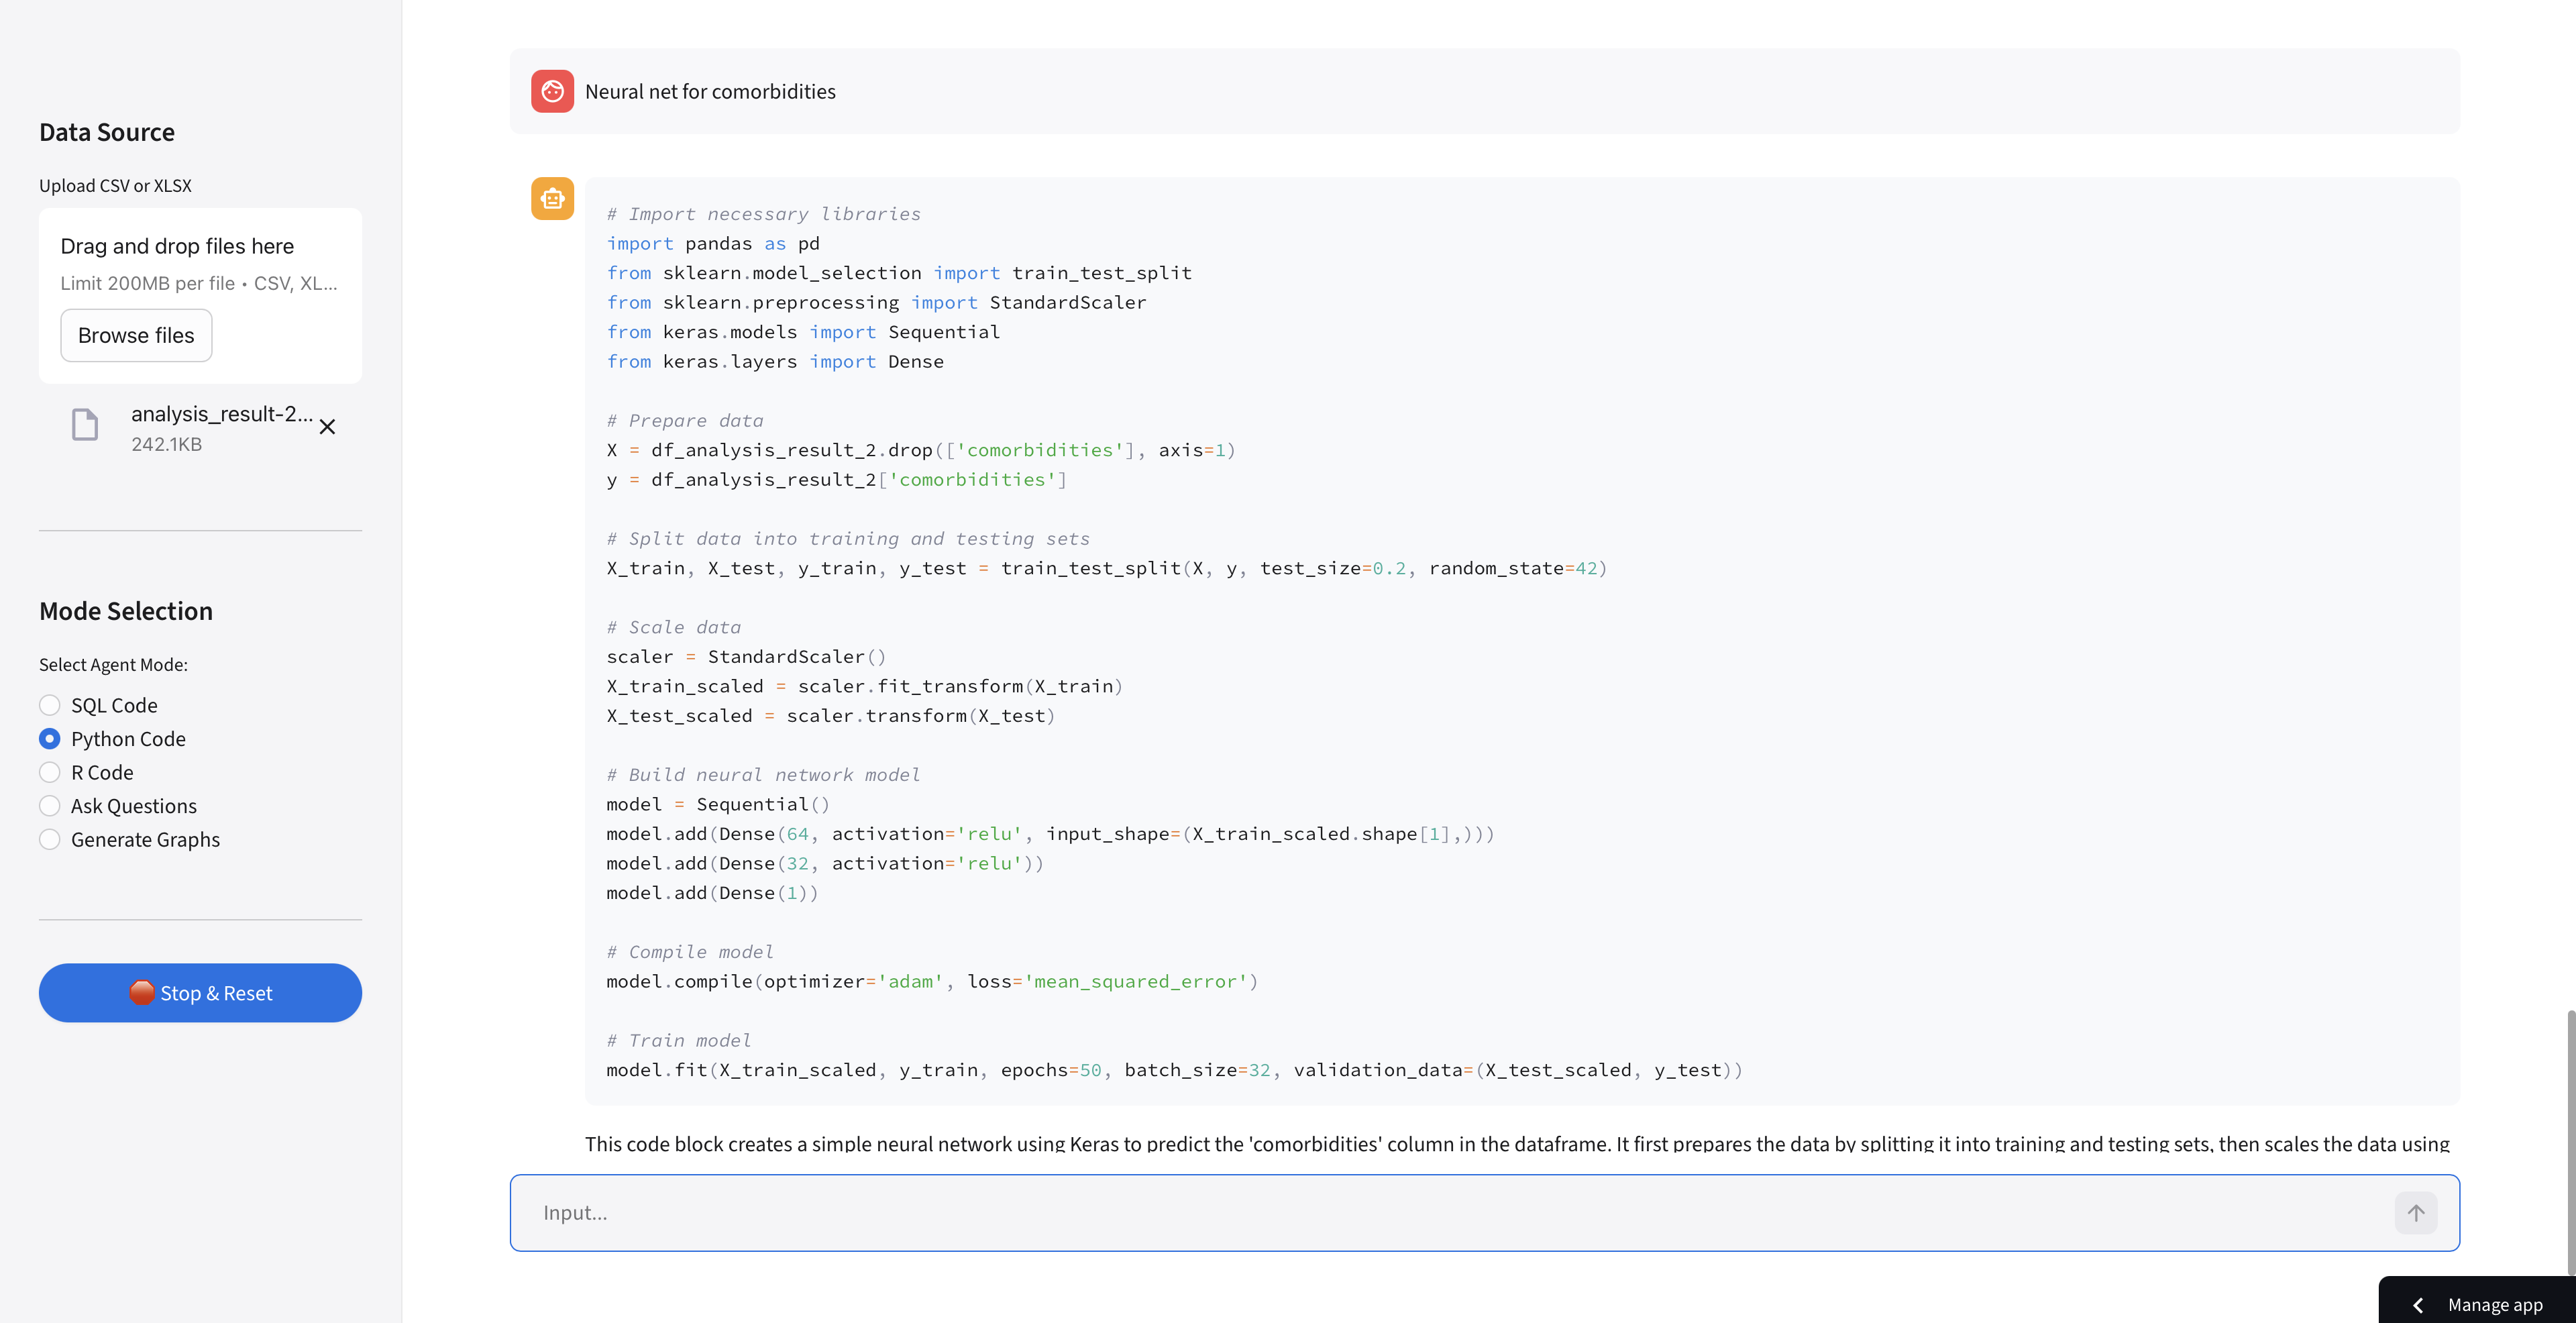
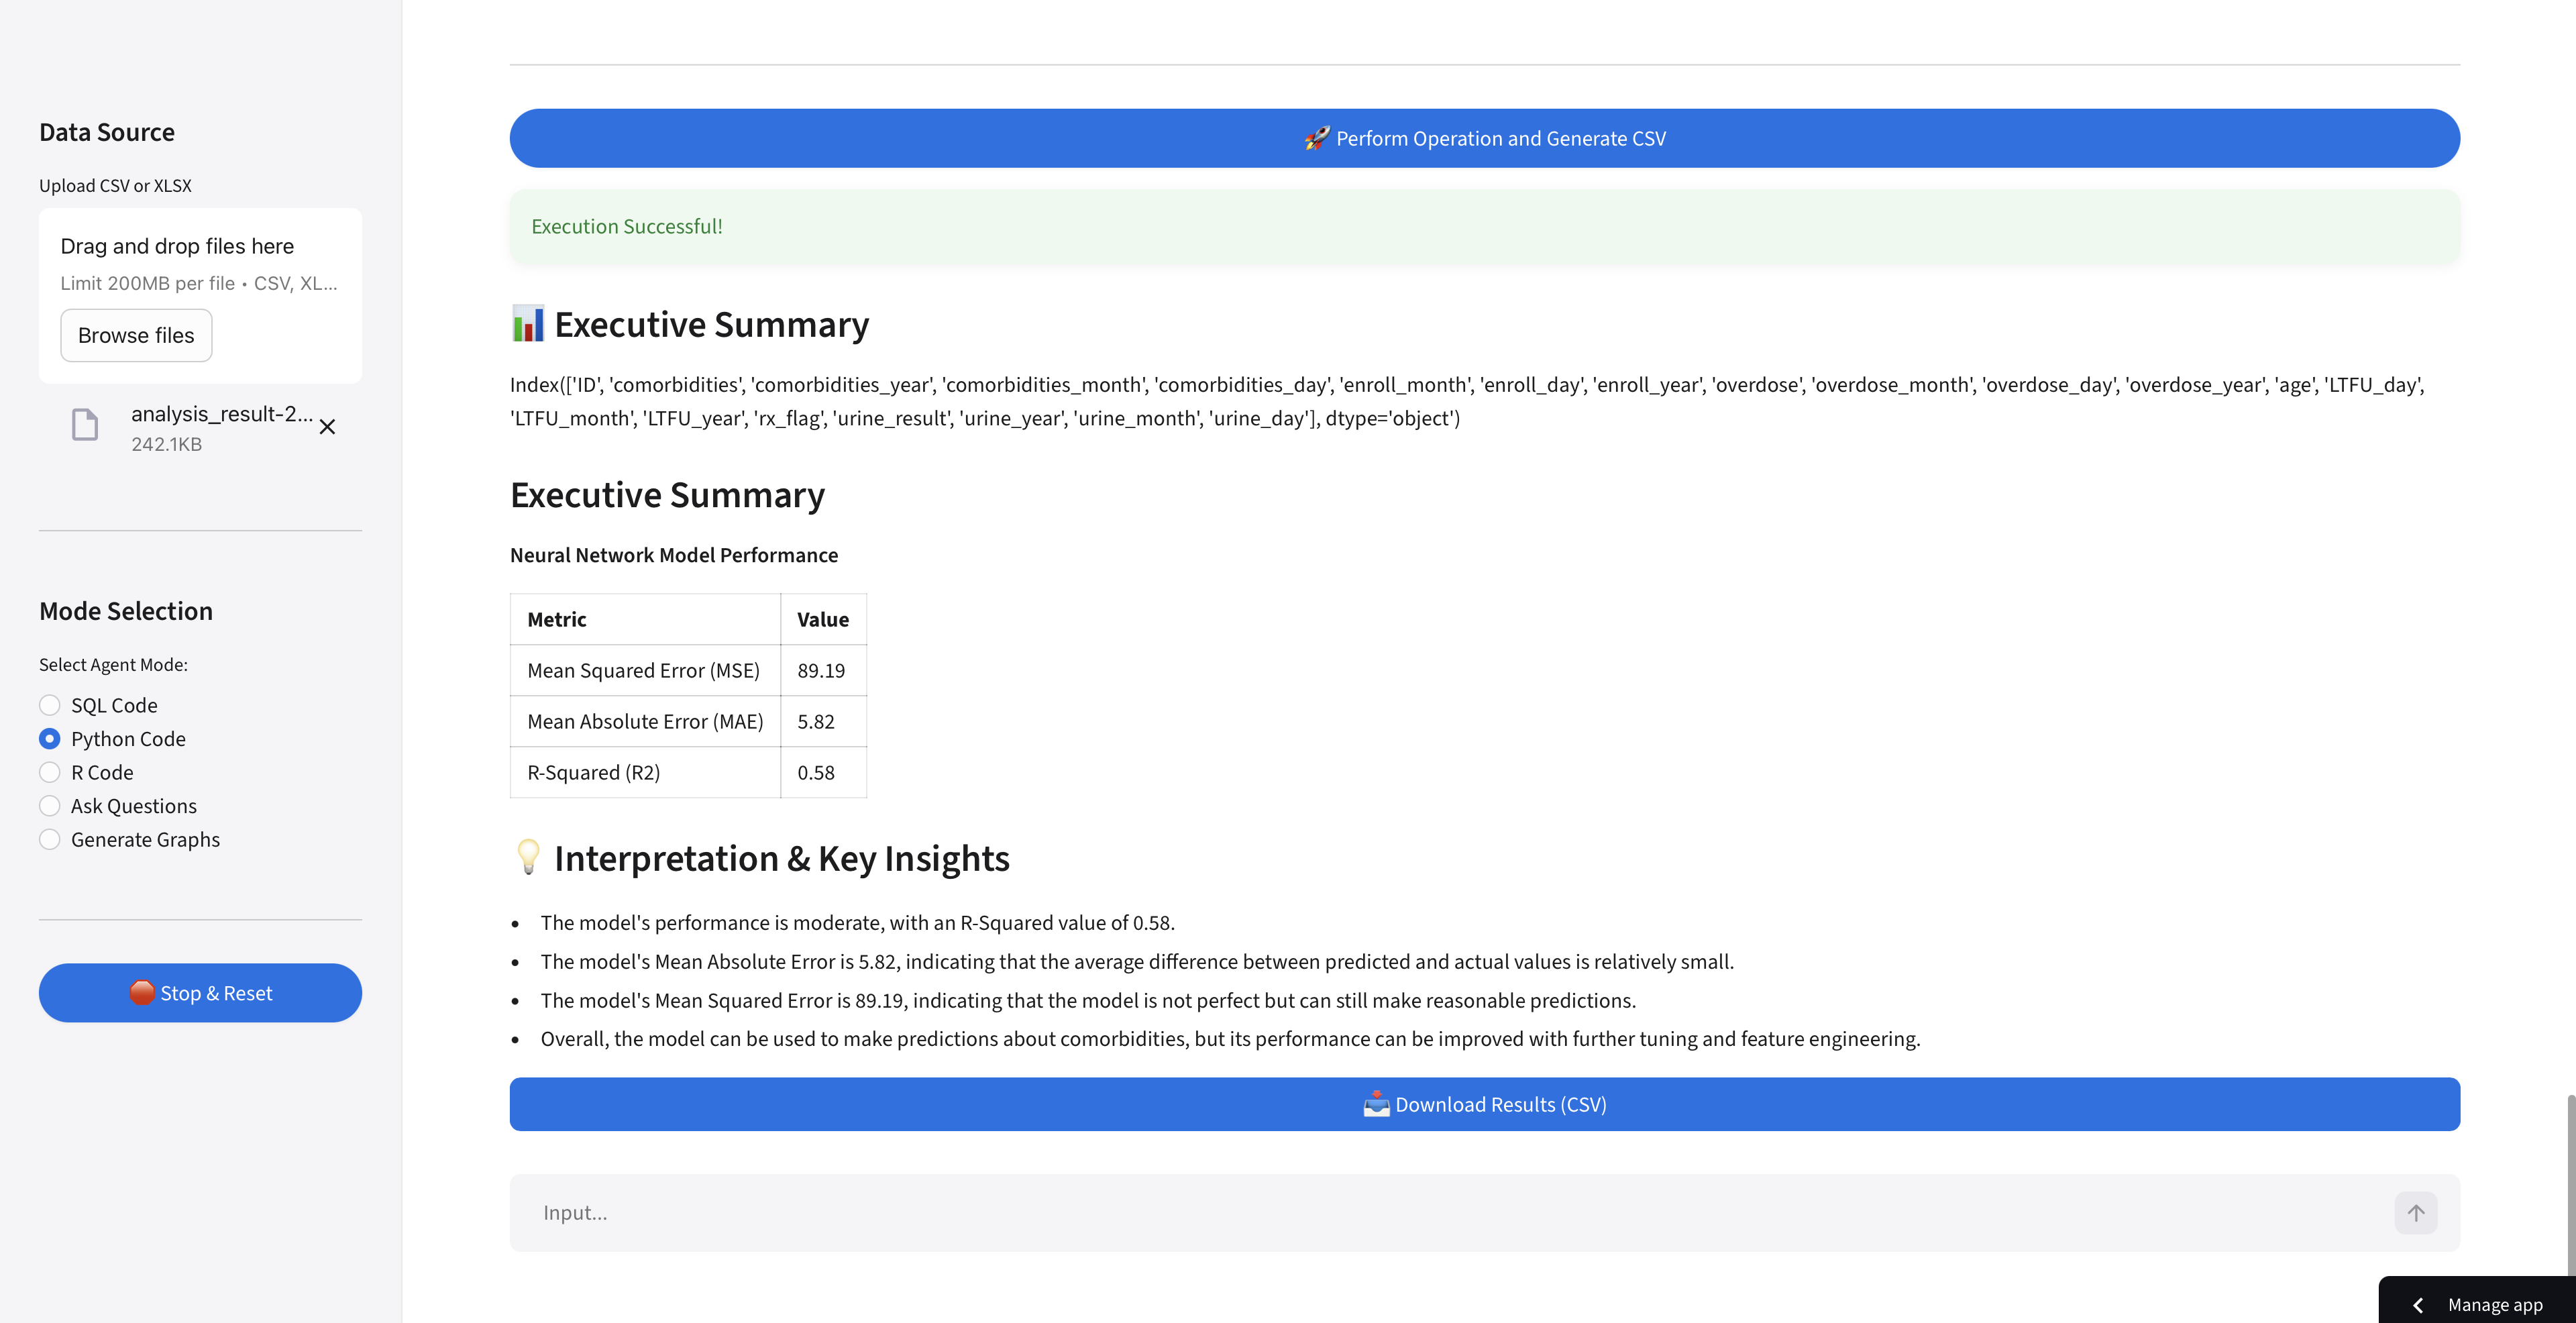
Performed Neural Network for Predicting a parameter in the table
-

Generated the result
-
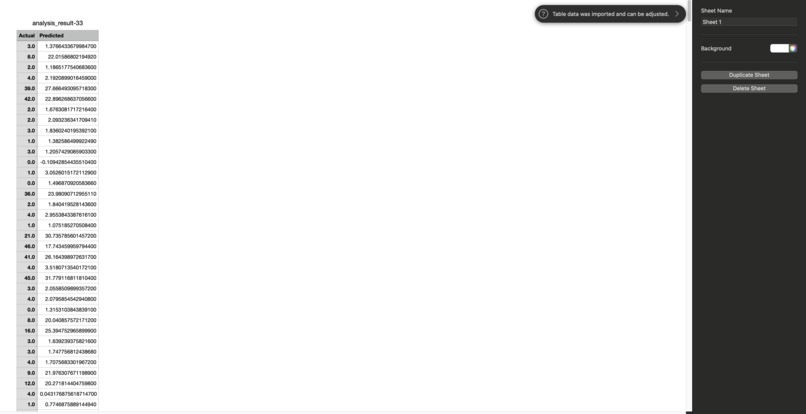
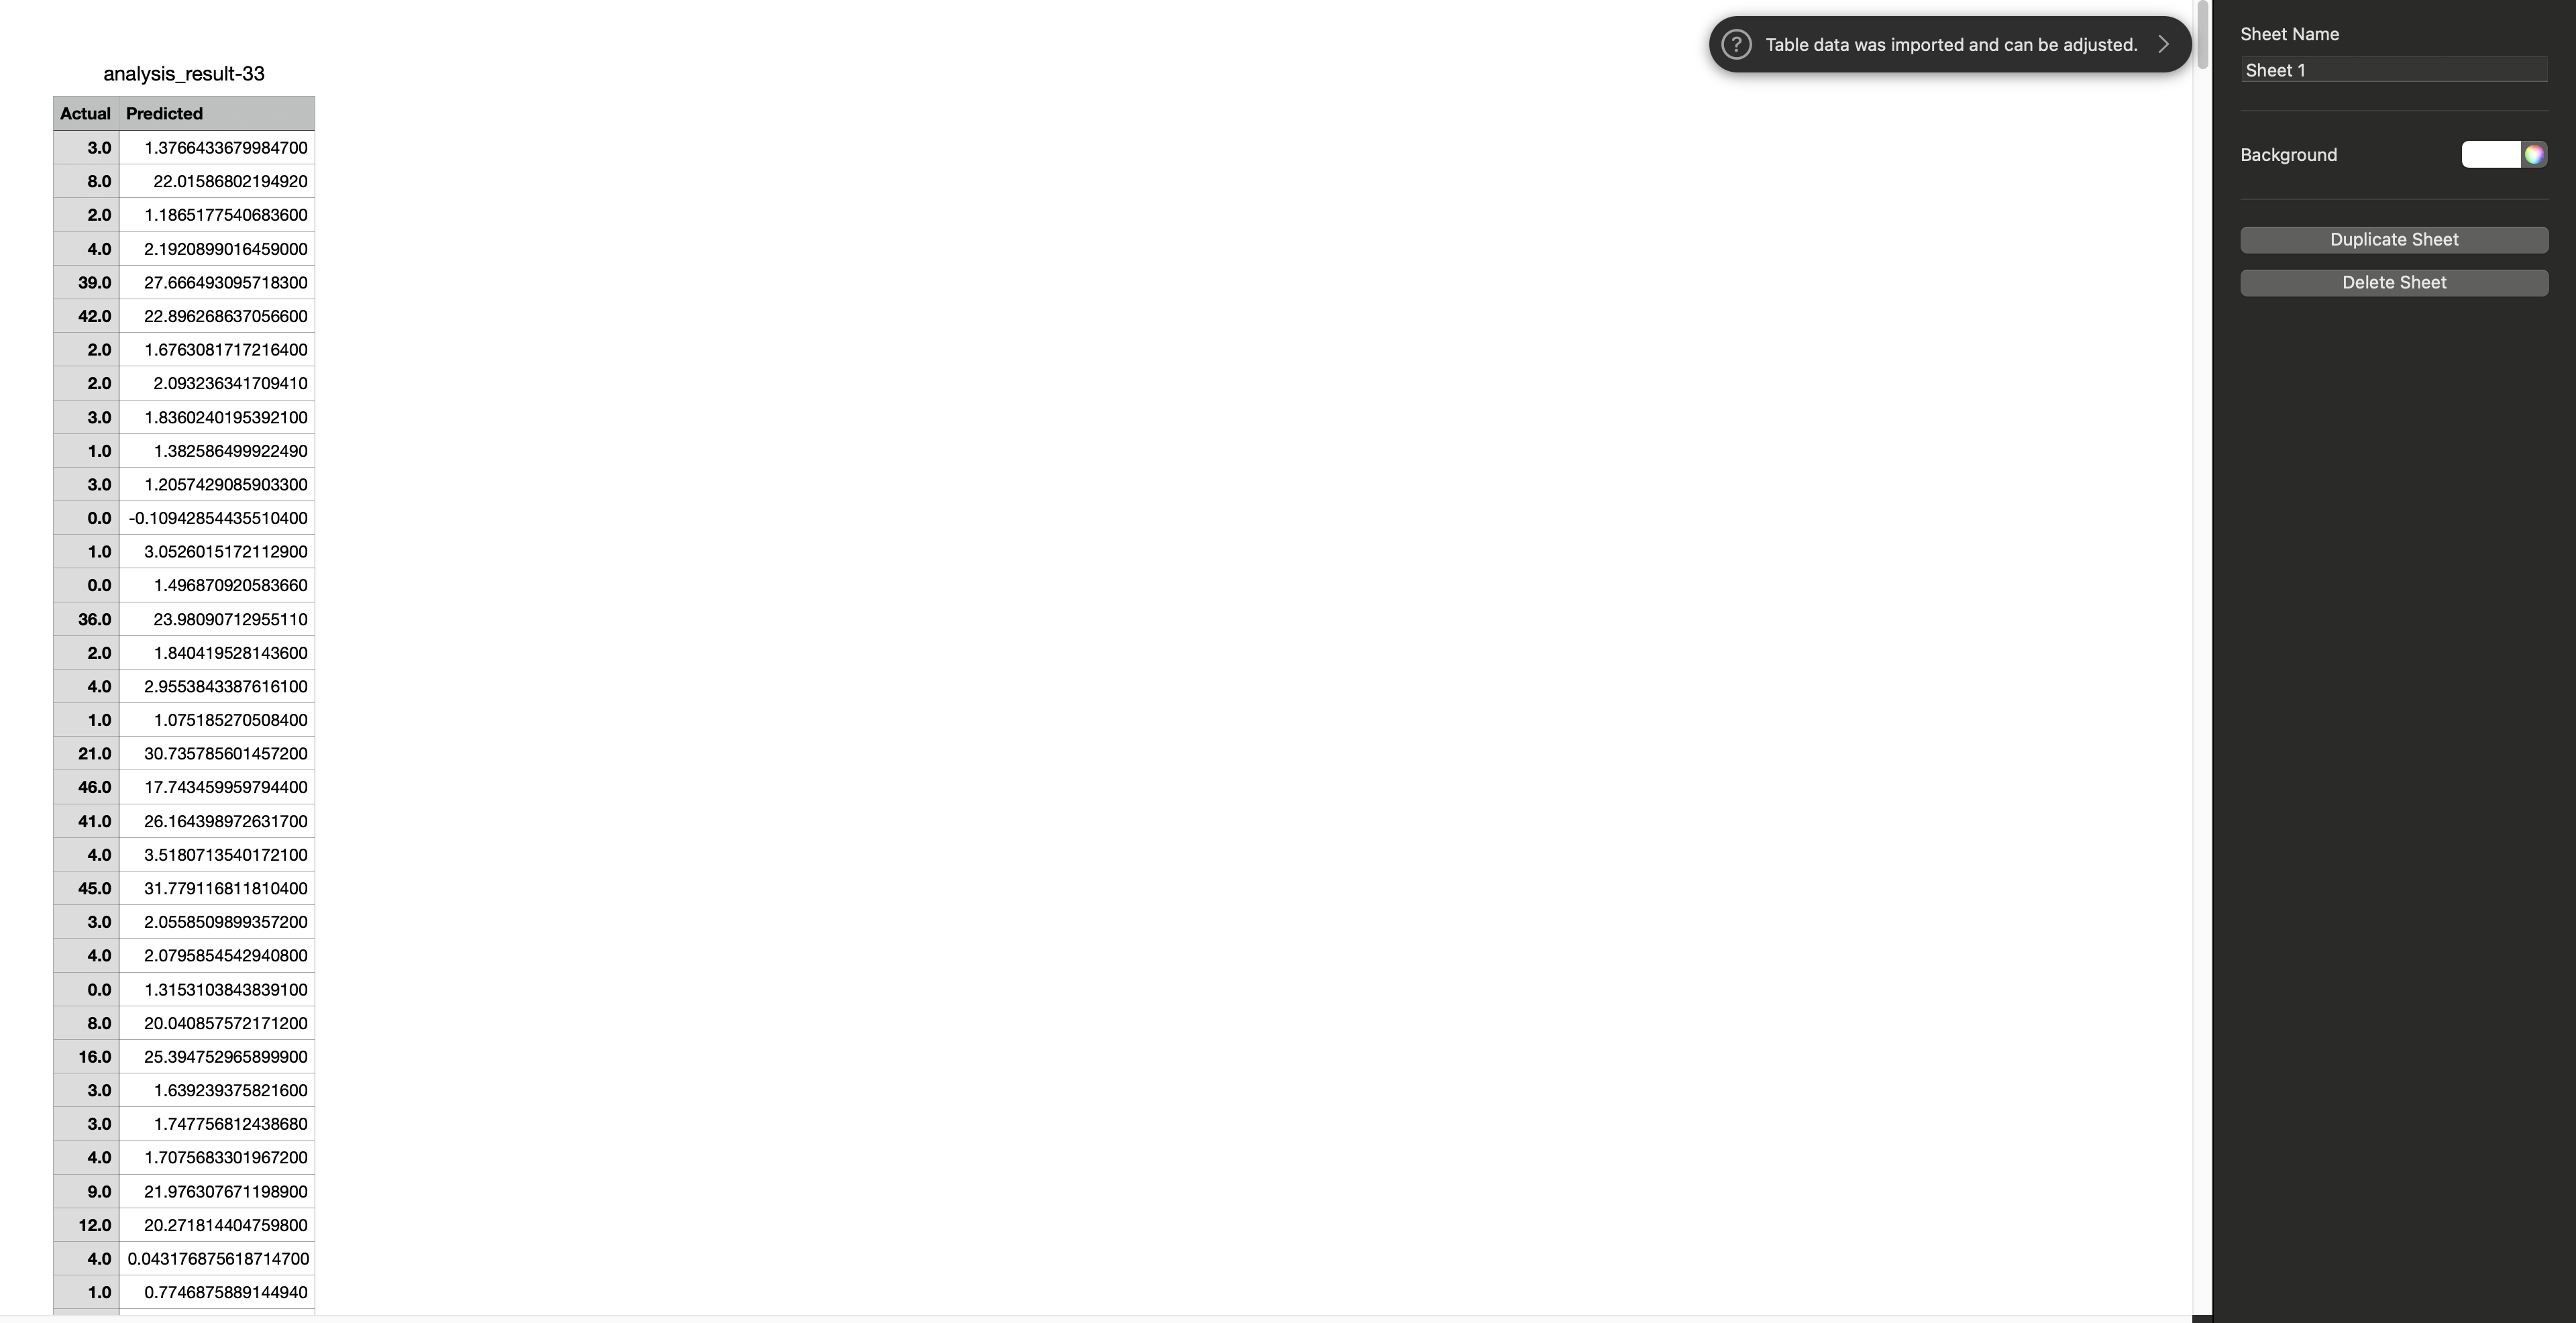
Generated CSV table of the predicted Vs. the actual value
-

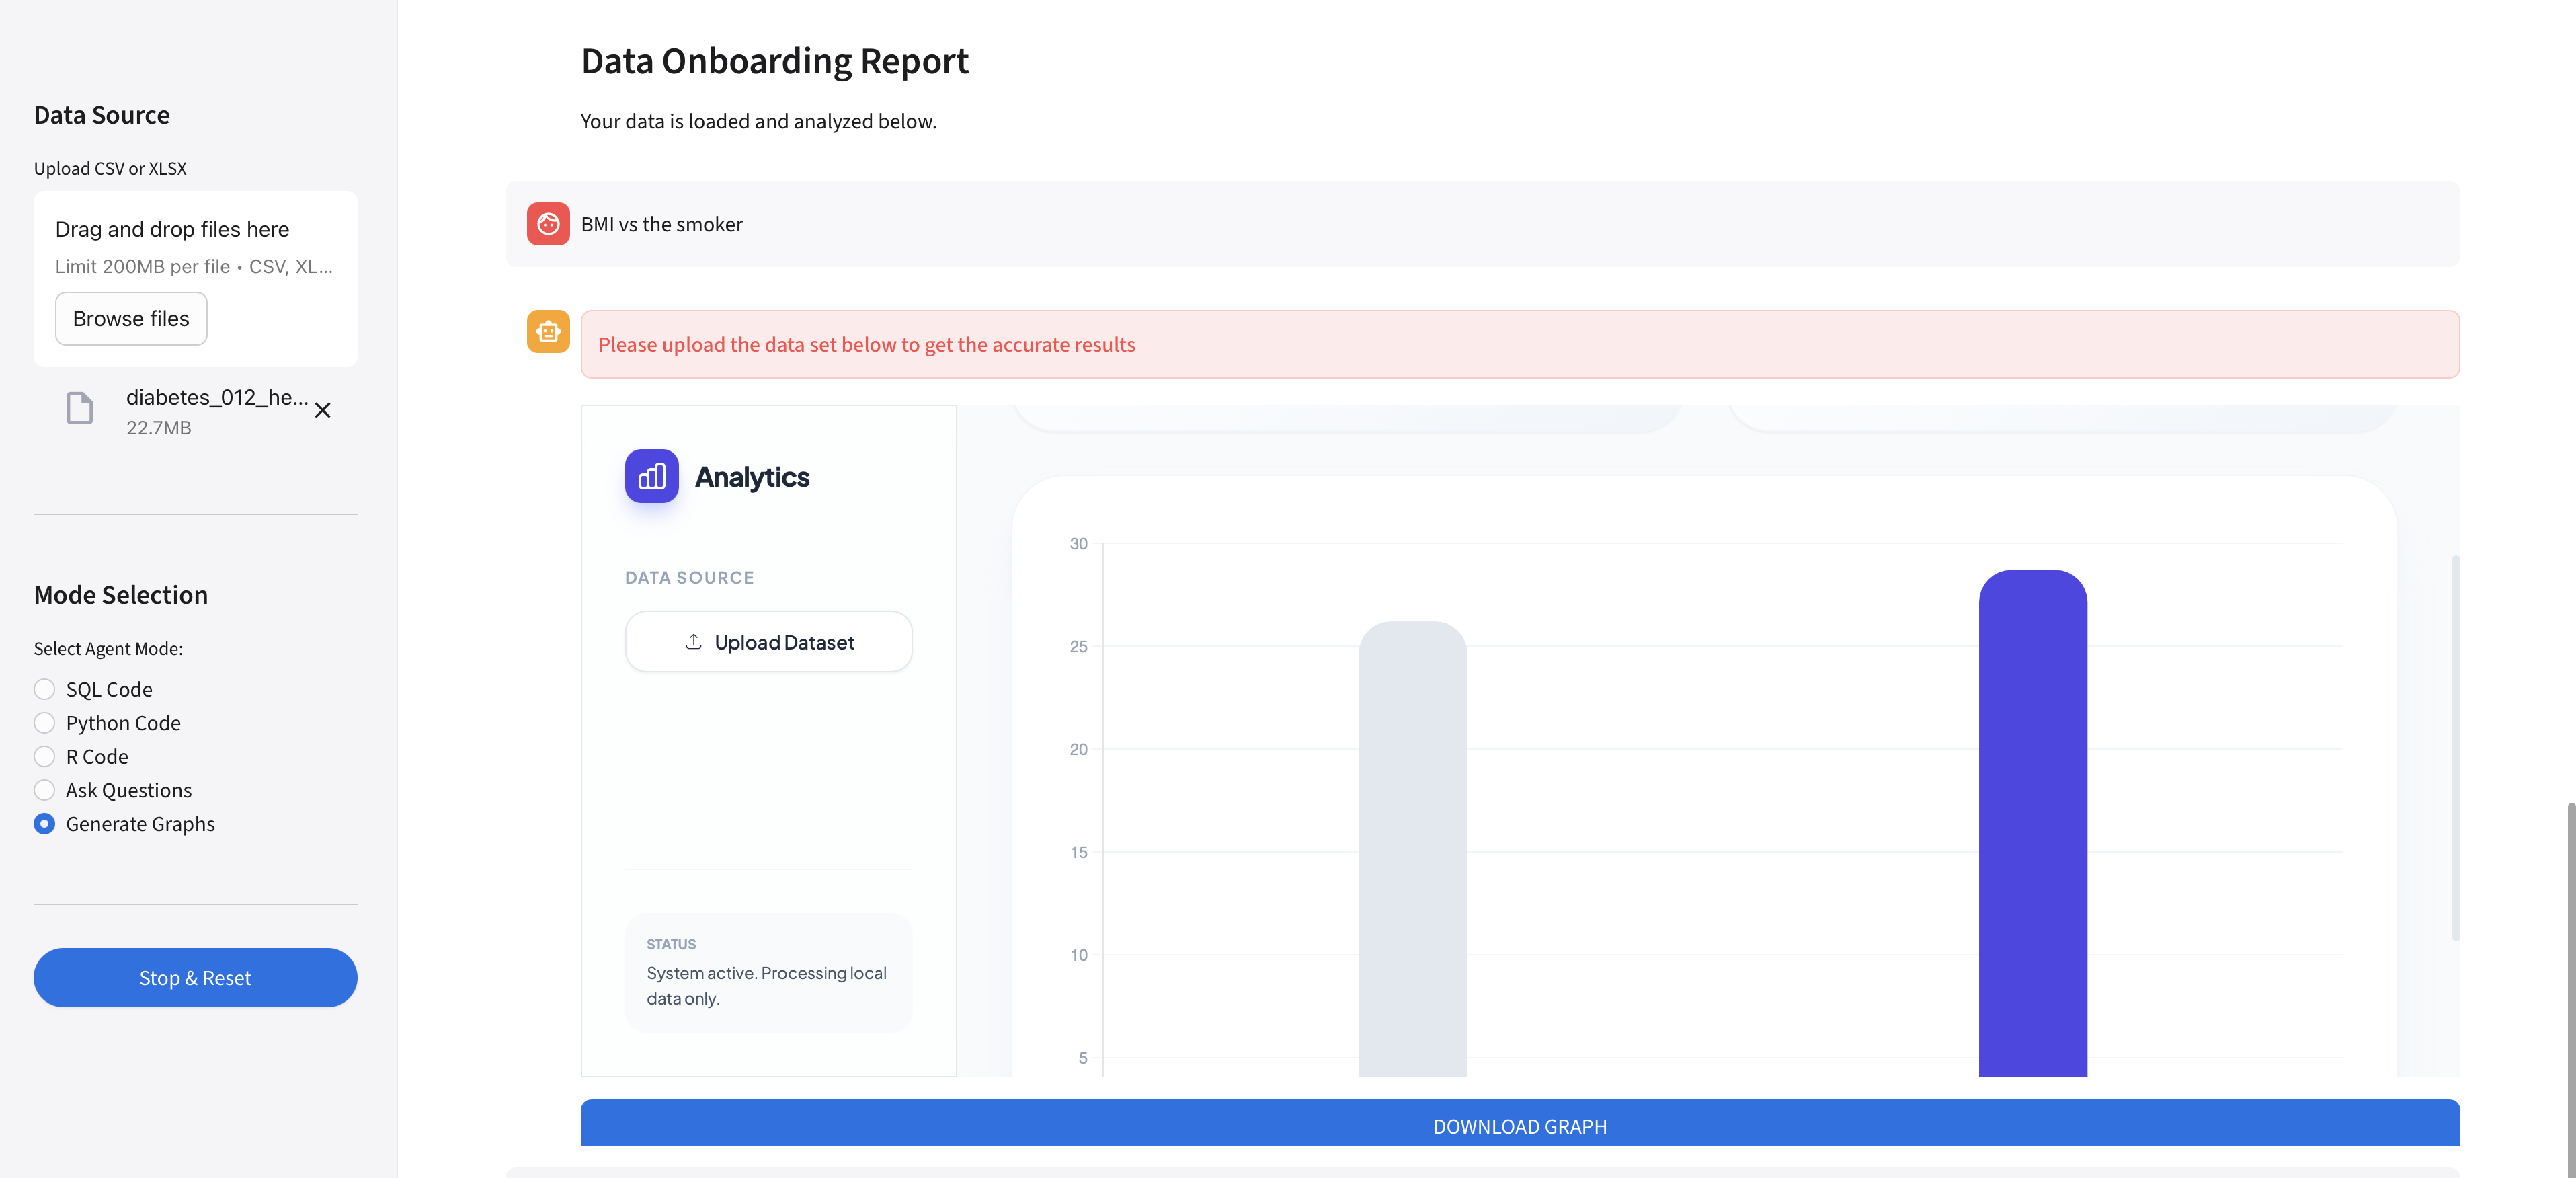
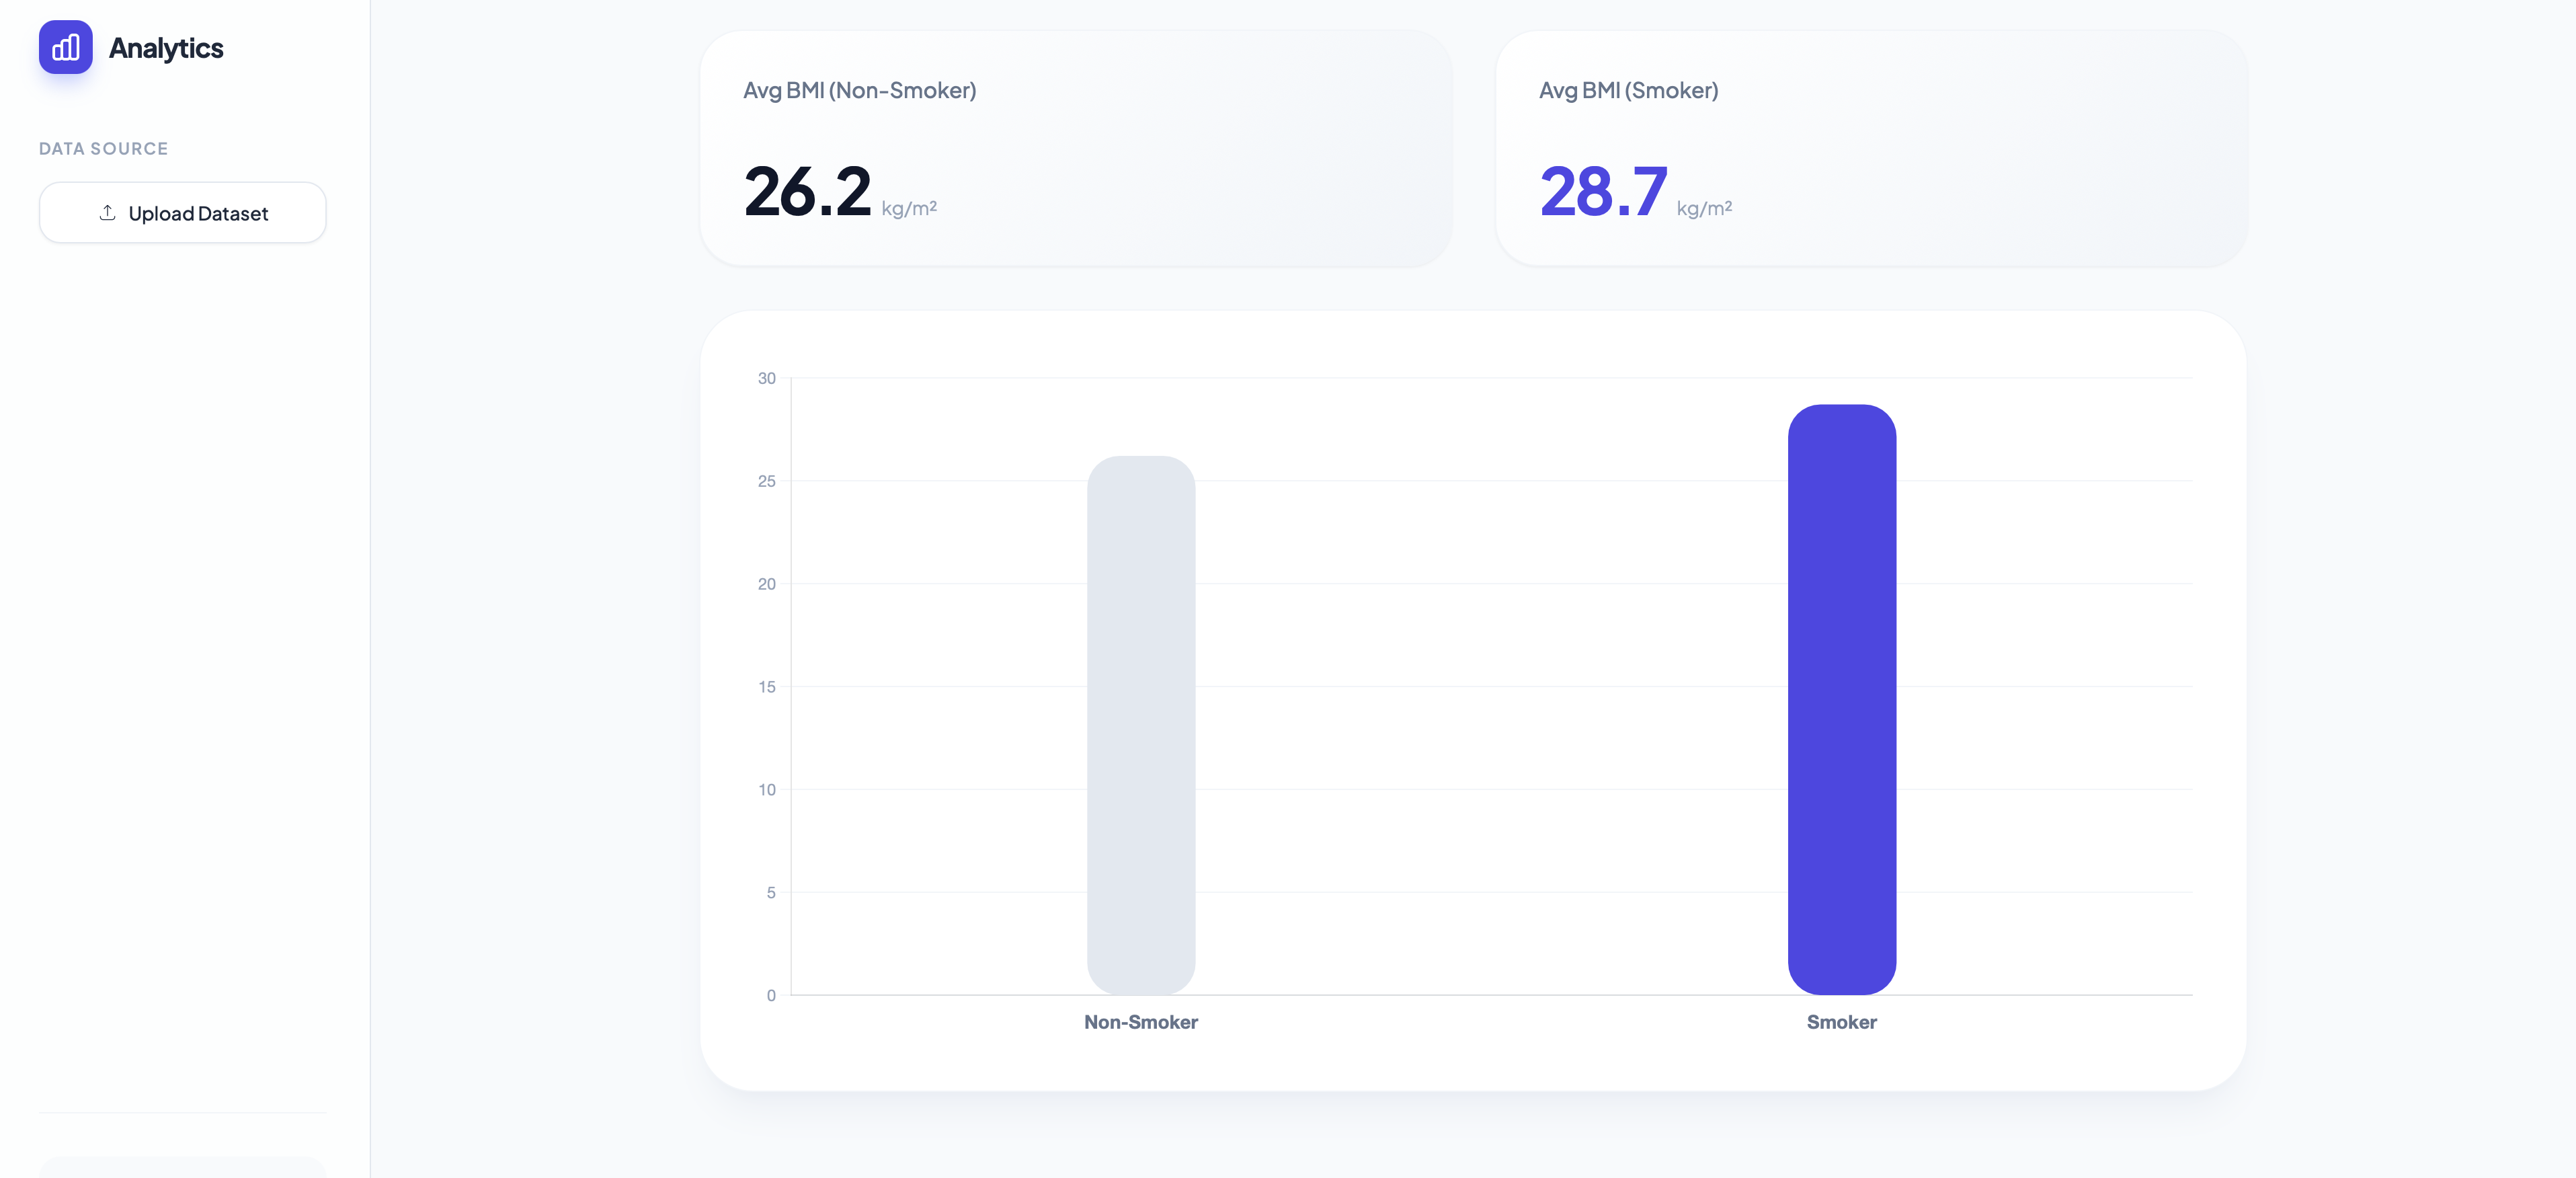
Graph Generated
-
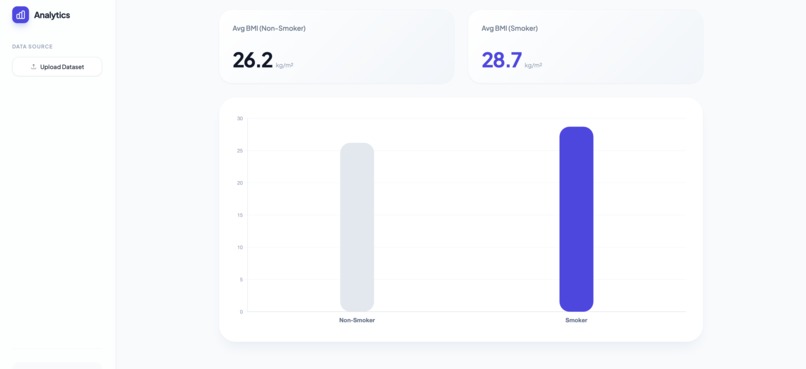
Downloaded Graph And uploaded the dataset

I built the Data Analysis Agent because I was fed up with the "data headache"—that exhausting cycle of jumping between SQL for queries, Python for modeling, and PowerPoint for charts. I wanted to create a single, autonomous workspace that handles the heavy lifting while actually "speaking human" to stakeholders. Using a ReAct-based framework and a strict 3-step visualization pipeline, I made sure the agent doesn't just hallucinate charts but backs them with precise SQL logic. The hardest part was keeping the data "alive" across different languages, but now you can move from a SQL join to an XGBoost model without losing a single row. I’m most proud of the "Layman" engine; it’s one thing to calculate a complex metric, but it’s another to have an AI explain it in plain English for an executive. This project taught me that for AI to be useful in data, precision and trust are everything. Moving forward, I’m planning to scale this with direct BigQuery integration and a voice-activated "live deck" mode.
Built With
- lightgbm
- matplotlib
- numpy
- openpyxl
- orchestration:-langchain-(react-framework)
- python-dotenv-api-gateway:-openrouter-(unified-interface-for-llm-calls)-primary-brain:-gemini-3-flash-(chosen-for-low-latency-coding-and-1m+-context-window)-frontend-&-ui:-streamlit-data-processing:-pandas
- rapidfuzz-machine-learning-&-stats:-xgboost
- scikit-learn
- seaborn
- statsmodels-visualization:-plotly
- tabulate

Log in or sign up for Devpost to join the conversation.