
Inspiration
Our inspiration for this business data analysis on supermarket sales came from the need to understand customer behavior and optimize sales strategies.
What it does
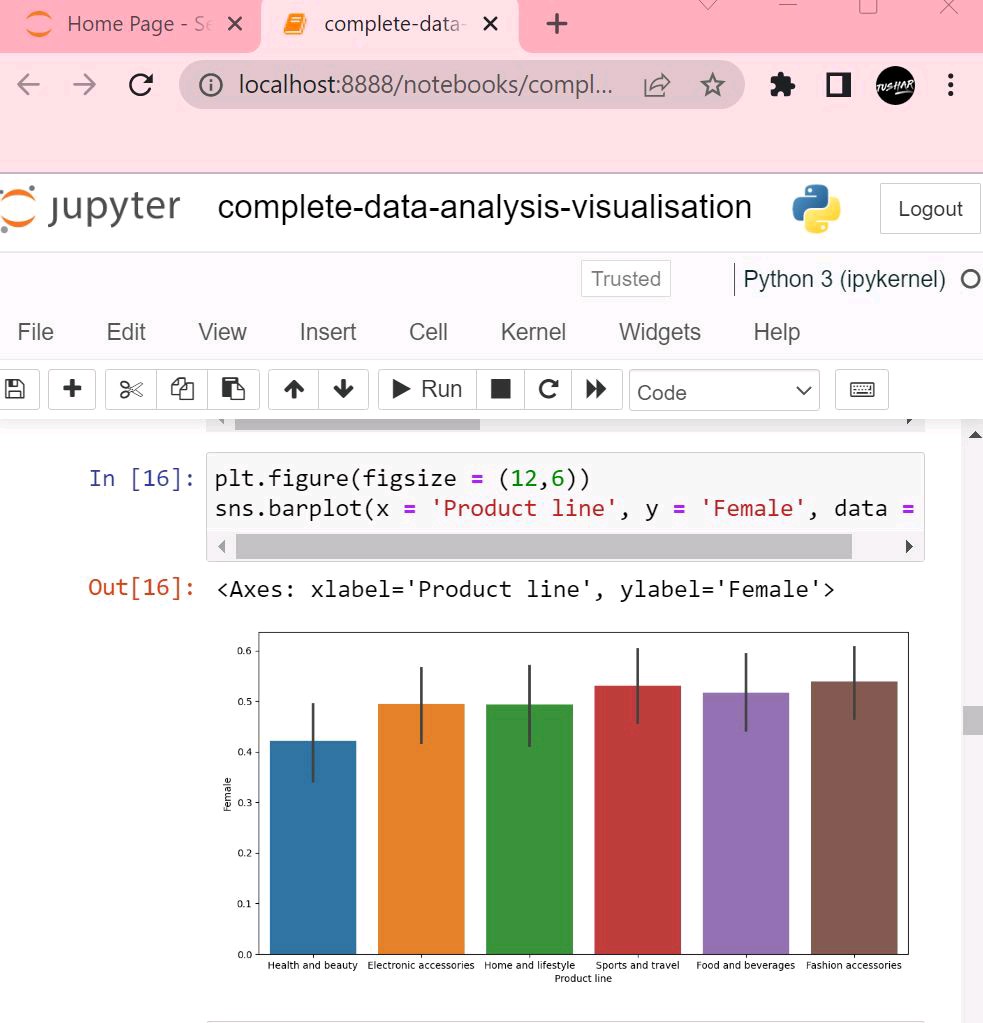
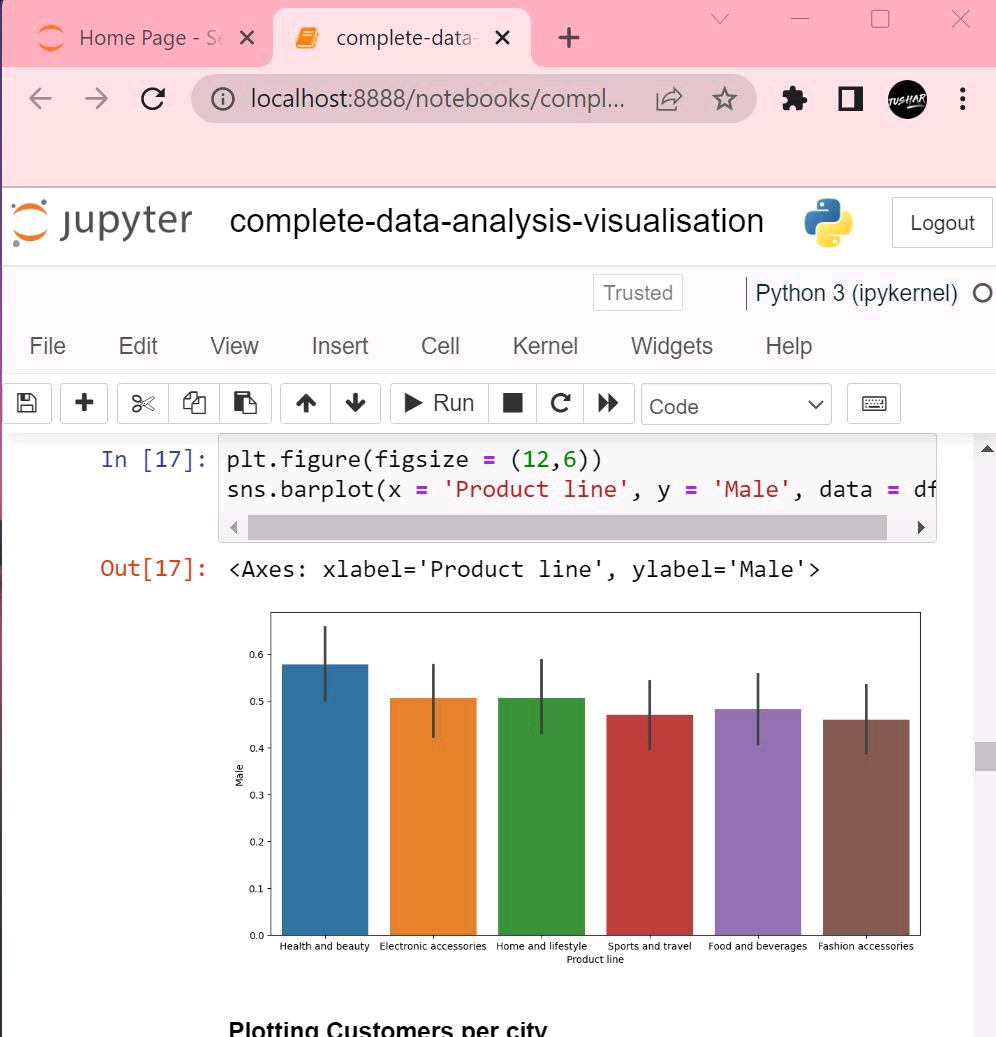
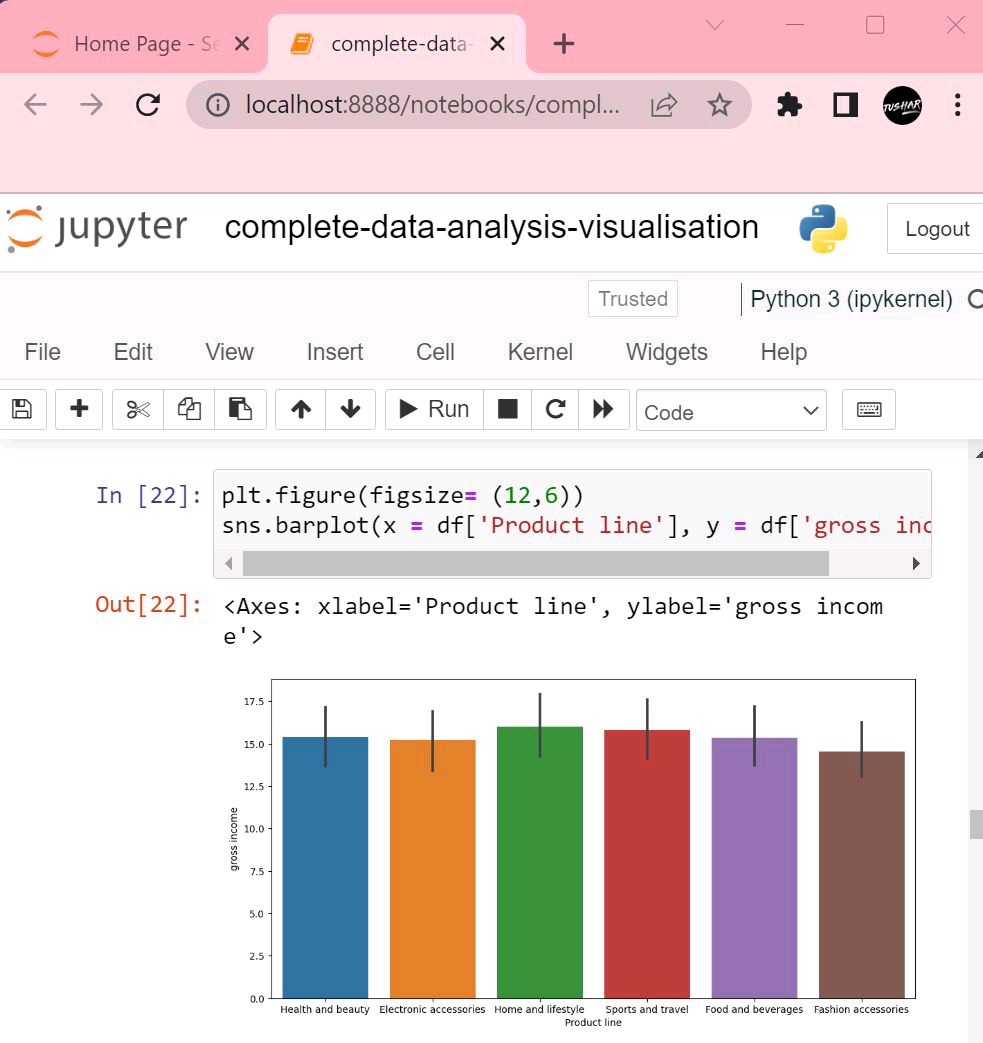
The data analysis focuses on extracting meaningful insights from supermarket sales data, including customer preferences, popular products, and sales trends.
How we built it
We built the data analysis using various tools and techniques, such as Python, Pandas, and visualization libraries like Matplotlib. We collected and cleaned the sales data, performed statistical analysis, and created visualizations to present the findings.
Challenges we ran into
During the project, we faced challenges with data quality, handling large datasets, and selecting the appropriate analysis methods to extract valuable insights.
Accomplishments that we're proud of
We are proud of successfully uncovering actionable insights from the sales data, which led to improved decision-making and increased sales for the supermarket.
What we learned
Through this project, we gained a deeper understanding of data analysis techniques, data visualization, and the importance of accurate data for making informed business decisions.
What's next for Data Analysis
Moving forward, we plan to further enhance the data analysis by incorporating machine learning algorithms to predict customer preferences and explore advanced data visualization techniques for better presentations. Additionally, we aim to expand the analysis to include other aspects of the supermarket's operations, such as inventory management and supply chain optimization.

Log in or sign up for Devpost to join the conversation.