-
-
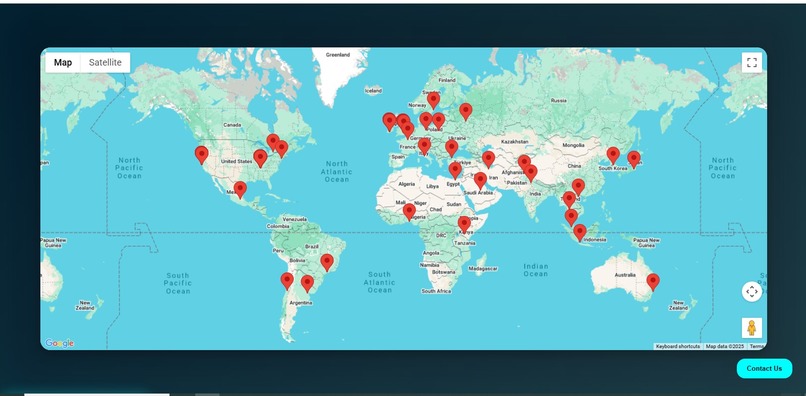
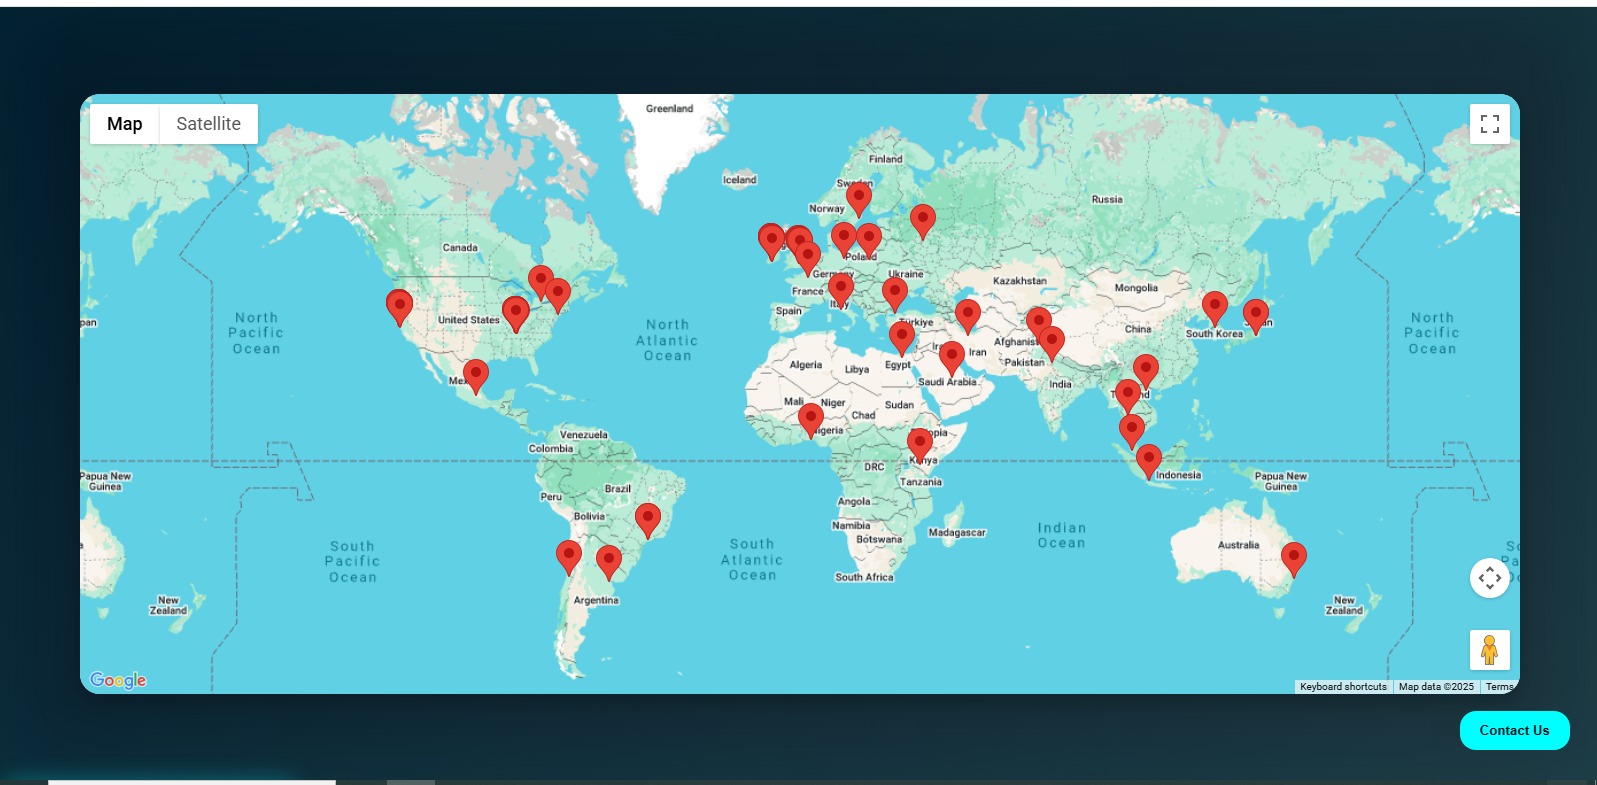
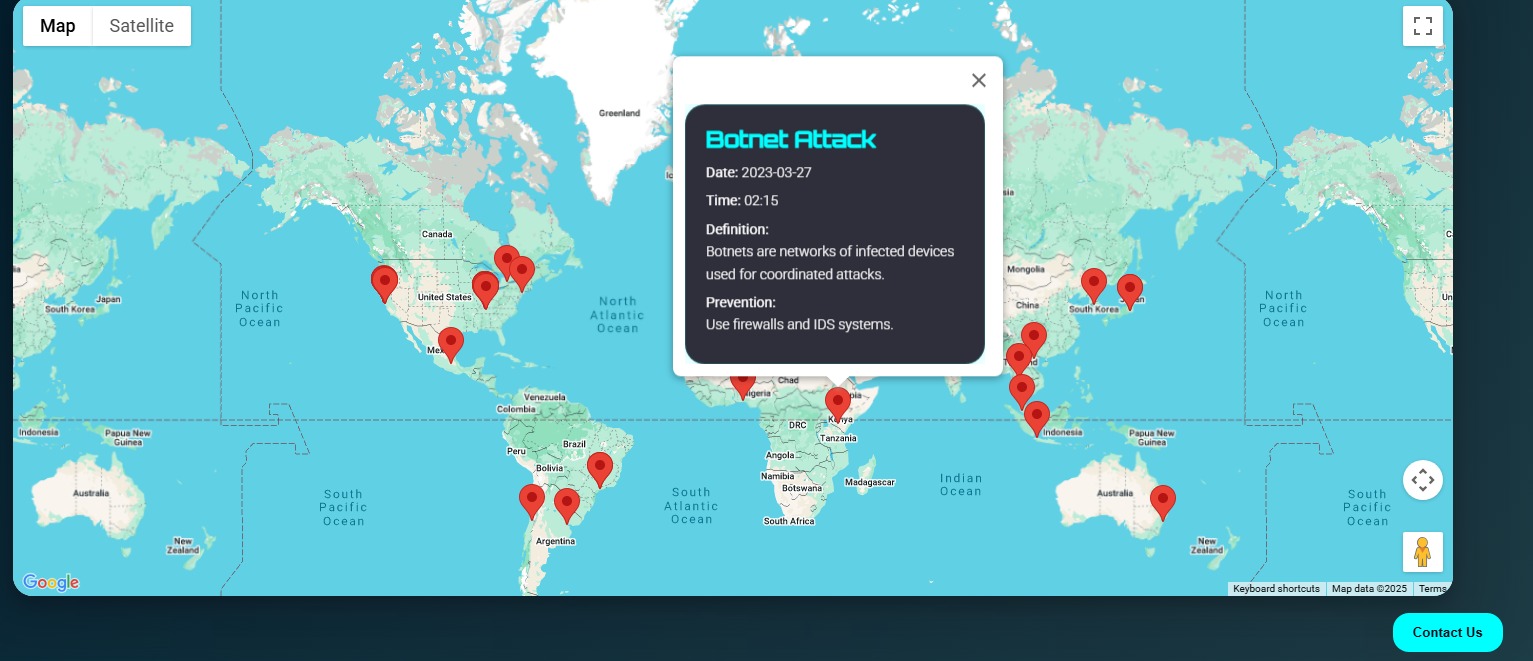
Live map displaying global cyberattack incidents with dynamically rendered markers.
-

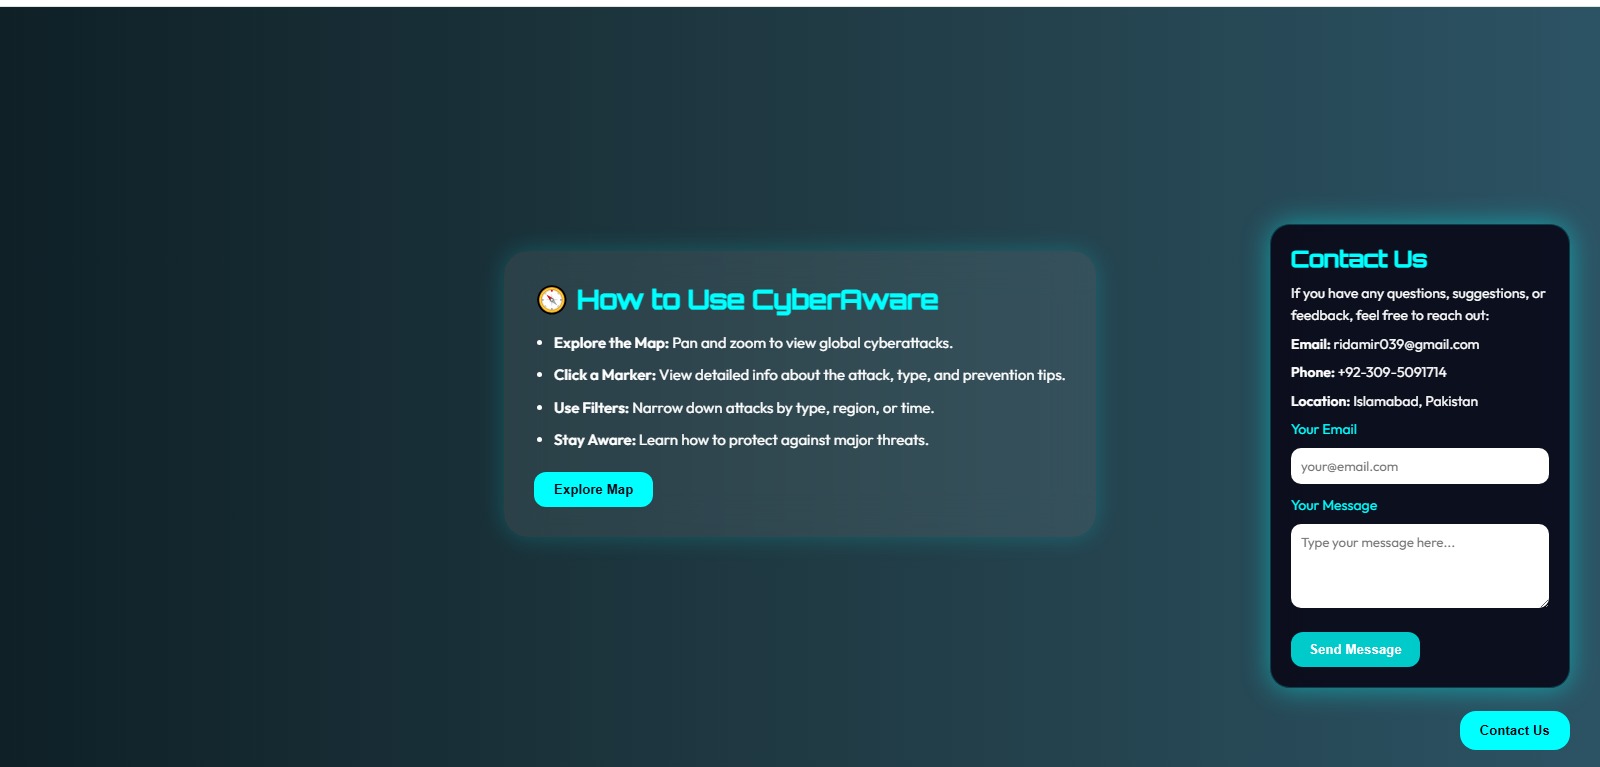
Interactive CyberAware homepage featuring a custom welcome animation and intuitive UI design.
-
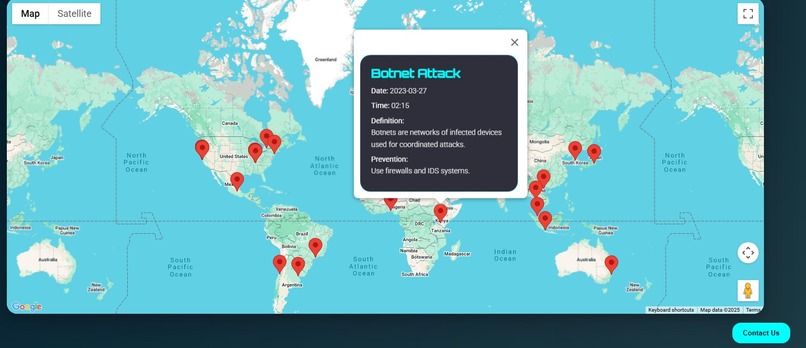
Informative playcards showcasing cyberattack definitions and prevention tips, styled with glassmorphism
Inspiration :
Cybersecurity attacks are rapidly increasing in scale and complexity, affecting users, businesses, and governments globally. We built Cyber-Aware to visualize these threats on a world map and raise awareness through an engaging, educational interface that shows real-world cyberattacks, their impact, and how to defend against them.
What it does:
Cyber-Aware is an interactive web-based cyberattack visualization tool that:
- Displays real-world cyberattacks on a global map
- Provides detailed definitions and security tips for each attack type
- Supports various attack types like Ransomware, DDoS, Phishing, SQL Injection, and more
- Loads of dynamic data from a curated JSON dataset of over 60 authentic attack records
- Runs entirely in the browser using Google Maps API + HTML/CSS/JavaScript
How we built it:
- Frontend: HTML5, CSS3 (glass morphism, responsive design), JavaScript (ES6+)
- APIs: Google Maps JavaScript API, Geocoding and Places API
- Data: Enhanced dataset based on real-world cybersecurity incidents.
- Deployment: GitHub Pages
Challenges we ran into:
- Verifying and structuring authentic cyberattack data
- Implementing smooth UI/UX animations using only vanilla technologies
- Ensuring accurate geolocation mapping and consistent data rendering
Accomplishments that we're proud of:
- Visualizing real-world cyber threats with educational context
- Built a highly interactive and responsive UI using glass morphism
- Fully hosted and deployed with zero dependencies
What we learned:
- API integration
- Working with complex datasets and asynchronous fetch
- Creating professional UI with custom styling and animations
- Deploying clean, production-ready projects on GitHub Pages
What's next for CyberAware Map:
- Add real-time attack feeds from threat intelligence APIs
- Implement filters (by country, type, time)
- Add mobile-first support and accessibility improvements
- Introducing educational modules or gamified content

Log in or sign up for Devpost to join the conversation.