Inspiration: The Worst Hour Has No Data
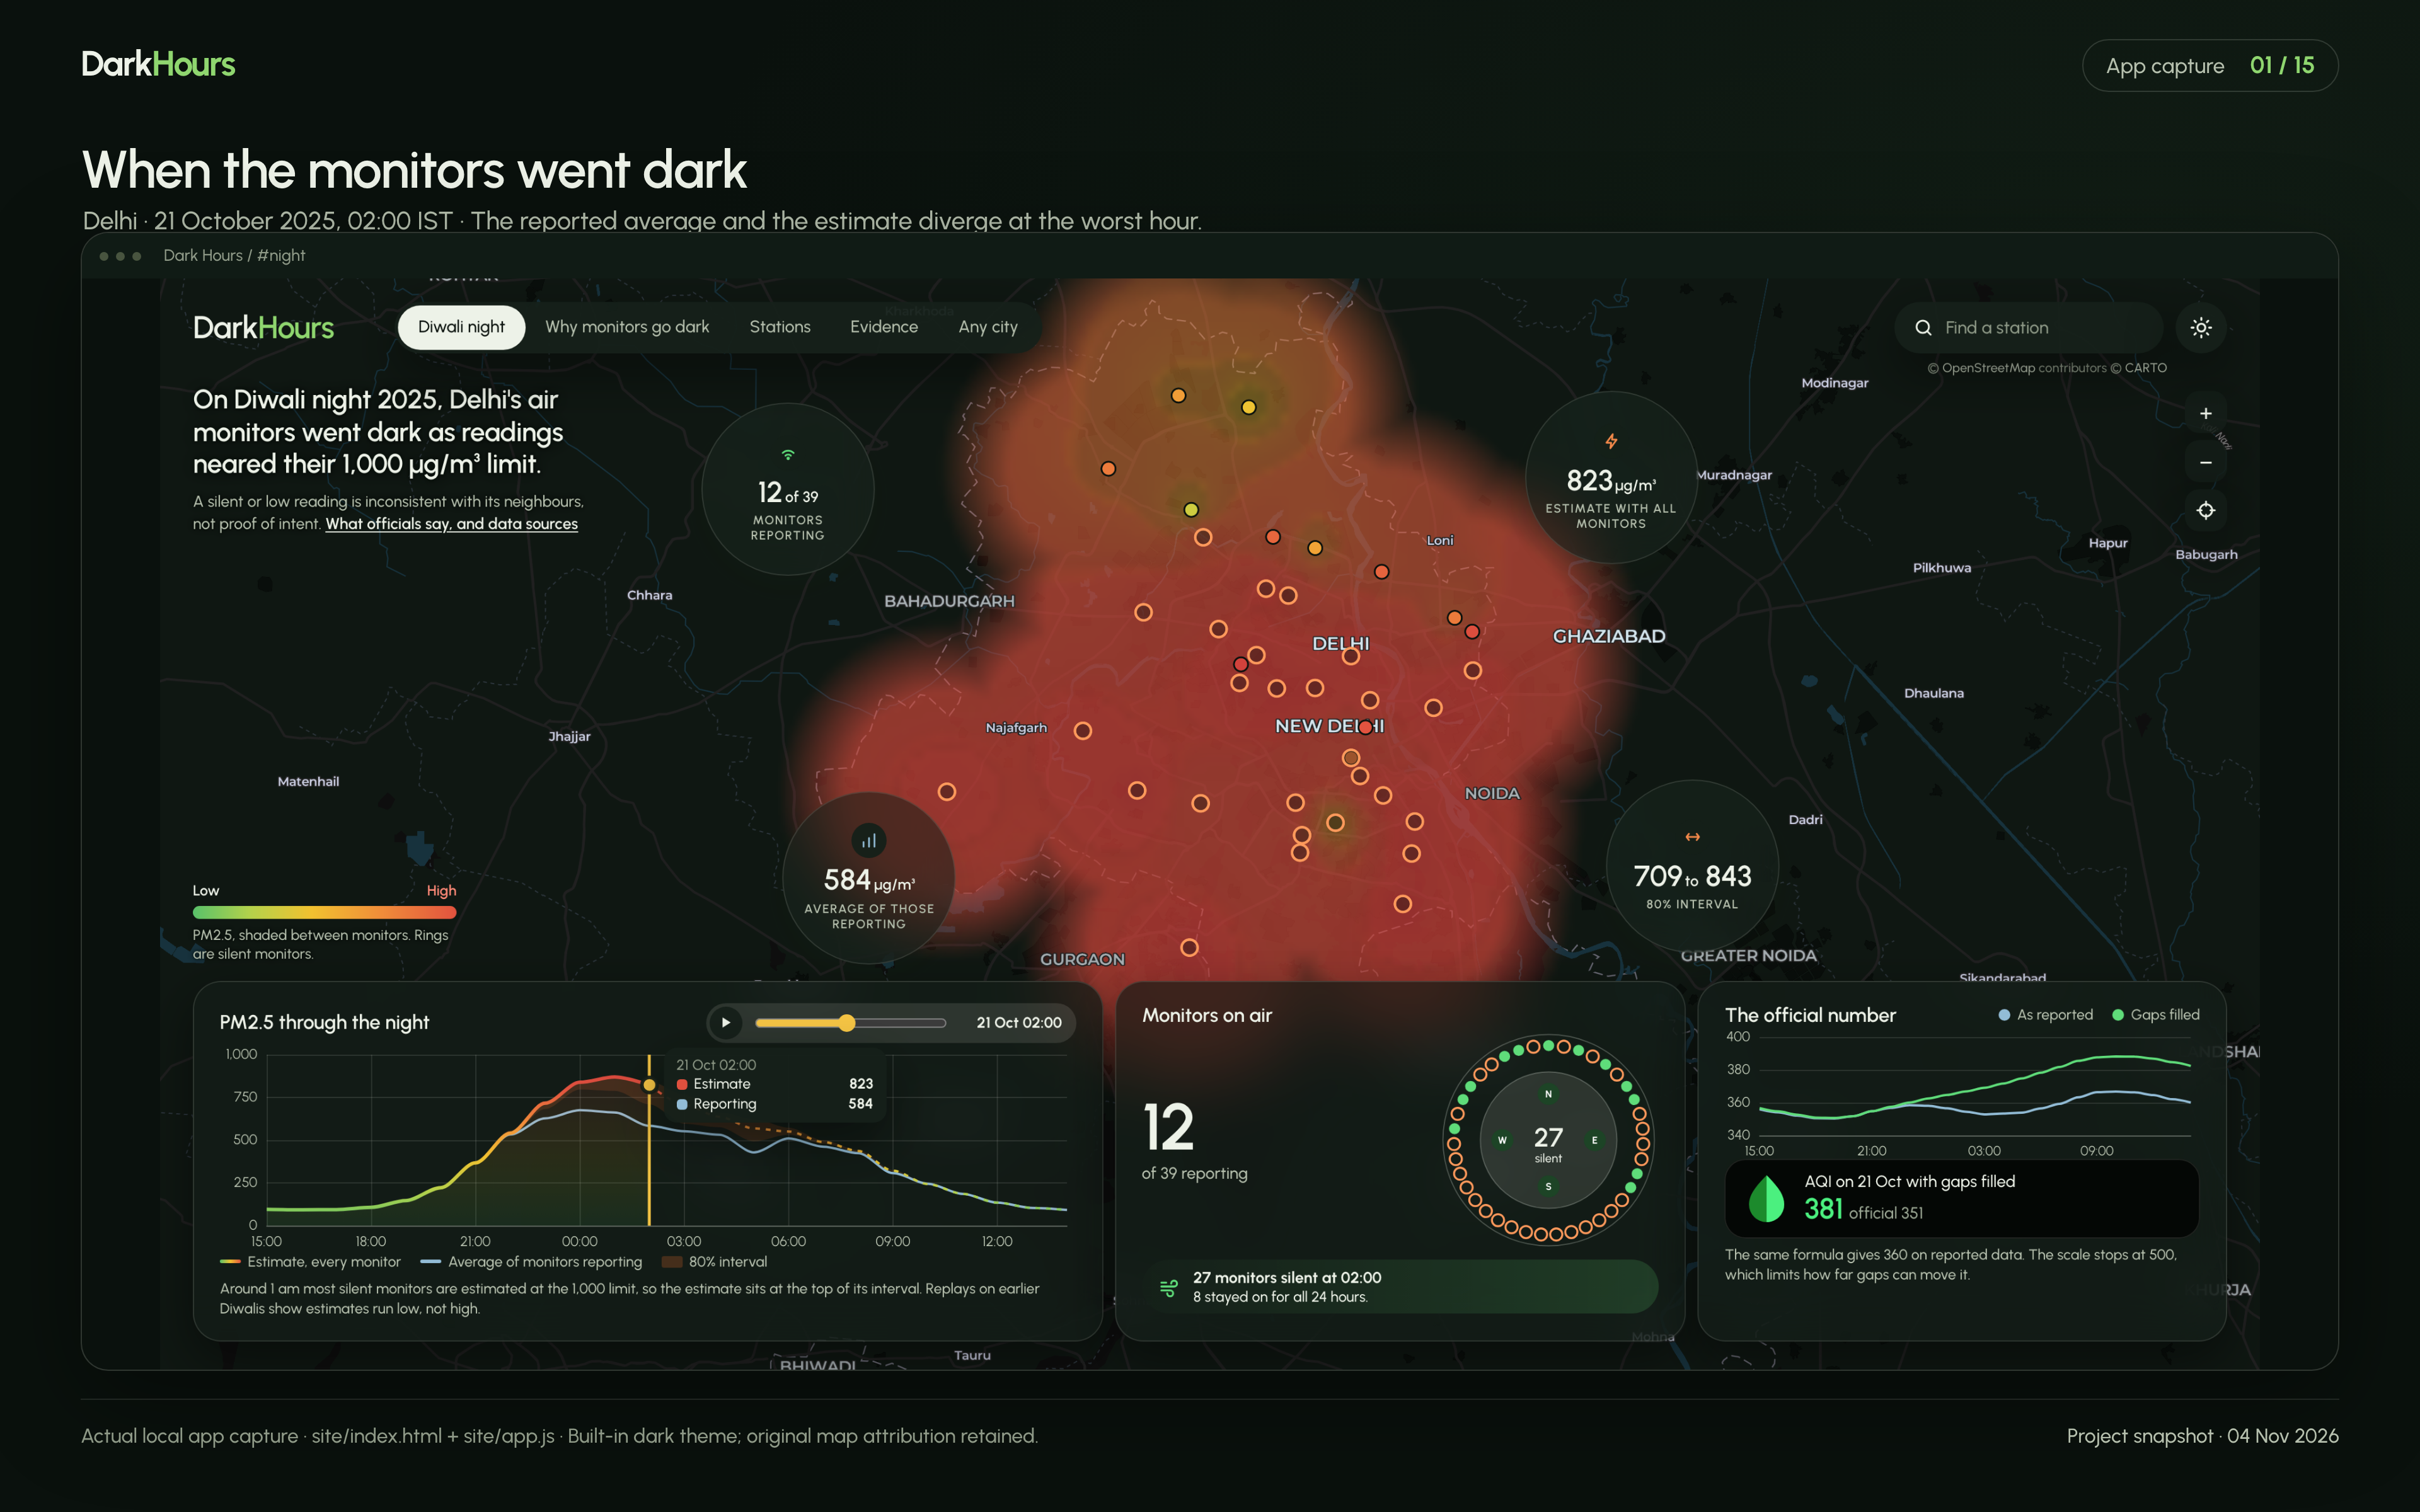
On Diwali night 2025, Delhi’s air was at its worst and most of its monitors had gone quiet. At 2 am, only 12 of 39 stations were reporting PM2.5.
The public average that hour came from those 12 monitors. It looked like a reading of the whole city, but it left out the other 27.
The debate that followed got stuck between “the data was hidden” and “nothing was missing”. We wanted to ask something public data can actually answer: what did the silence hide, and how sure can we be?
A blank is not a zero. It is a question, and any answer to it should come with its uncertainty attached.
What it does
Dark Hours measures when Delhi’s monitors go silent, estimates what they would have read, and says how far to trust each estimate.
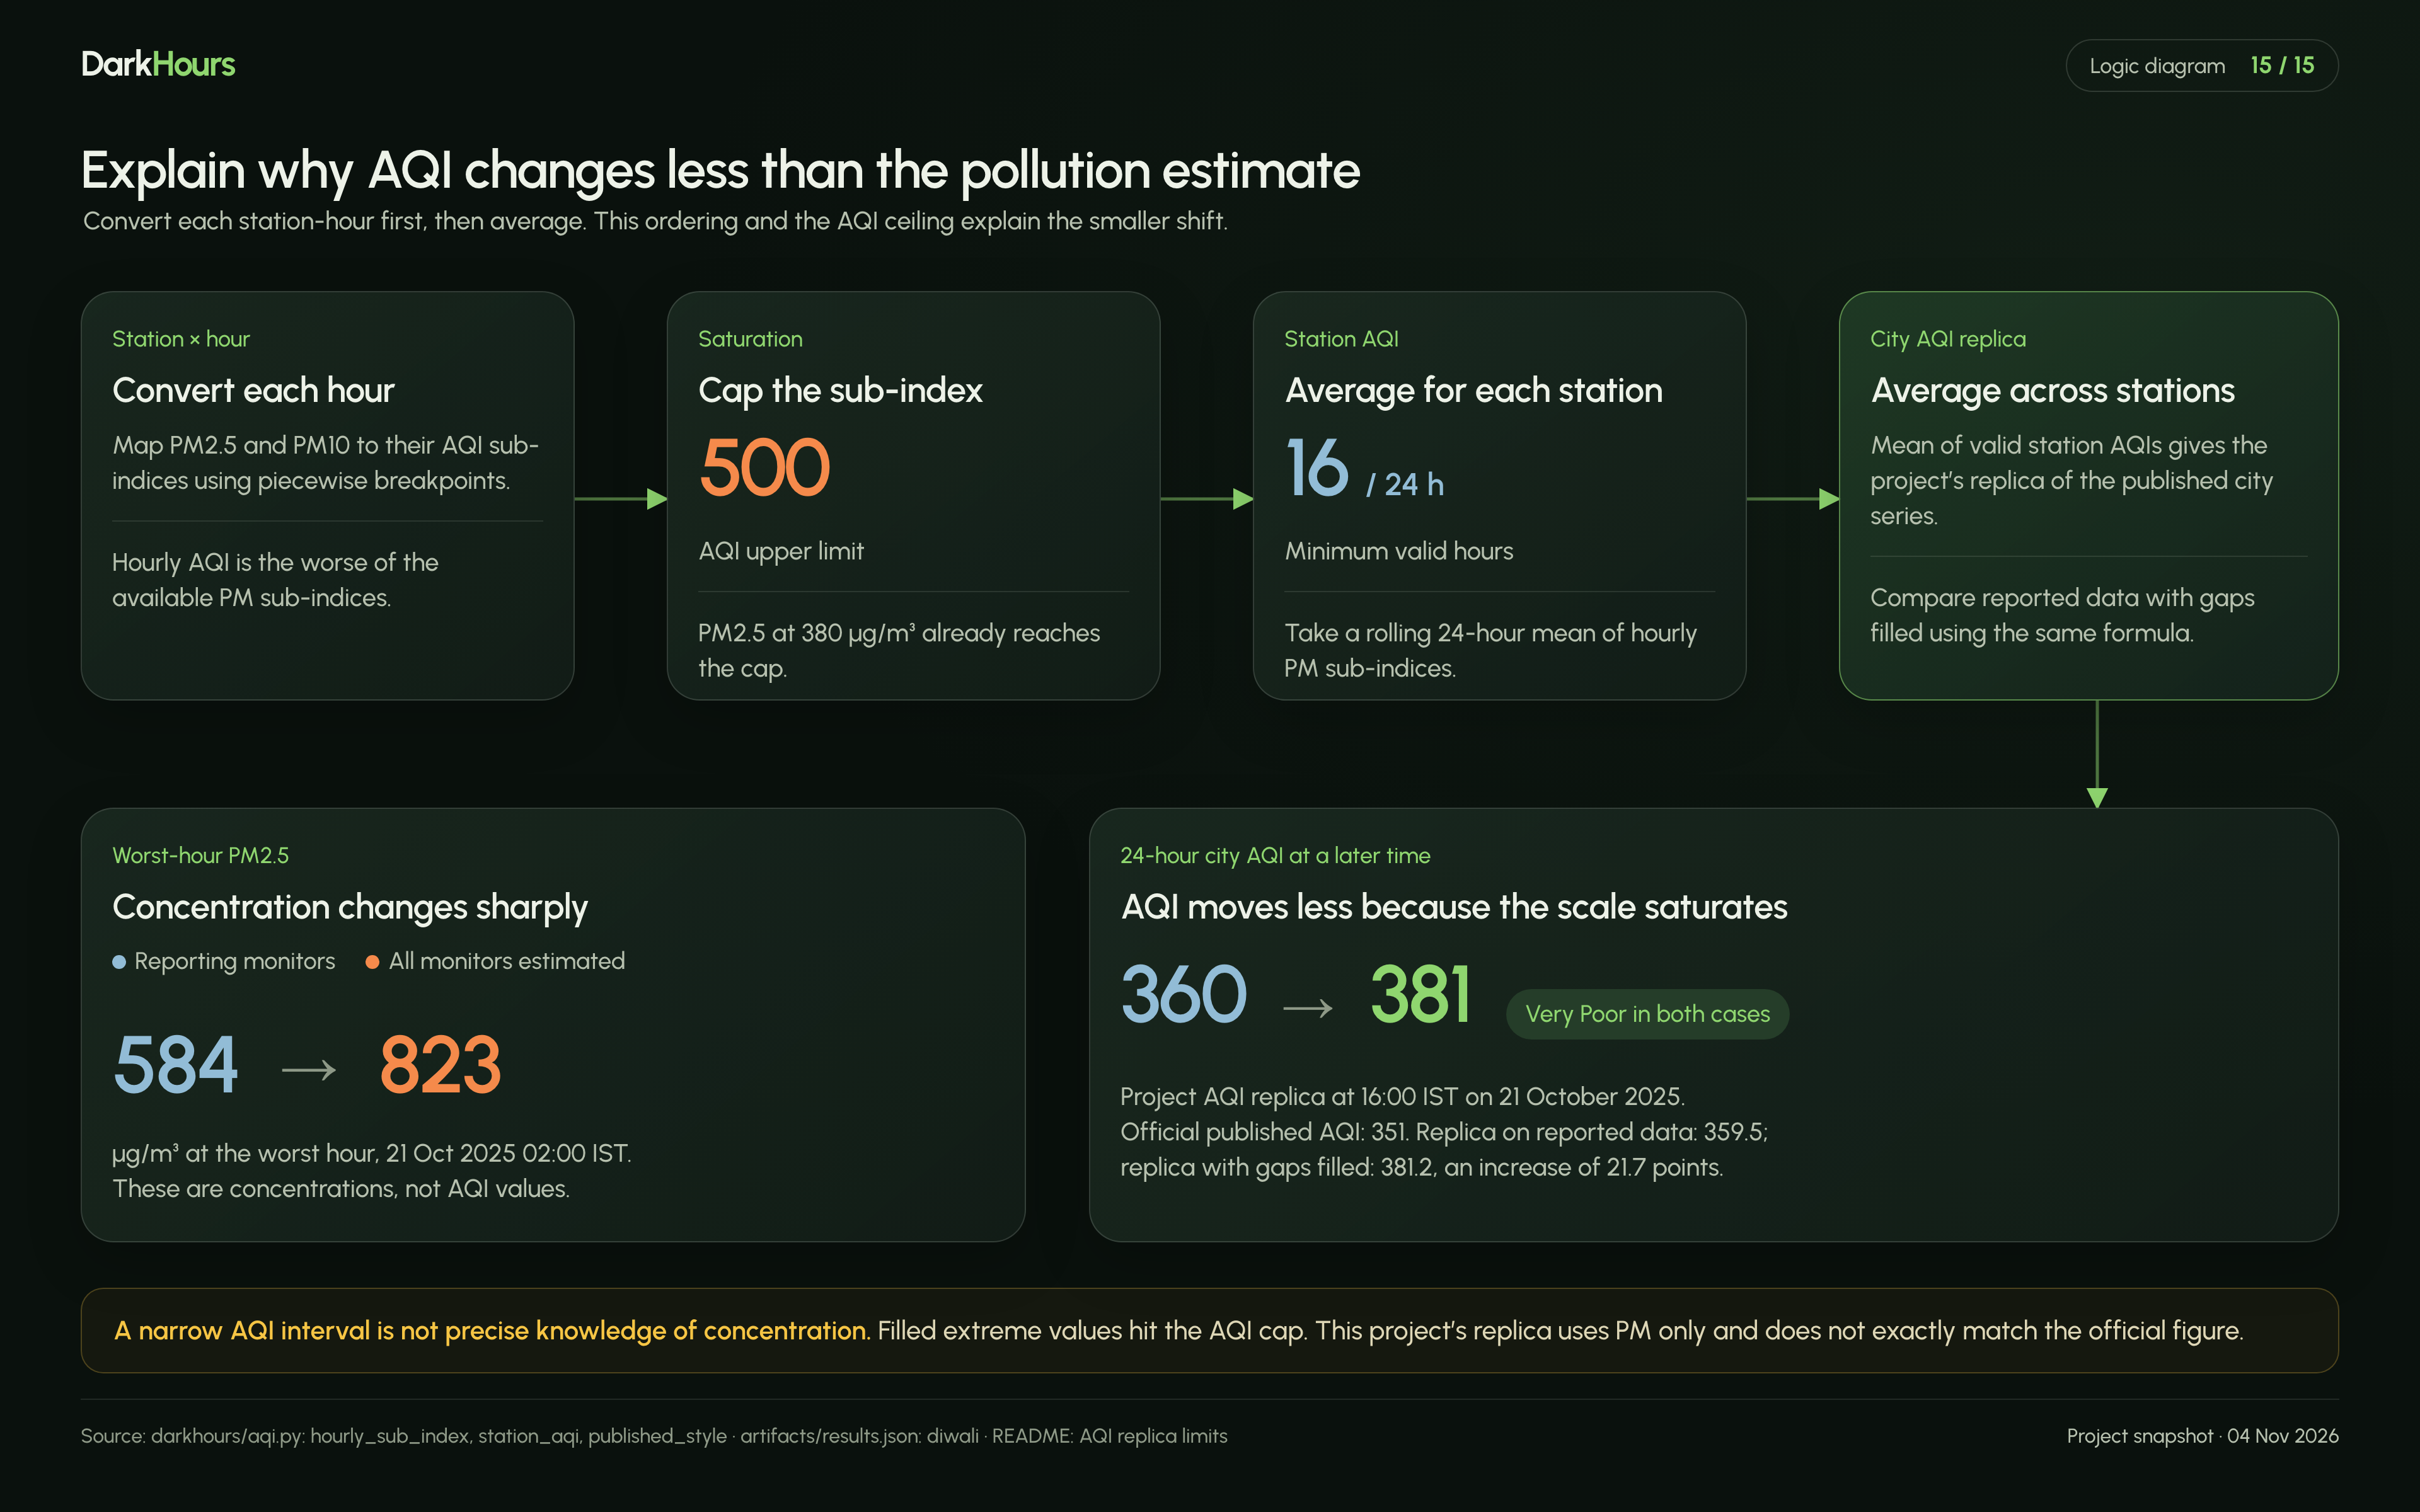
On Diwali 2025 at 2 am PM2.5 (µg/m³) Average of the 12 monitors reporting 584 Our estimate with all monitors 823 (80% interval 709 to 843)
The evidence runs in this order:
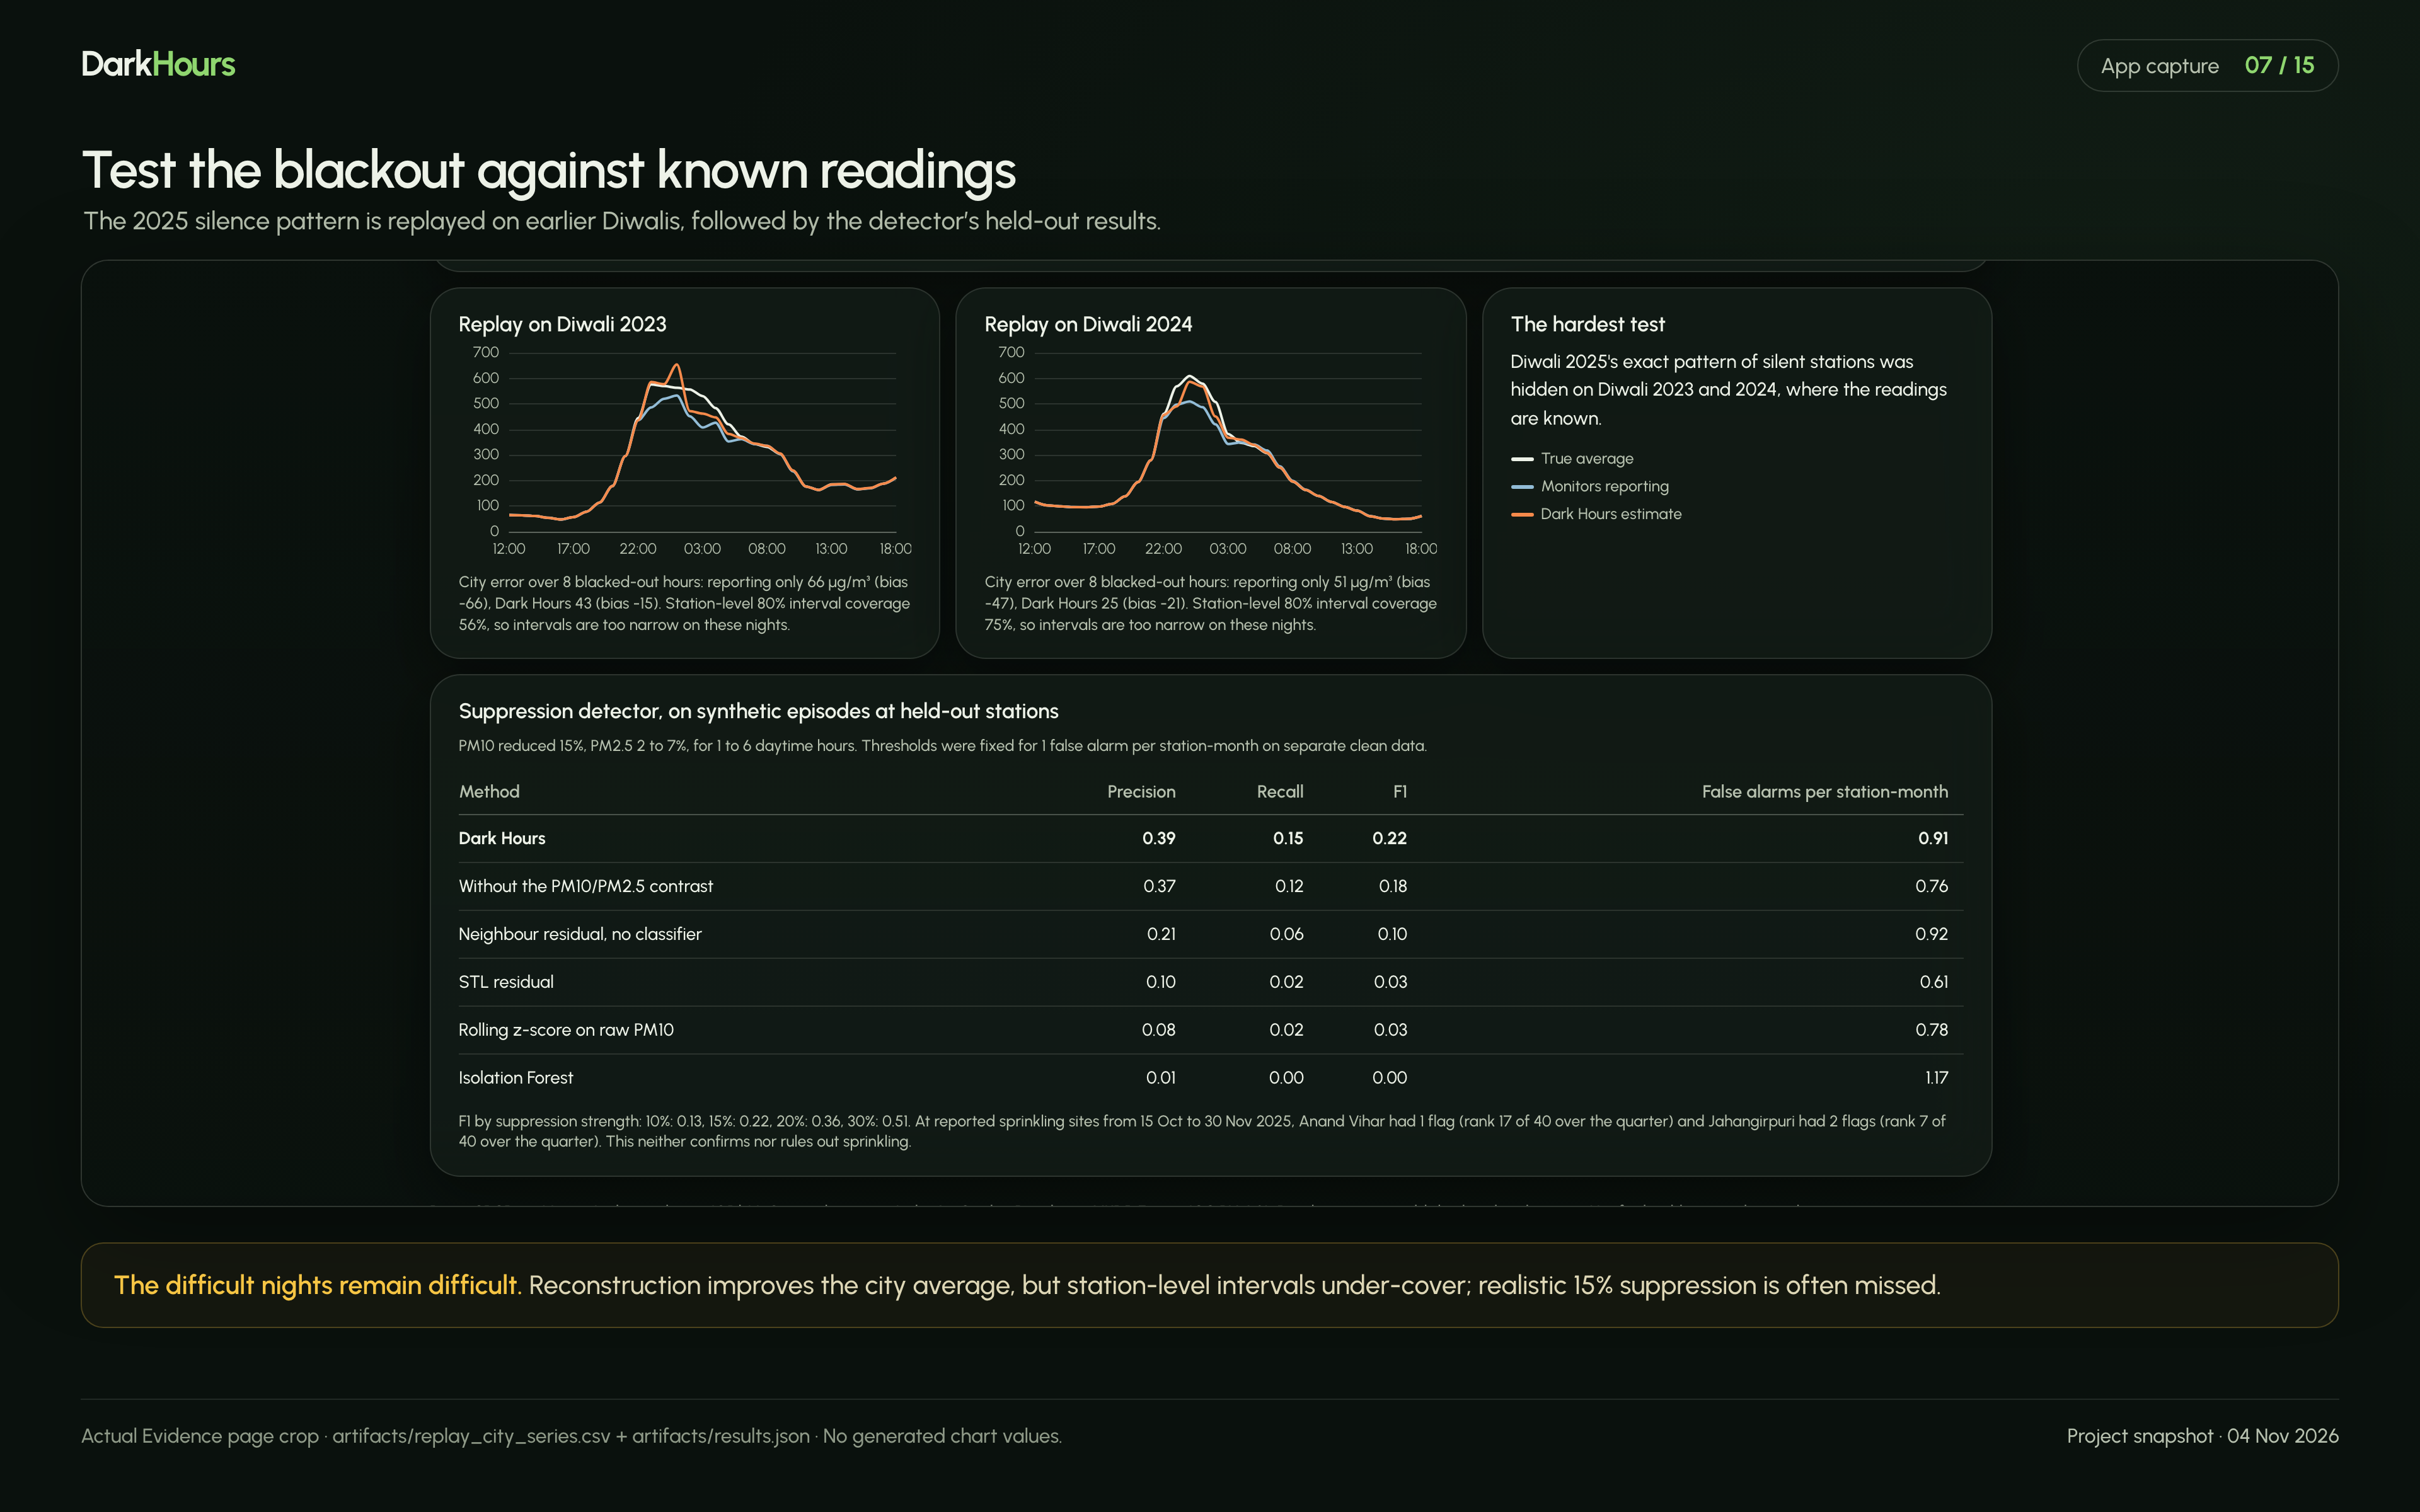
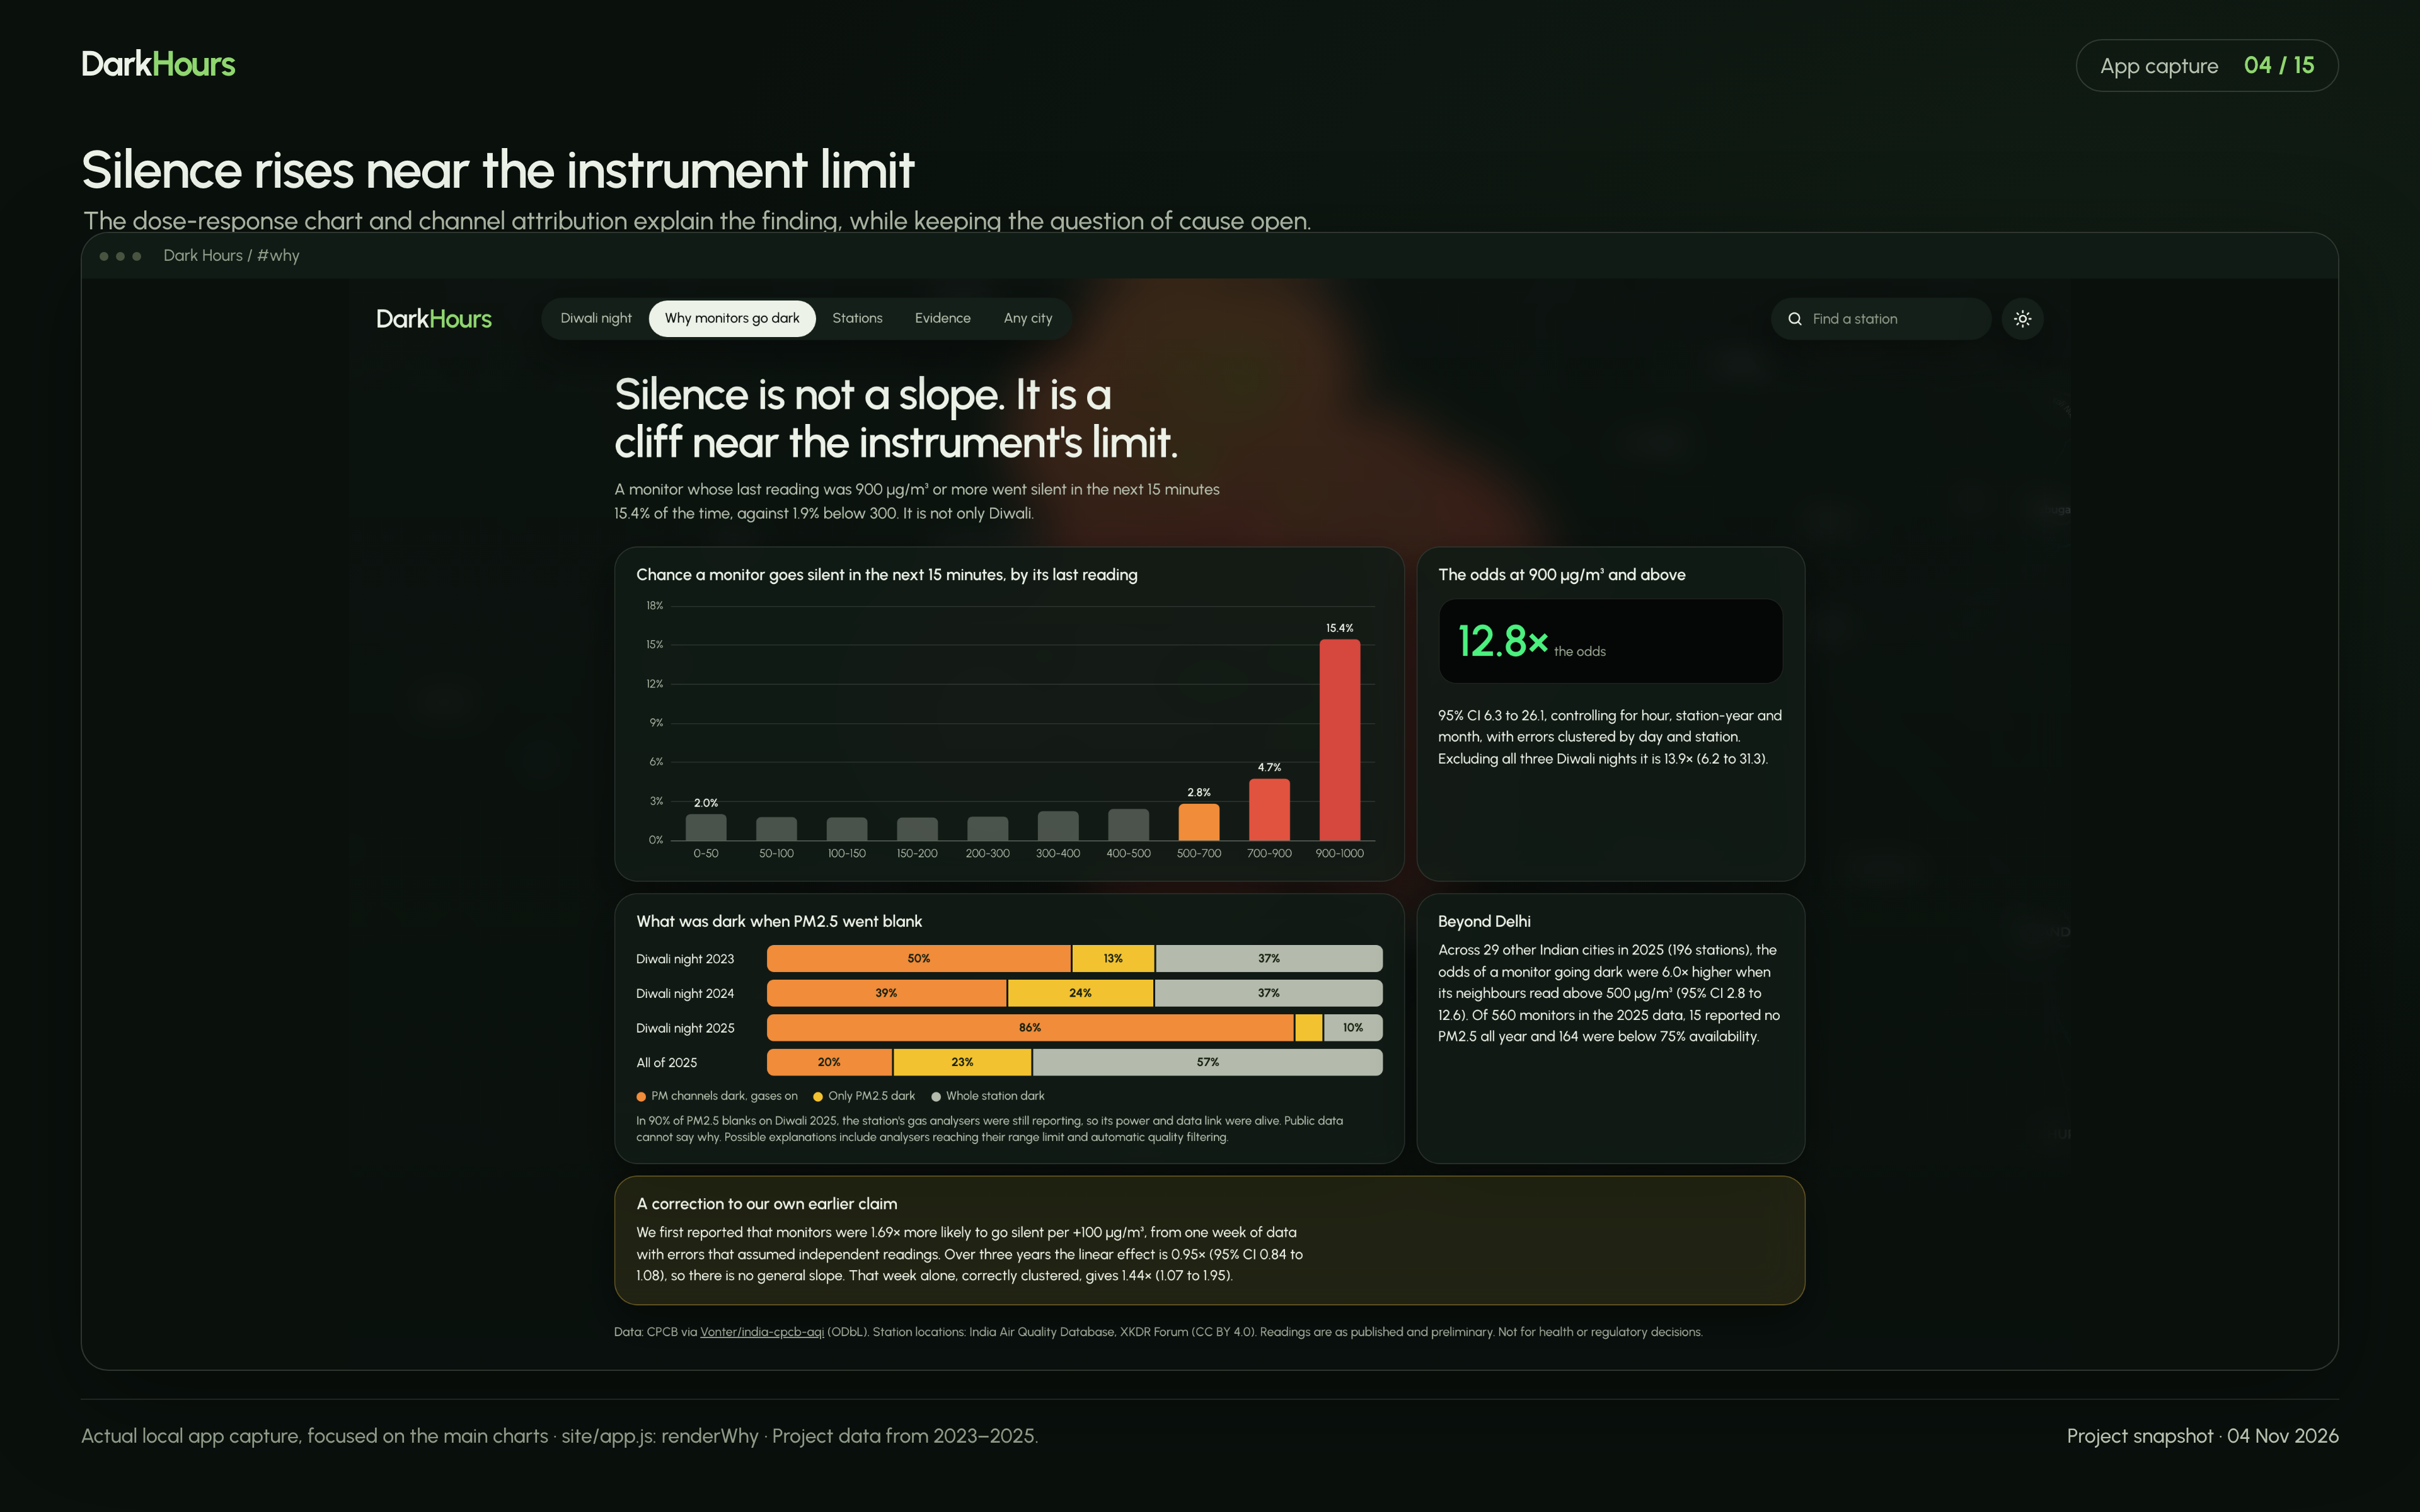
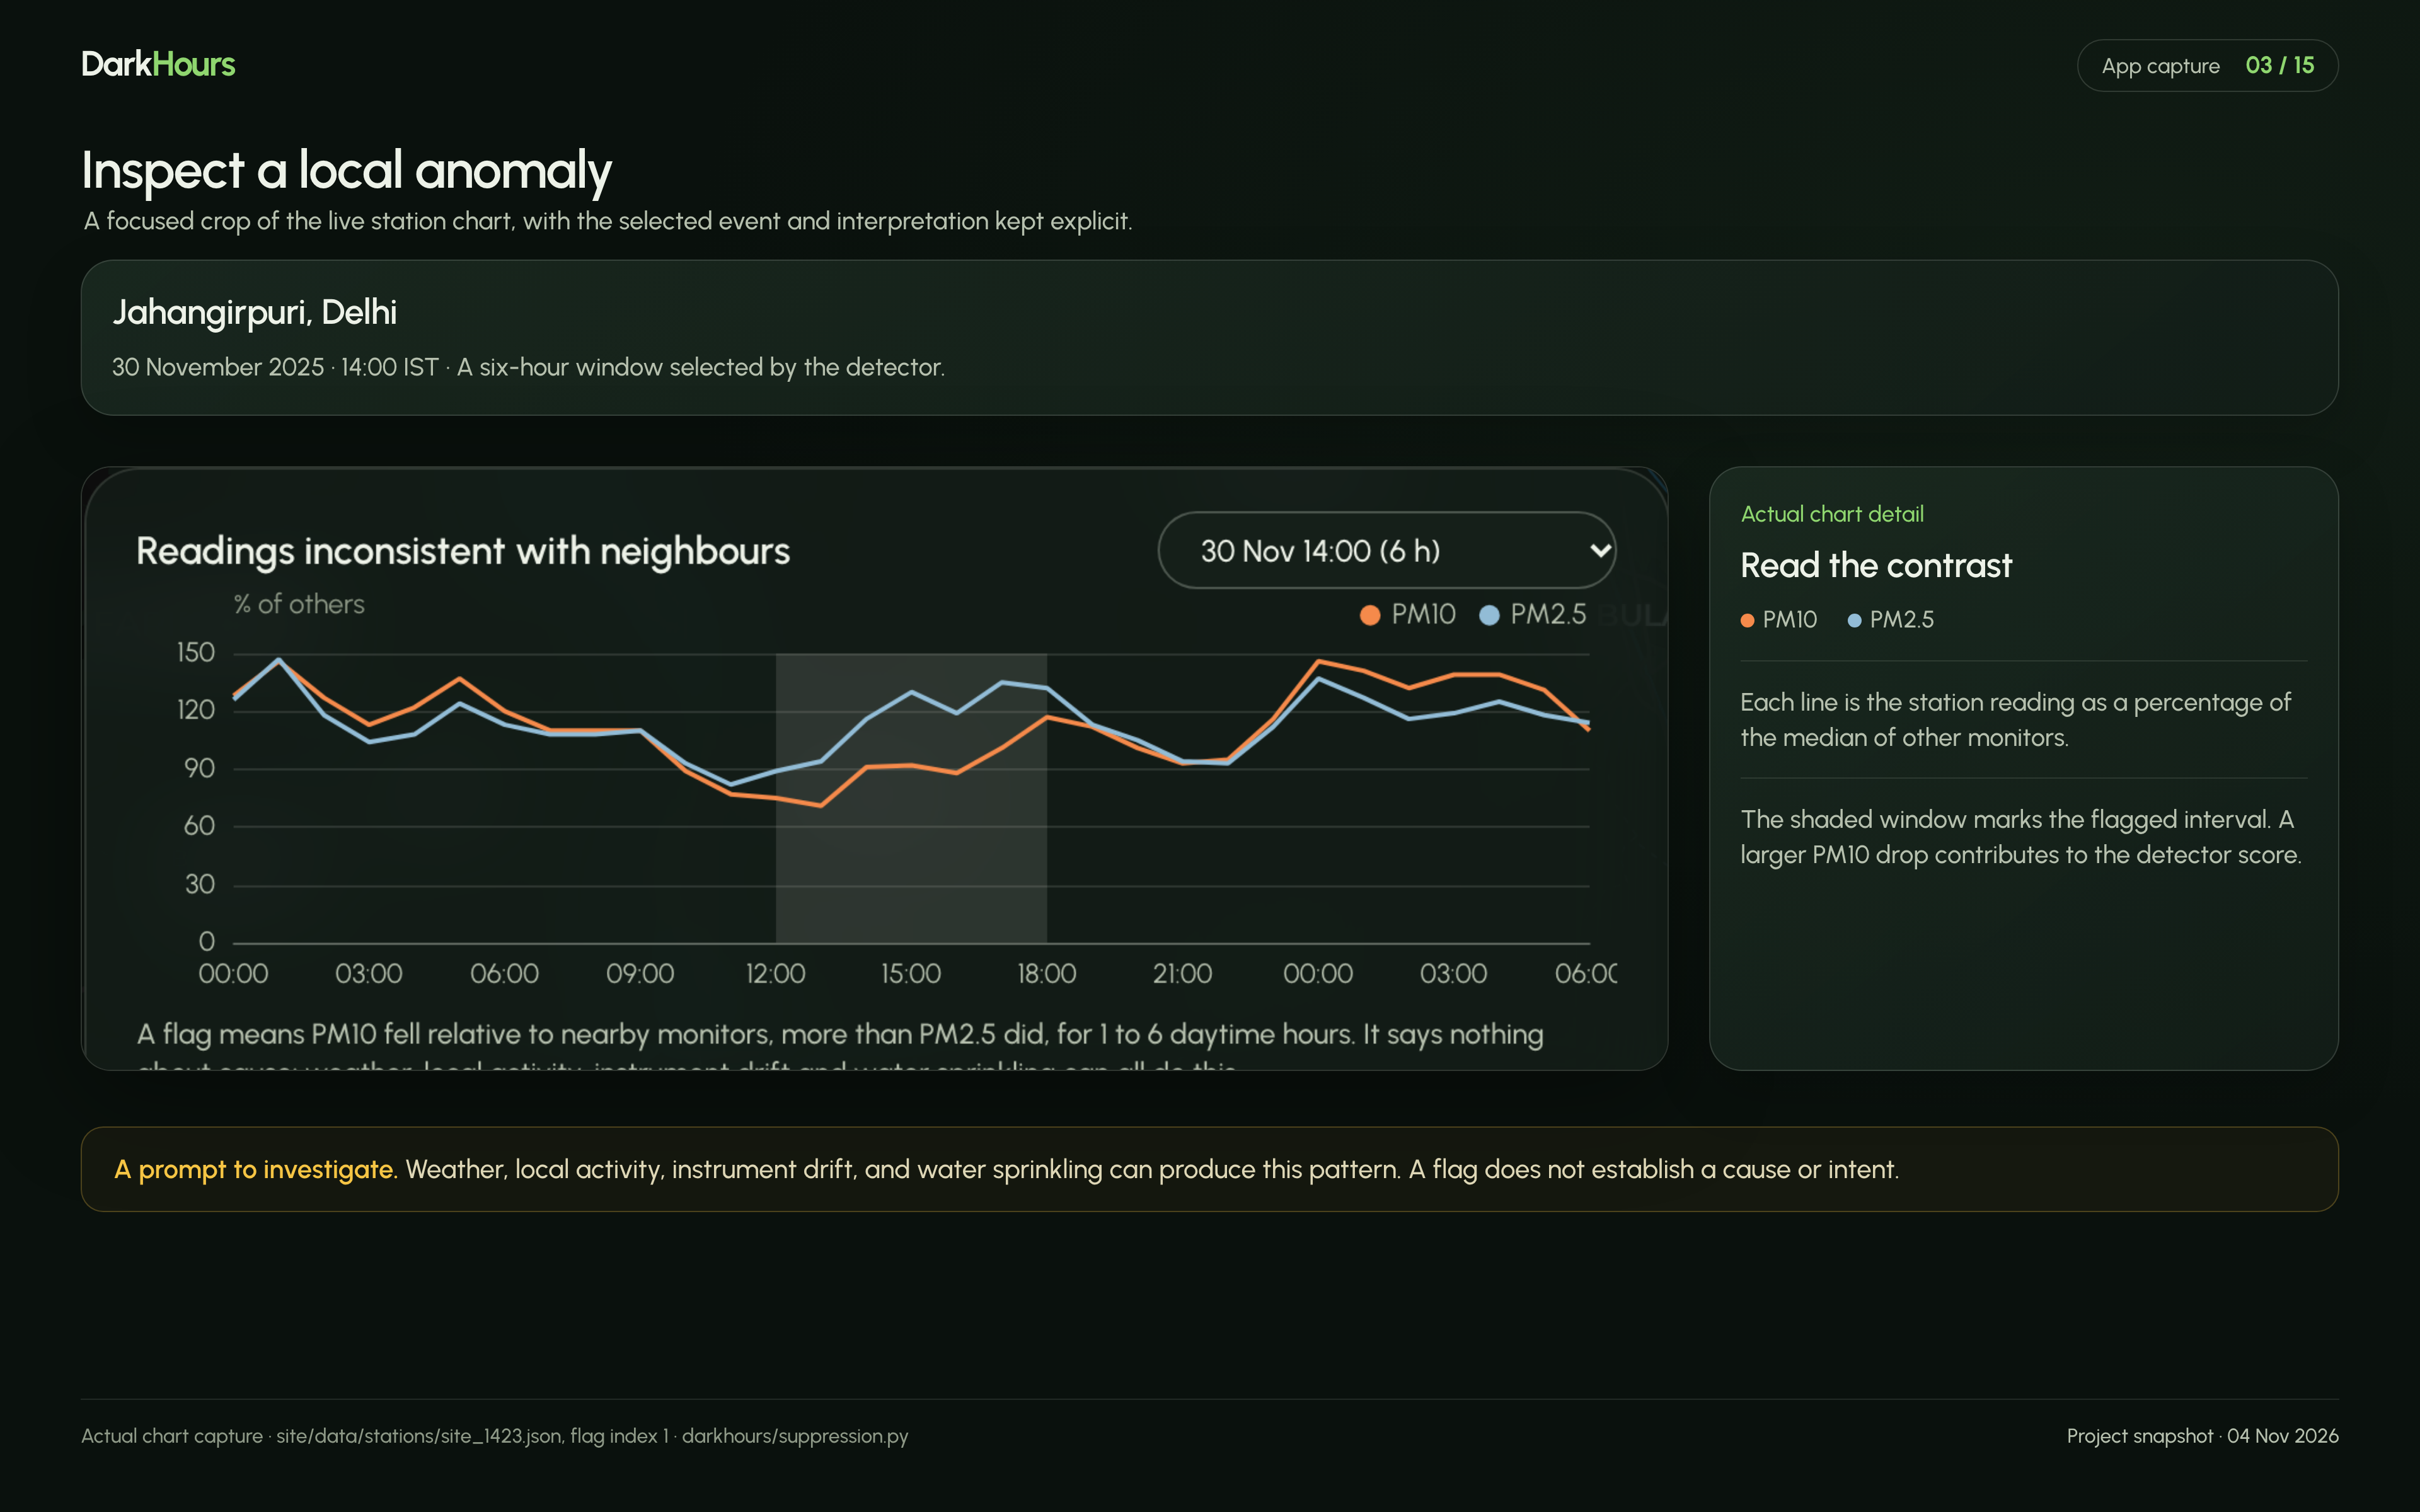
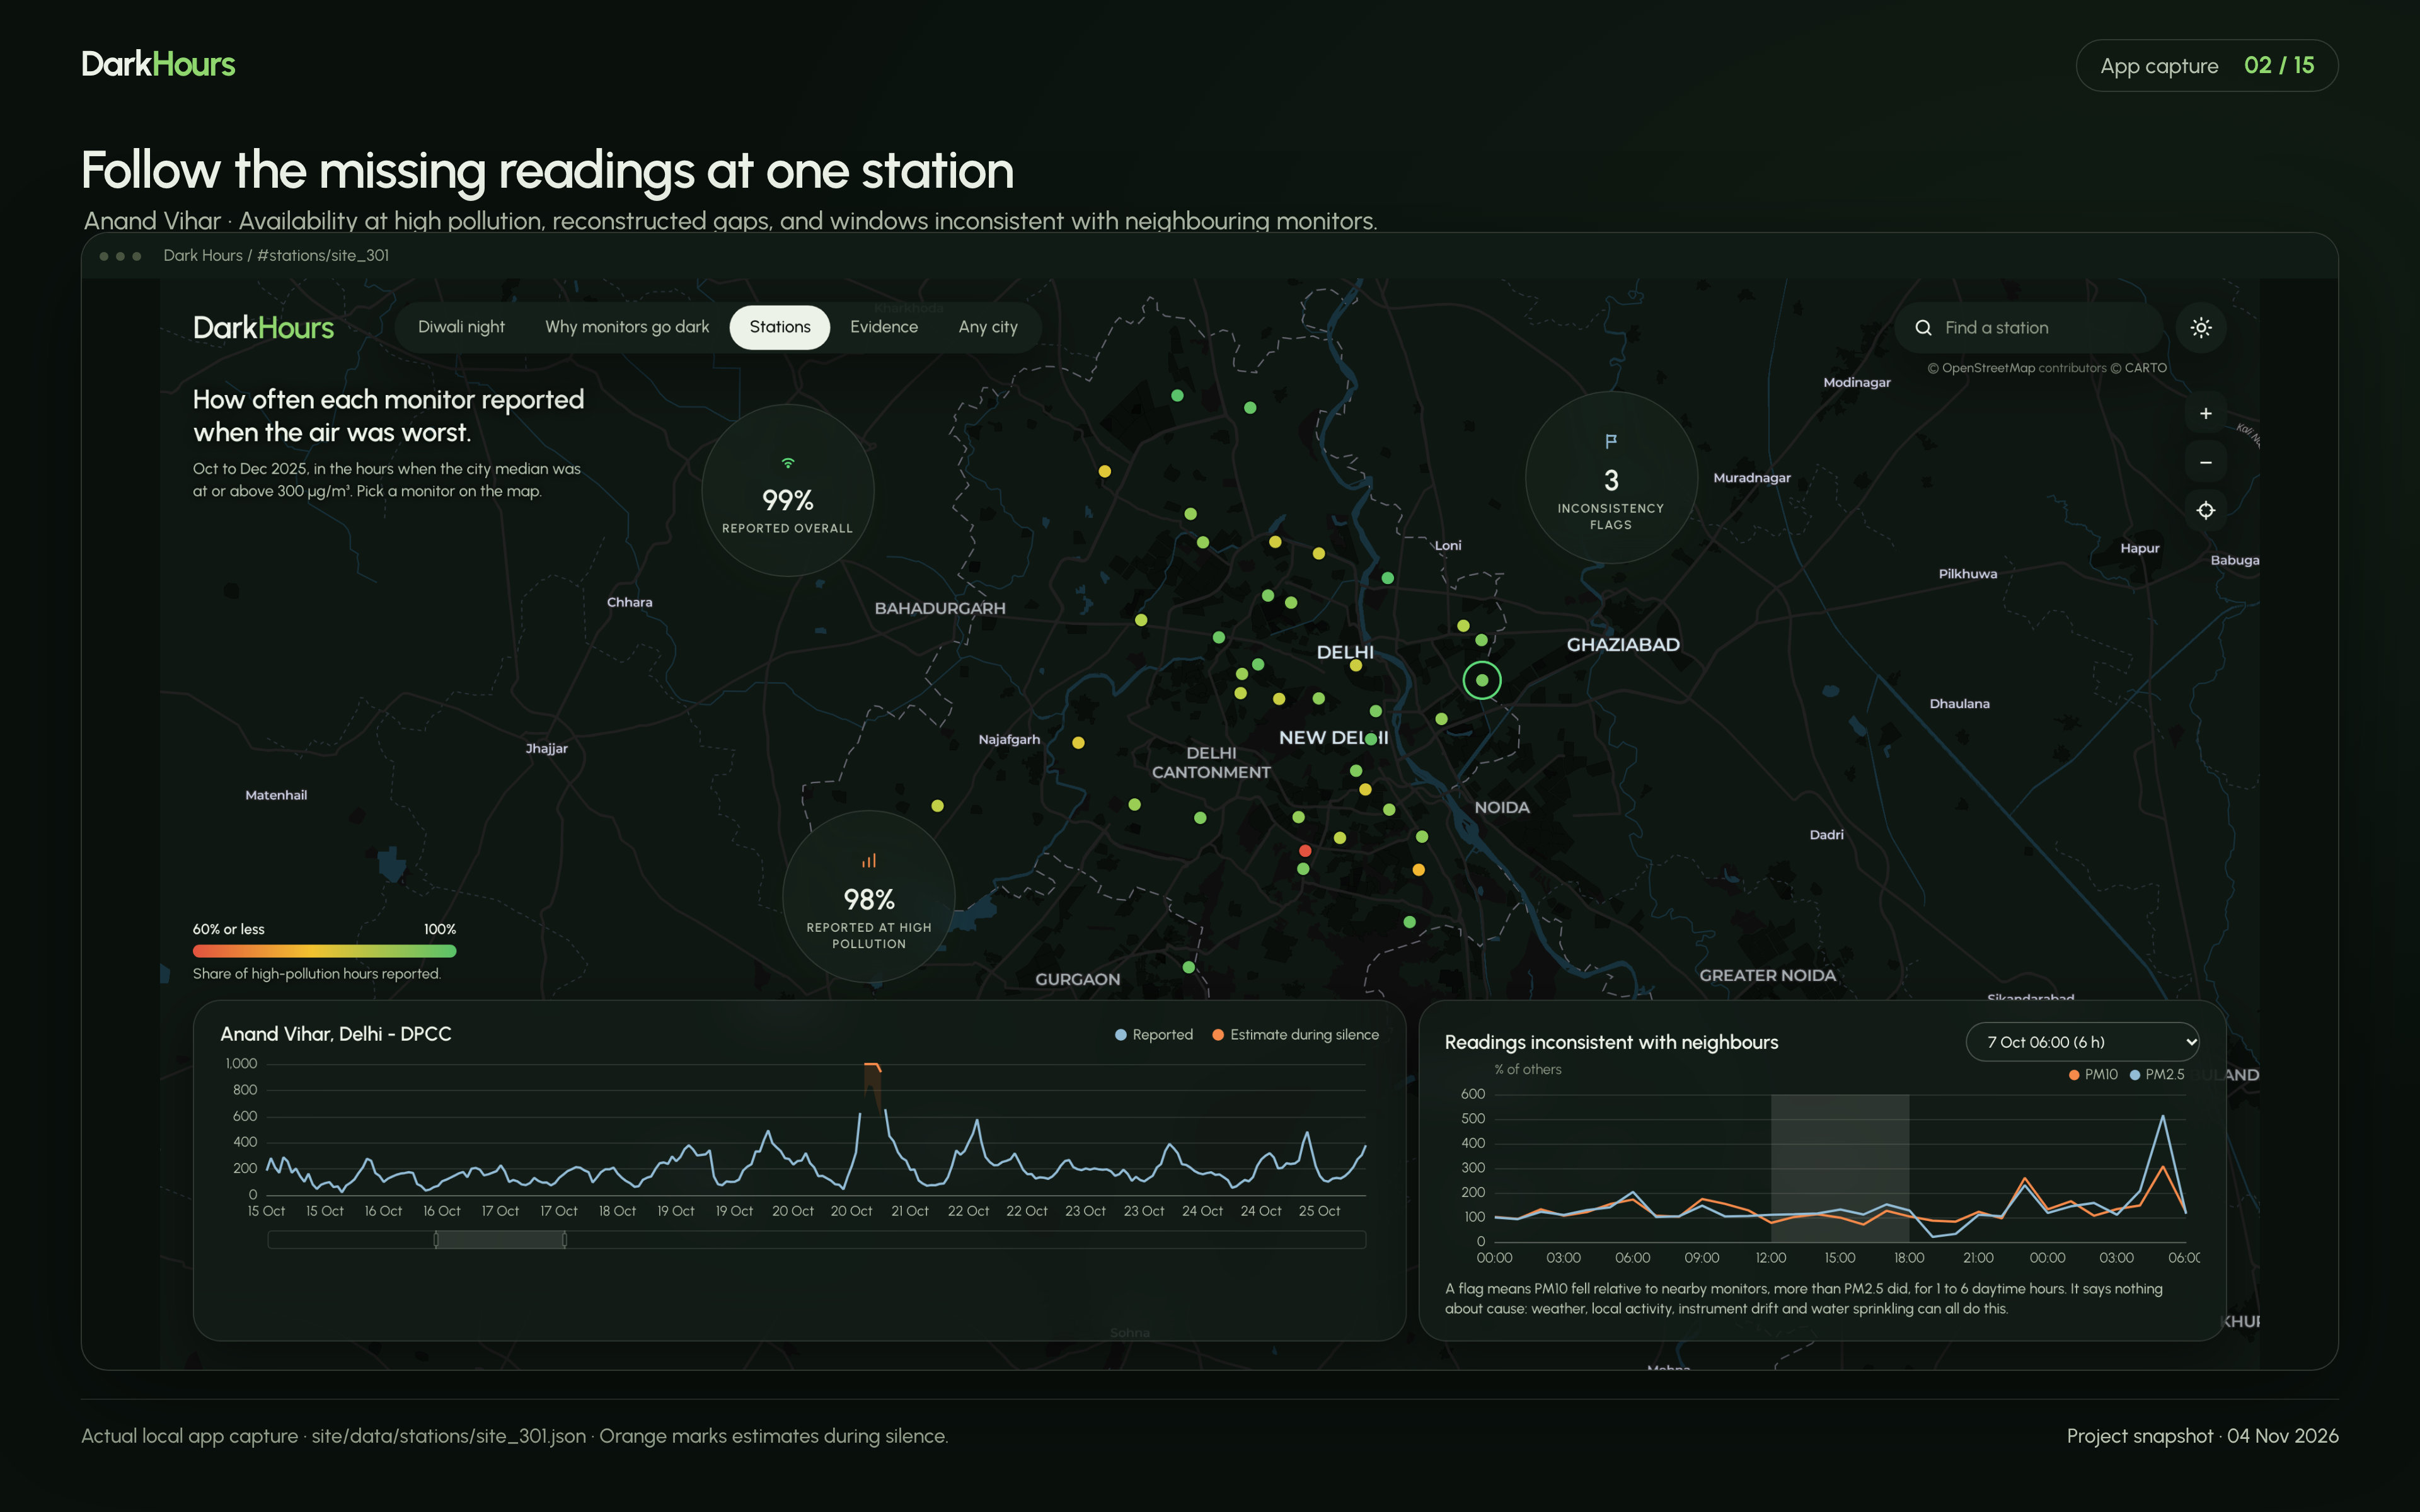
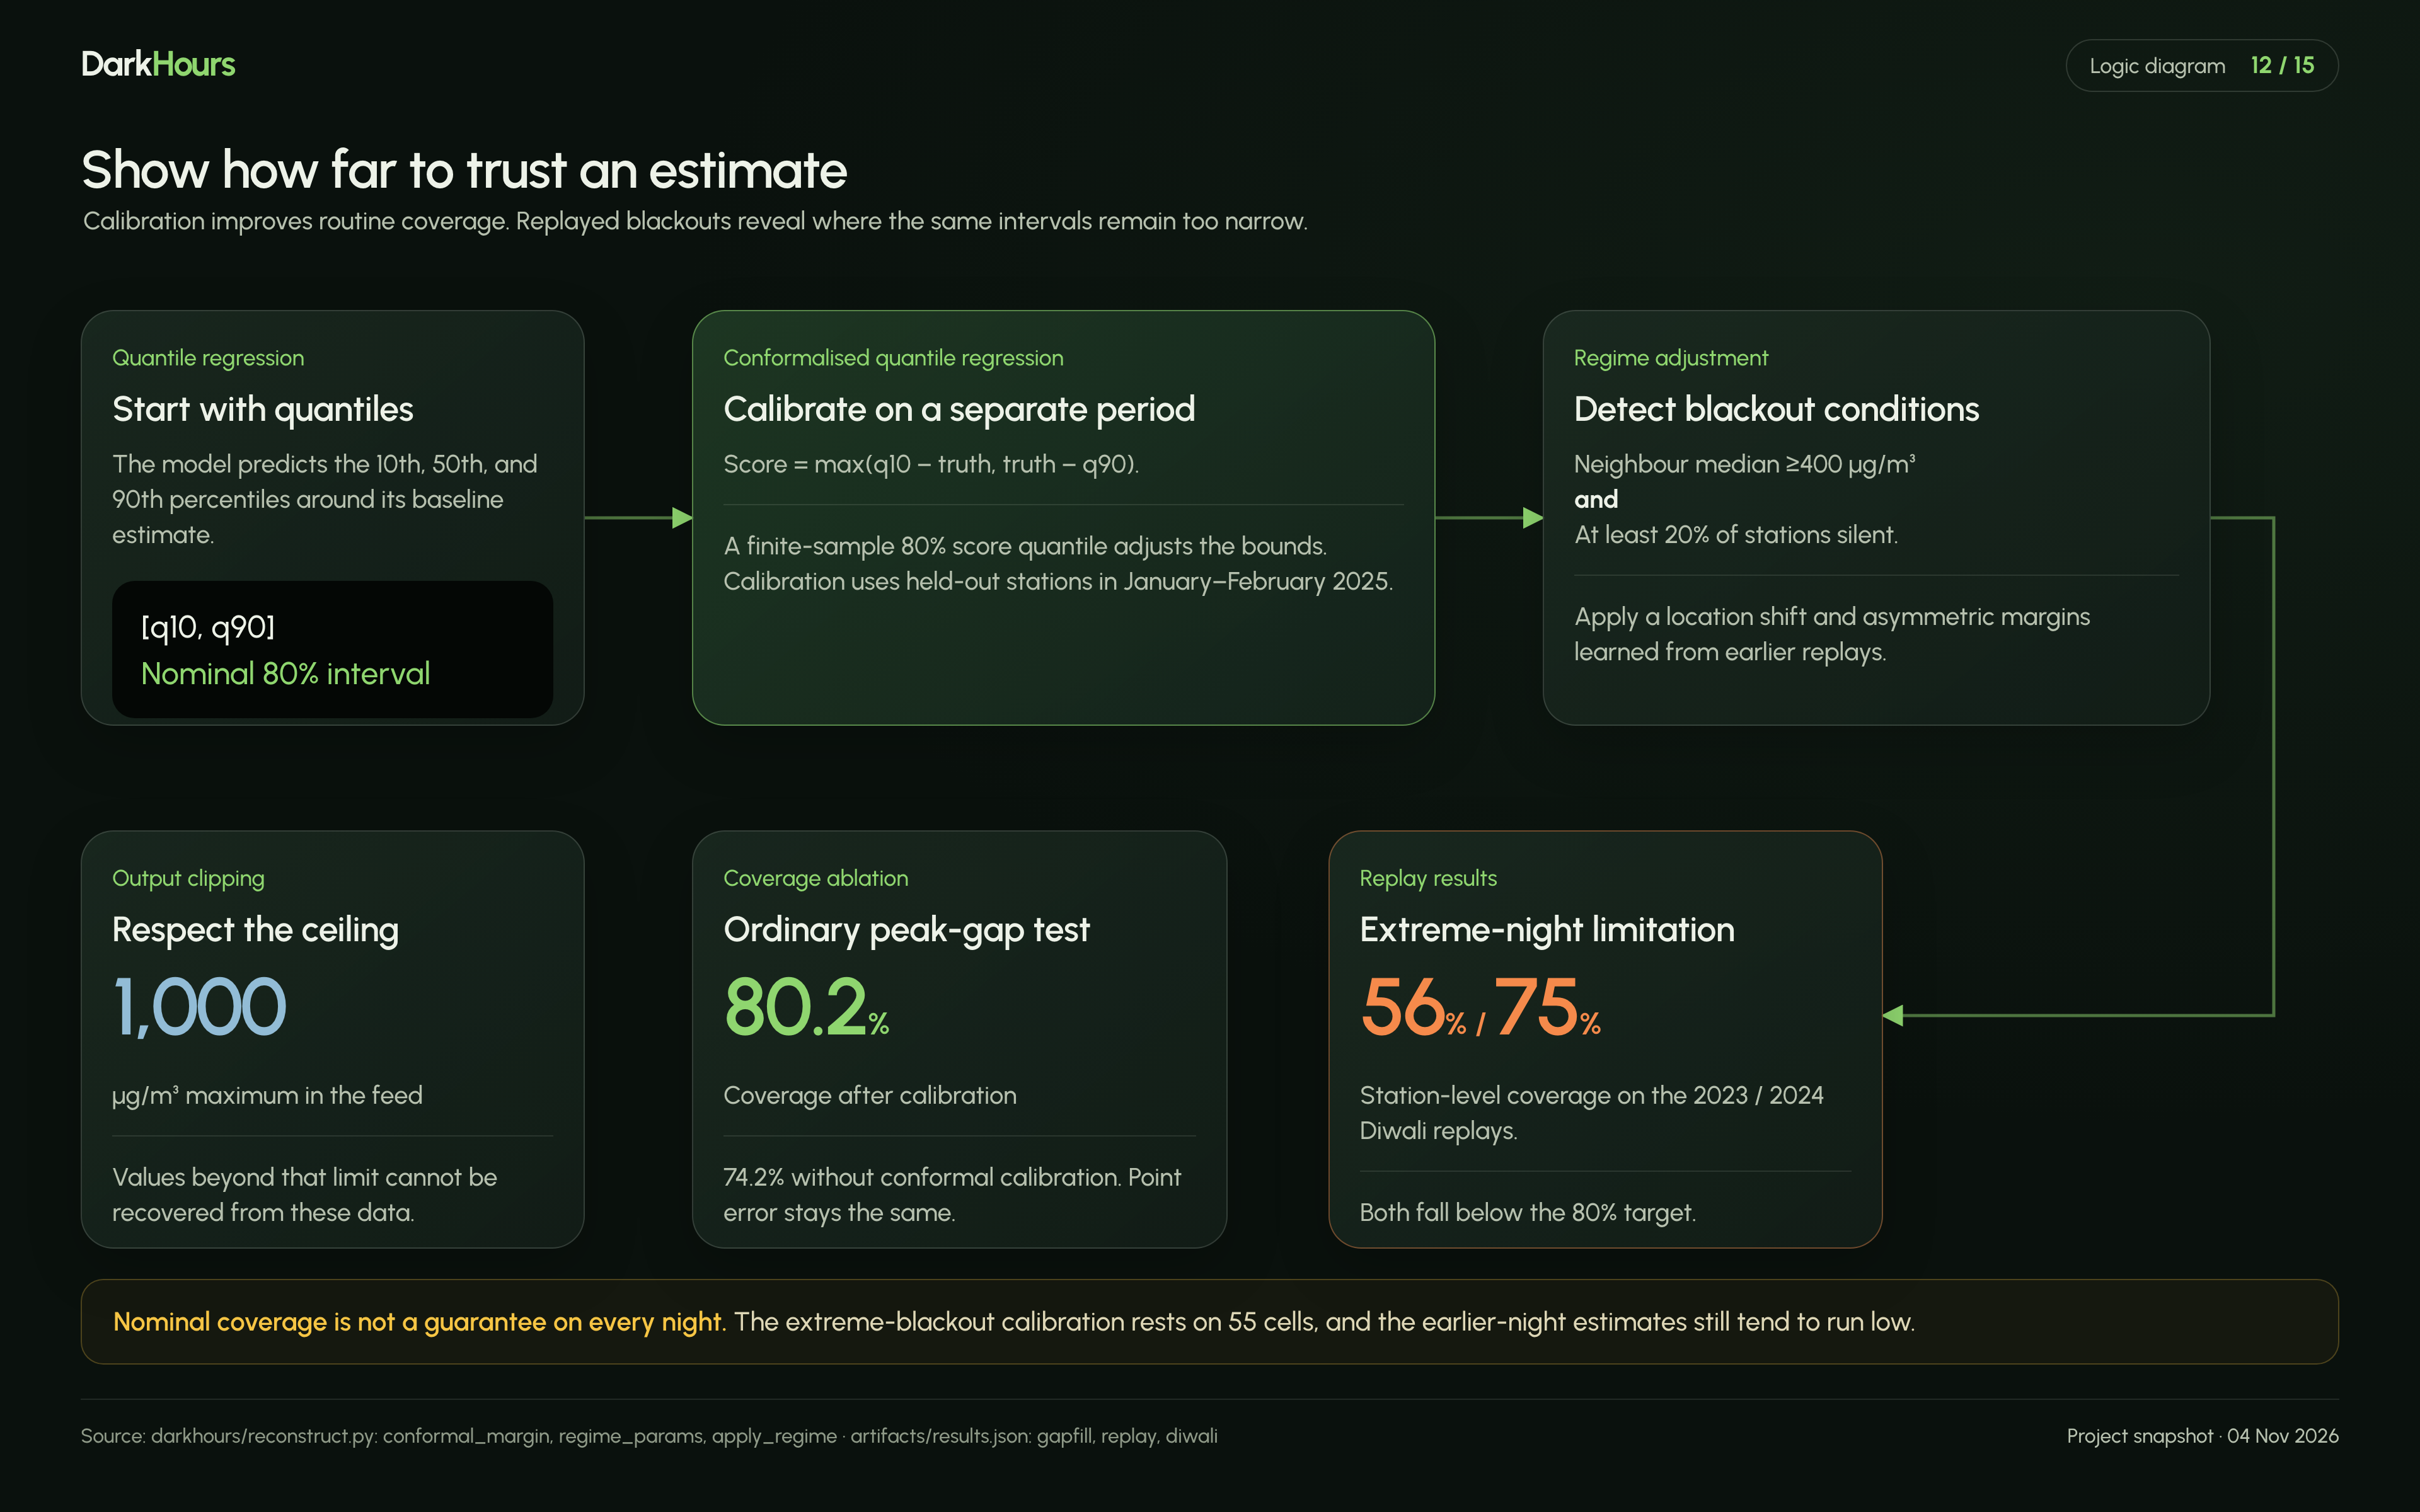
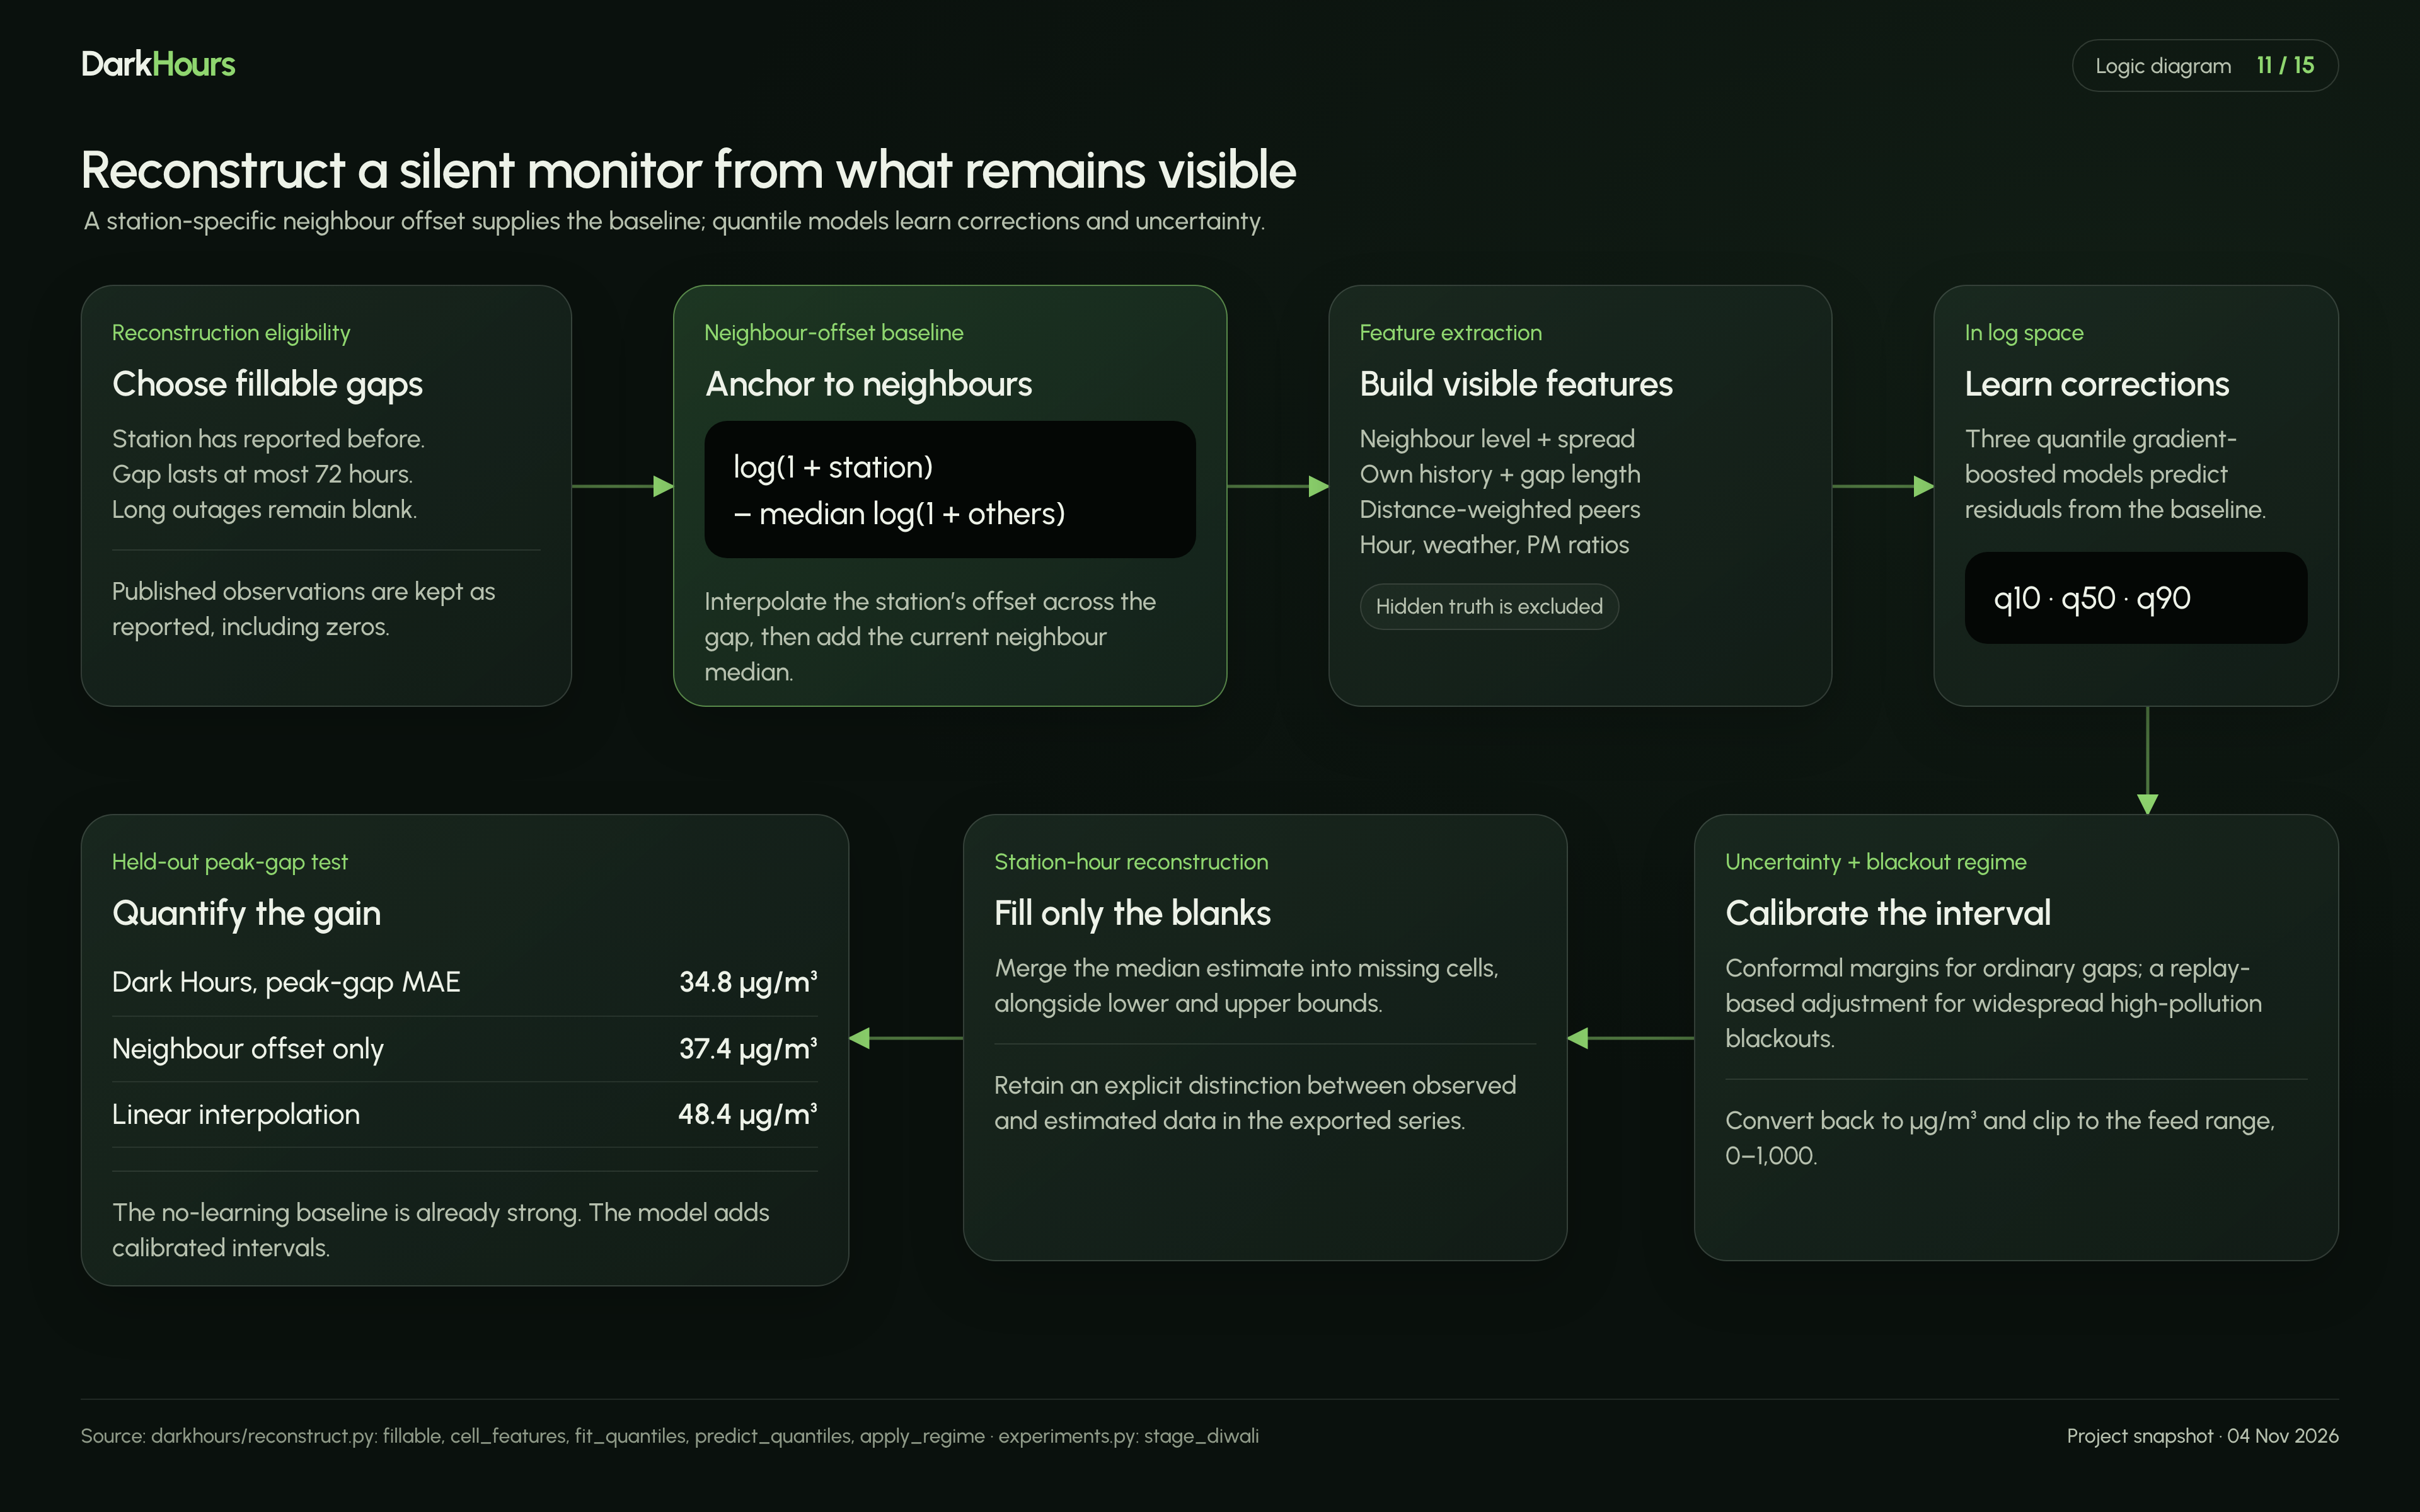
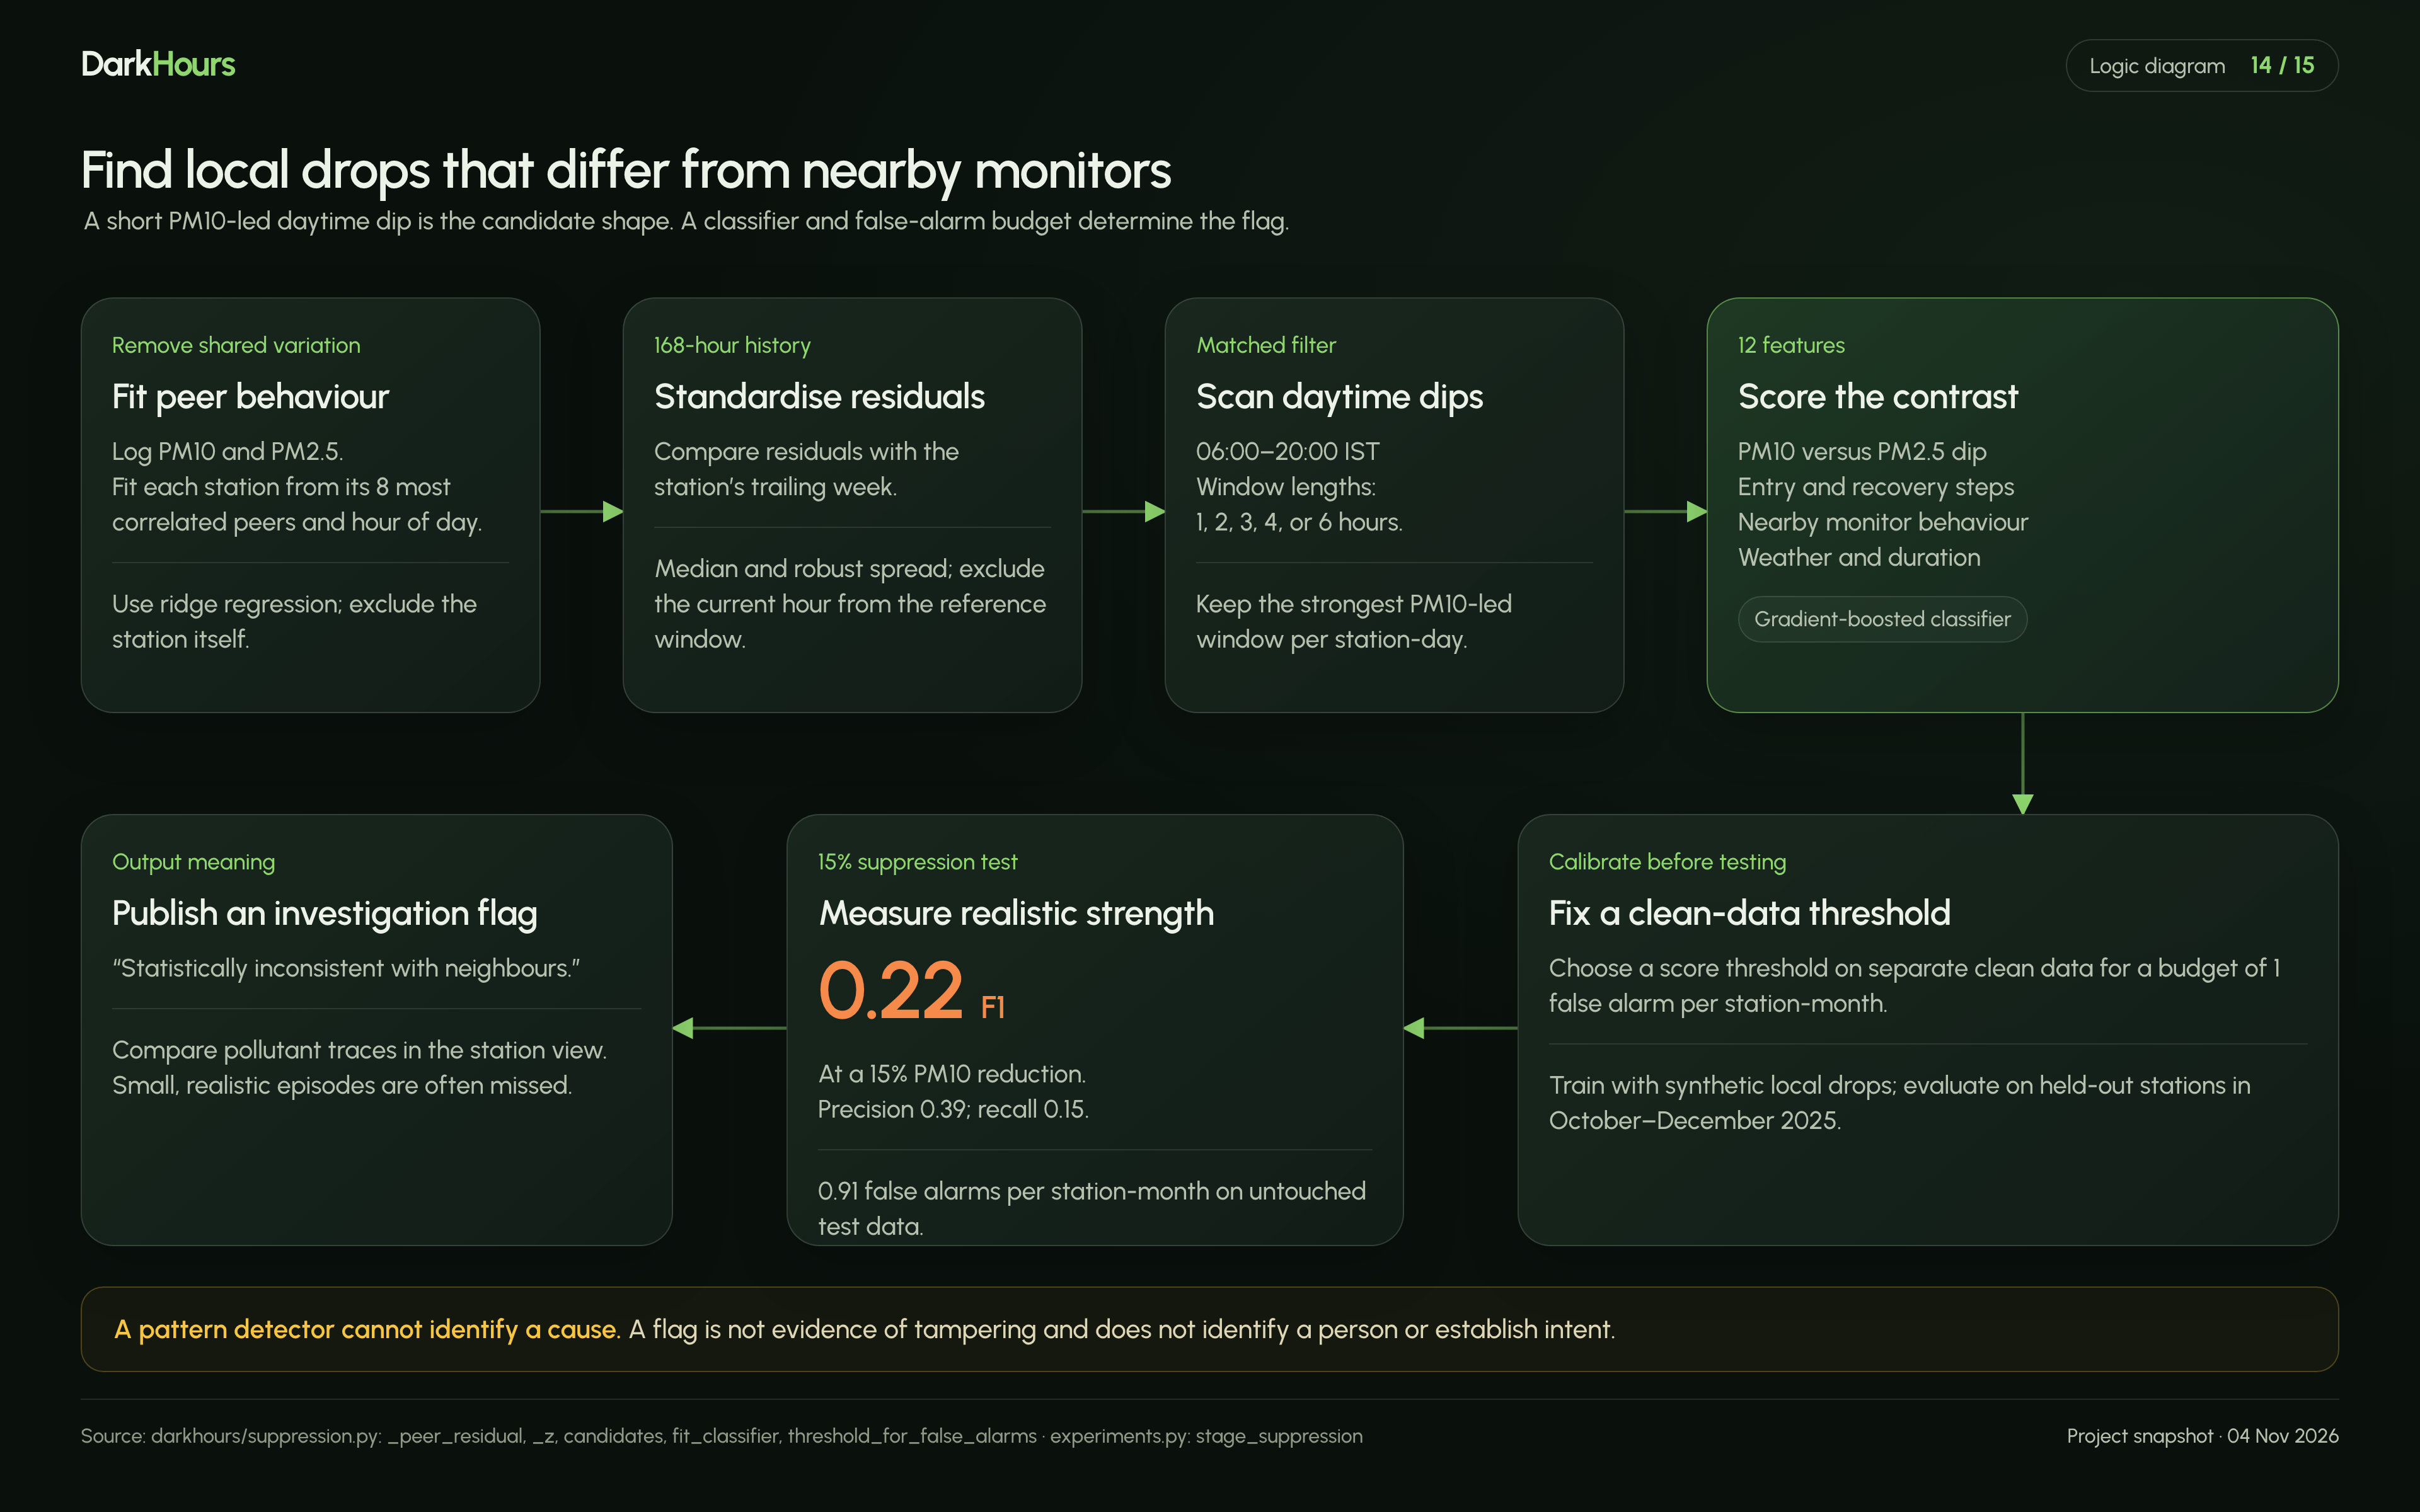
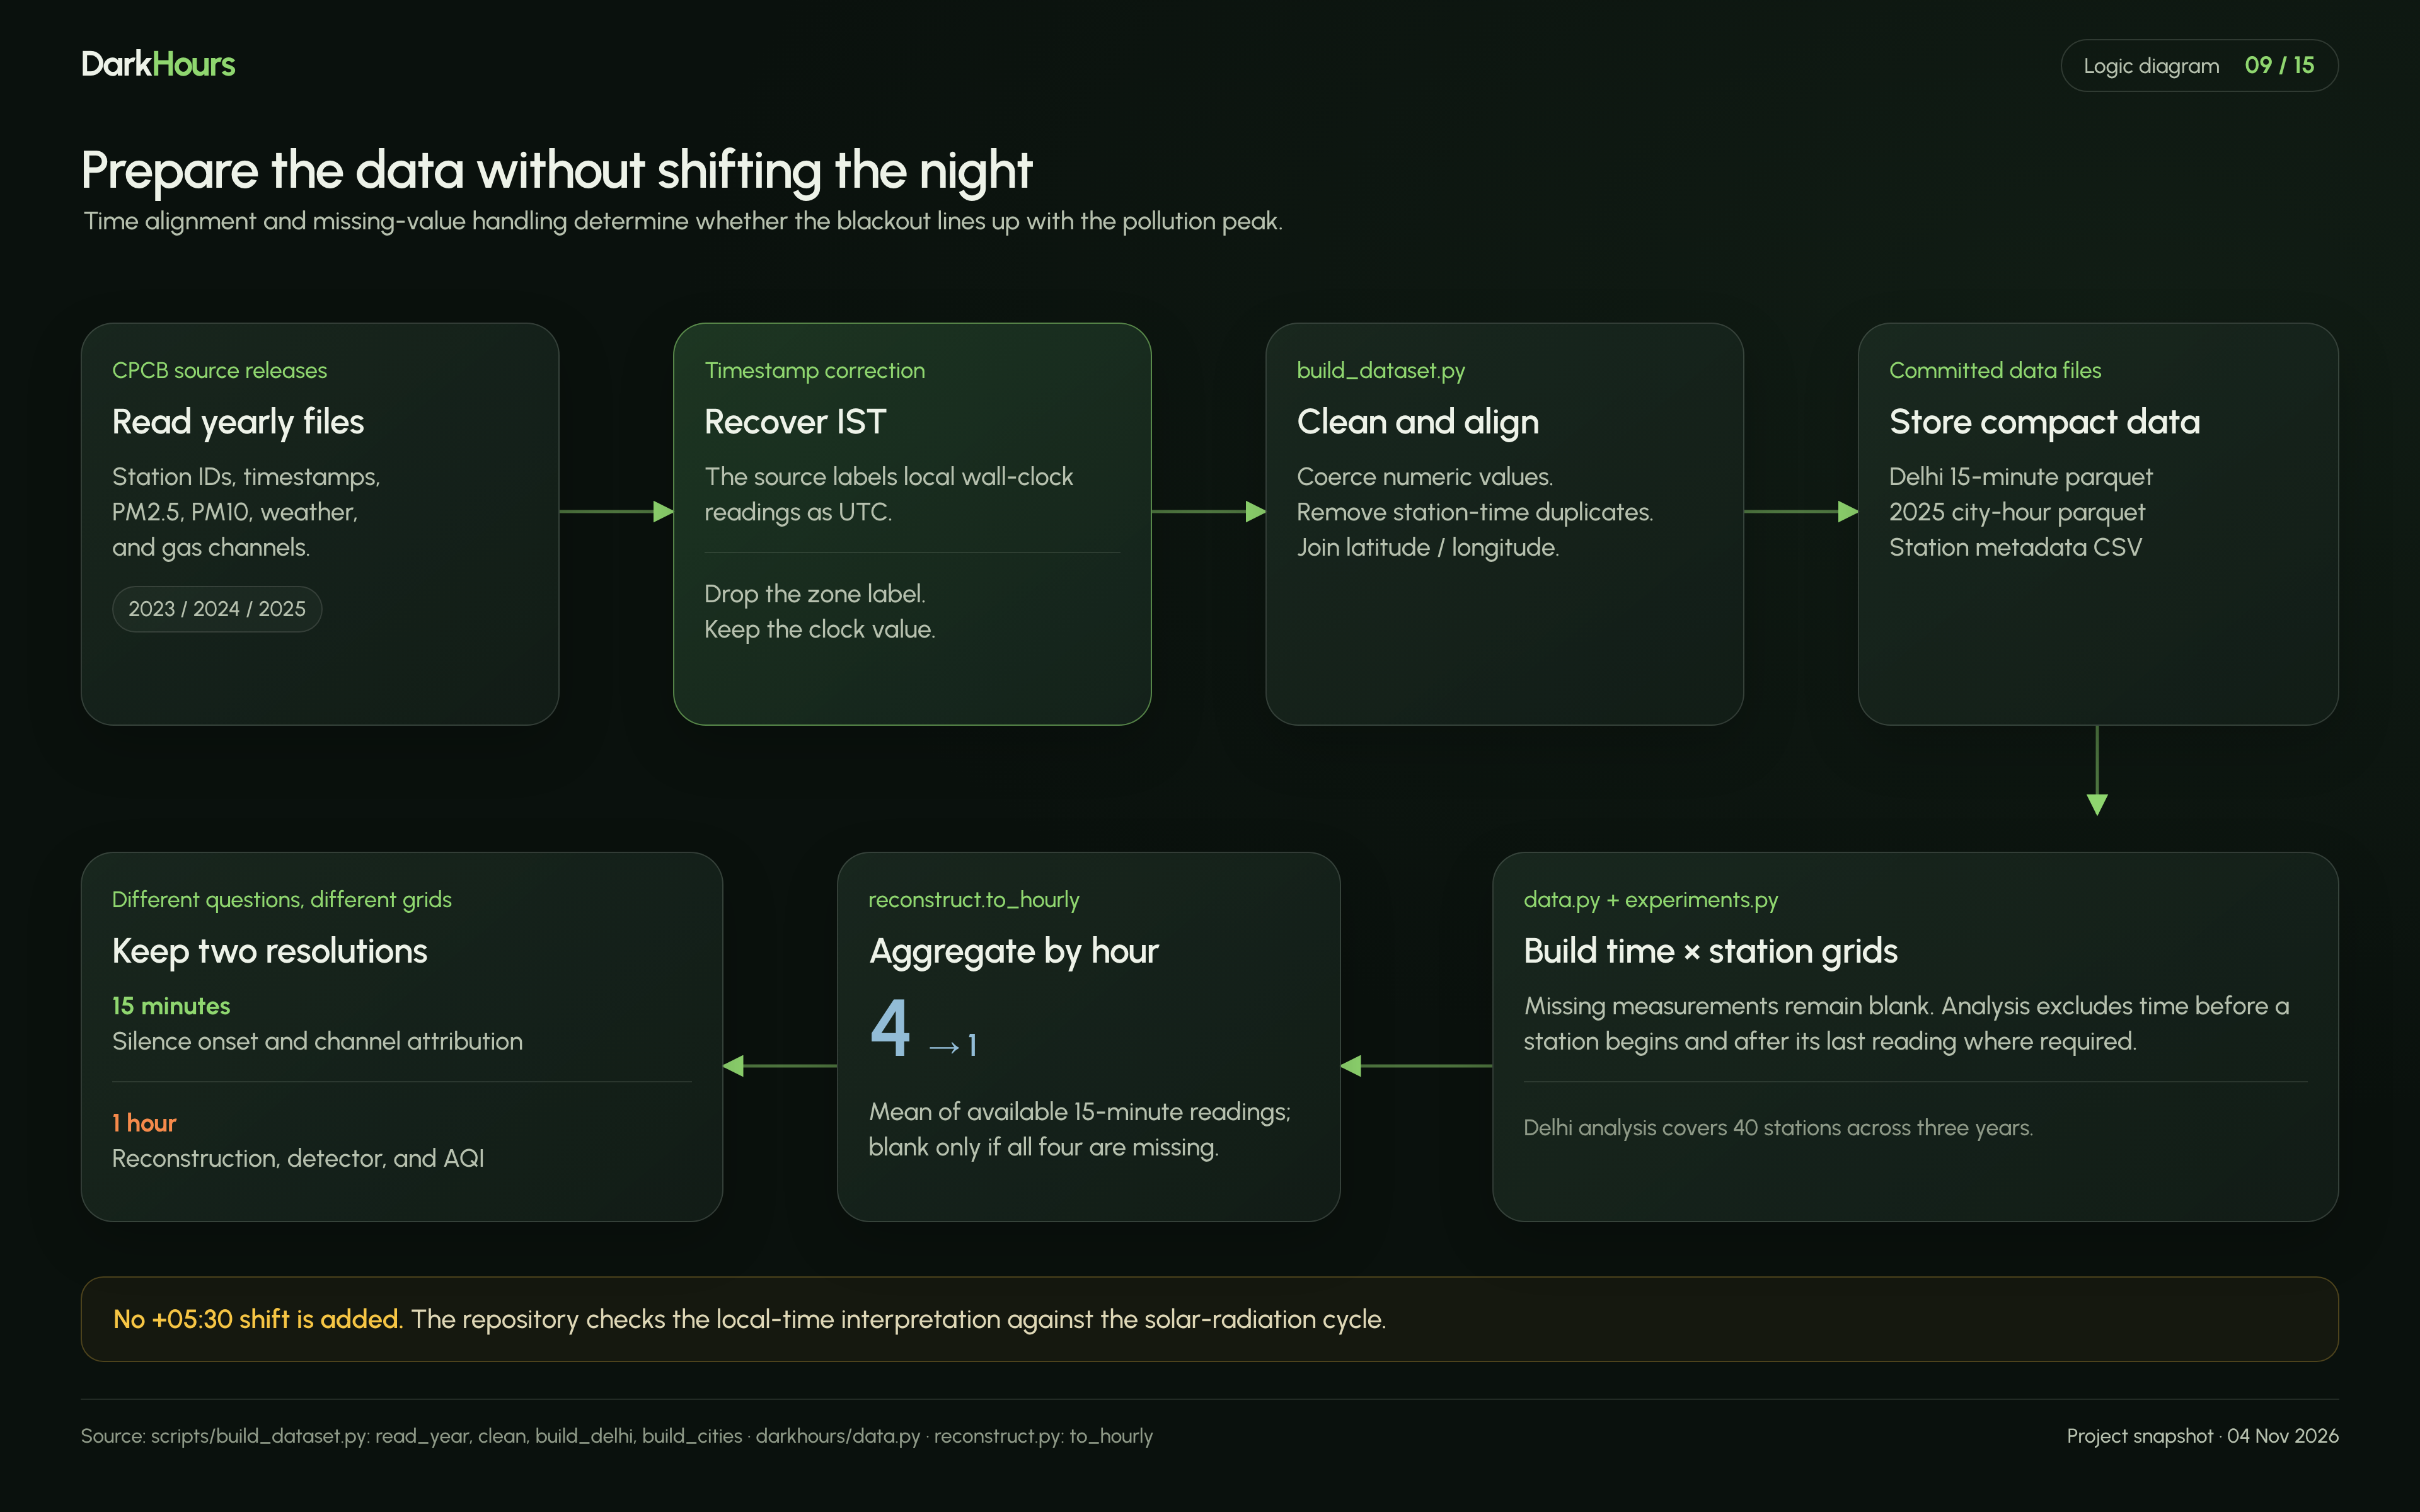
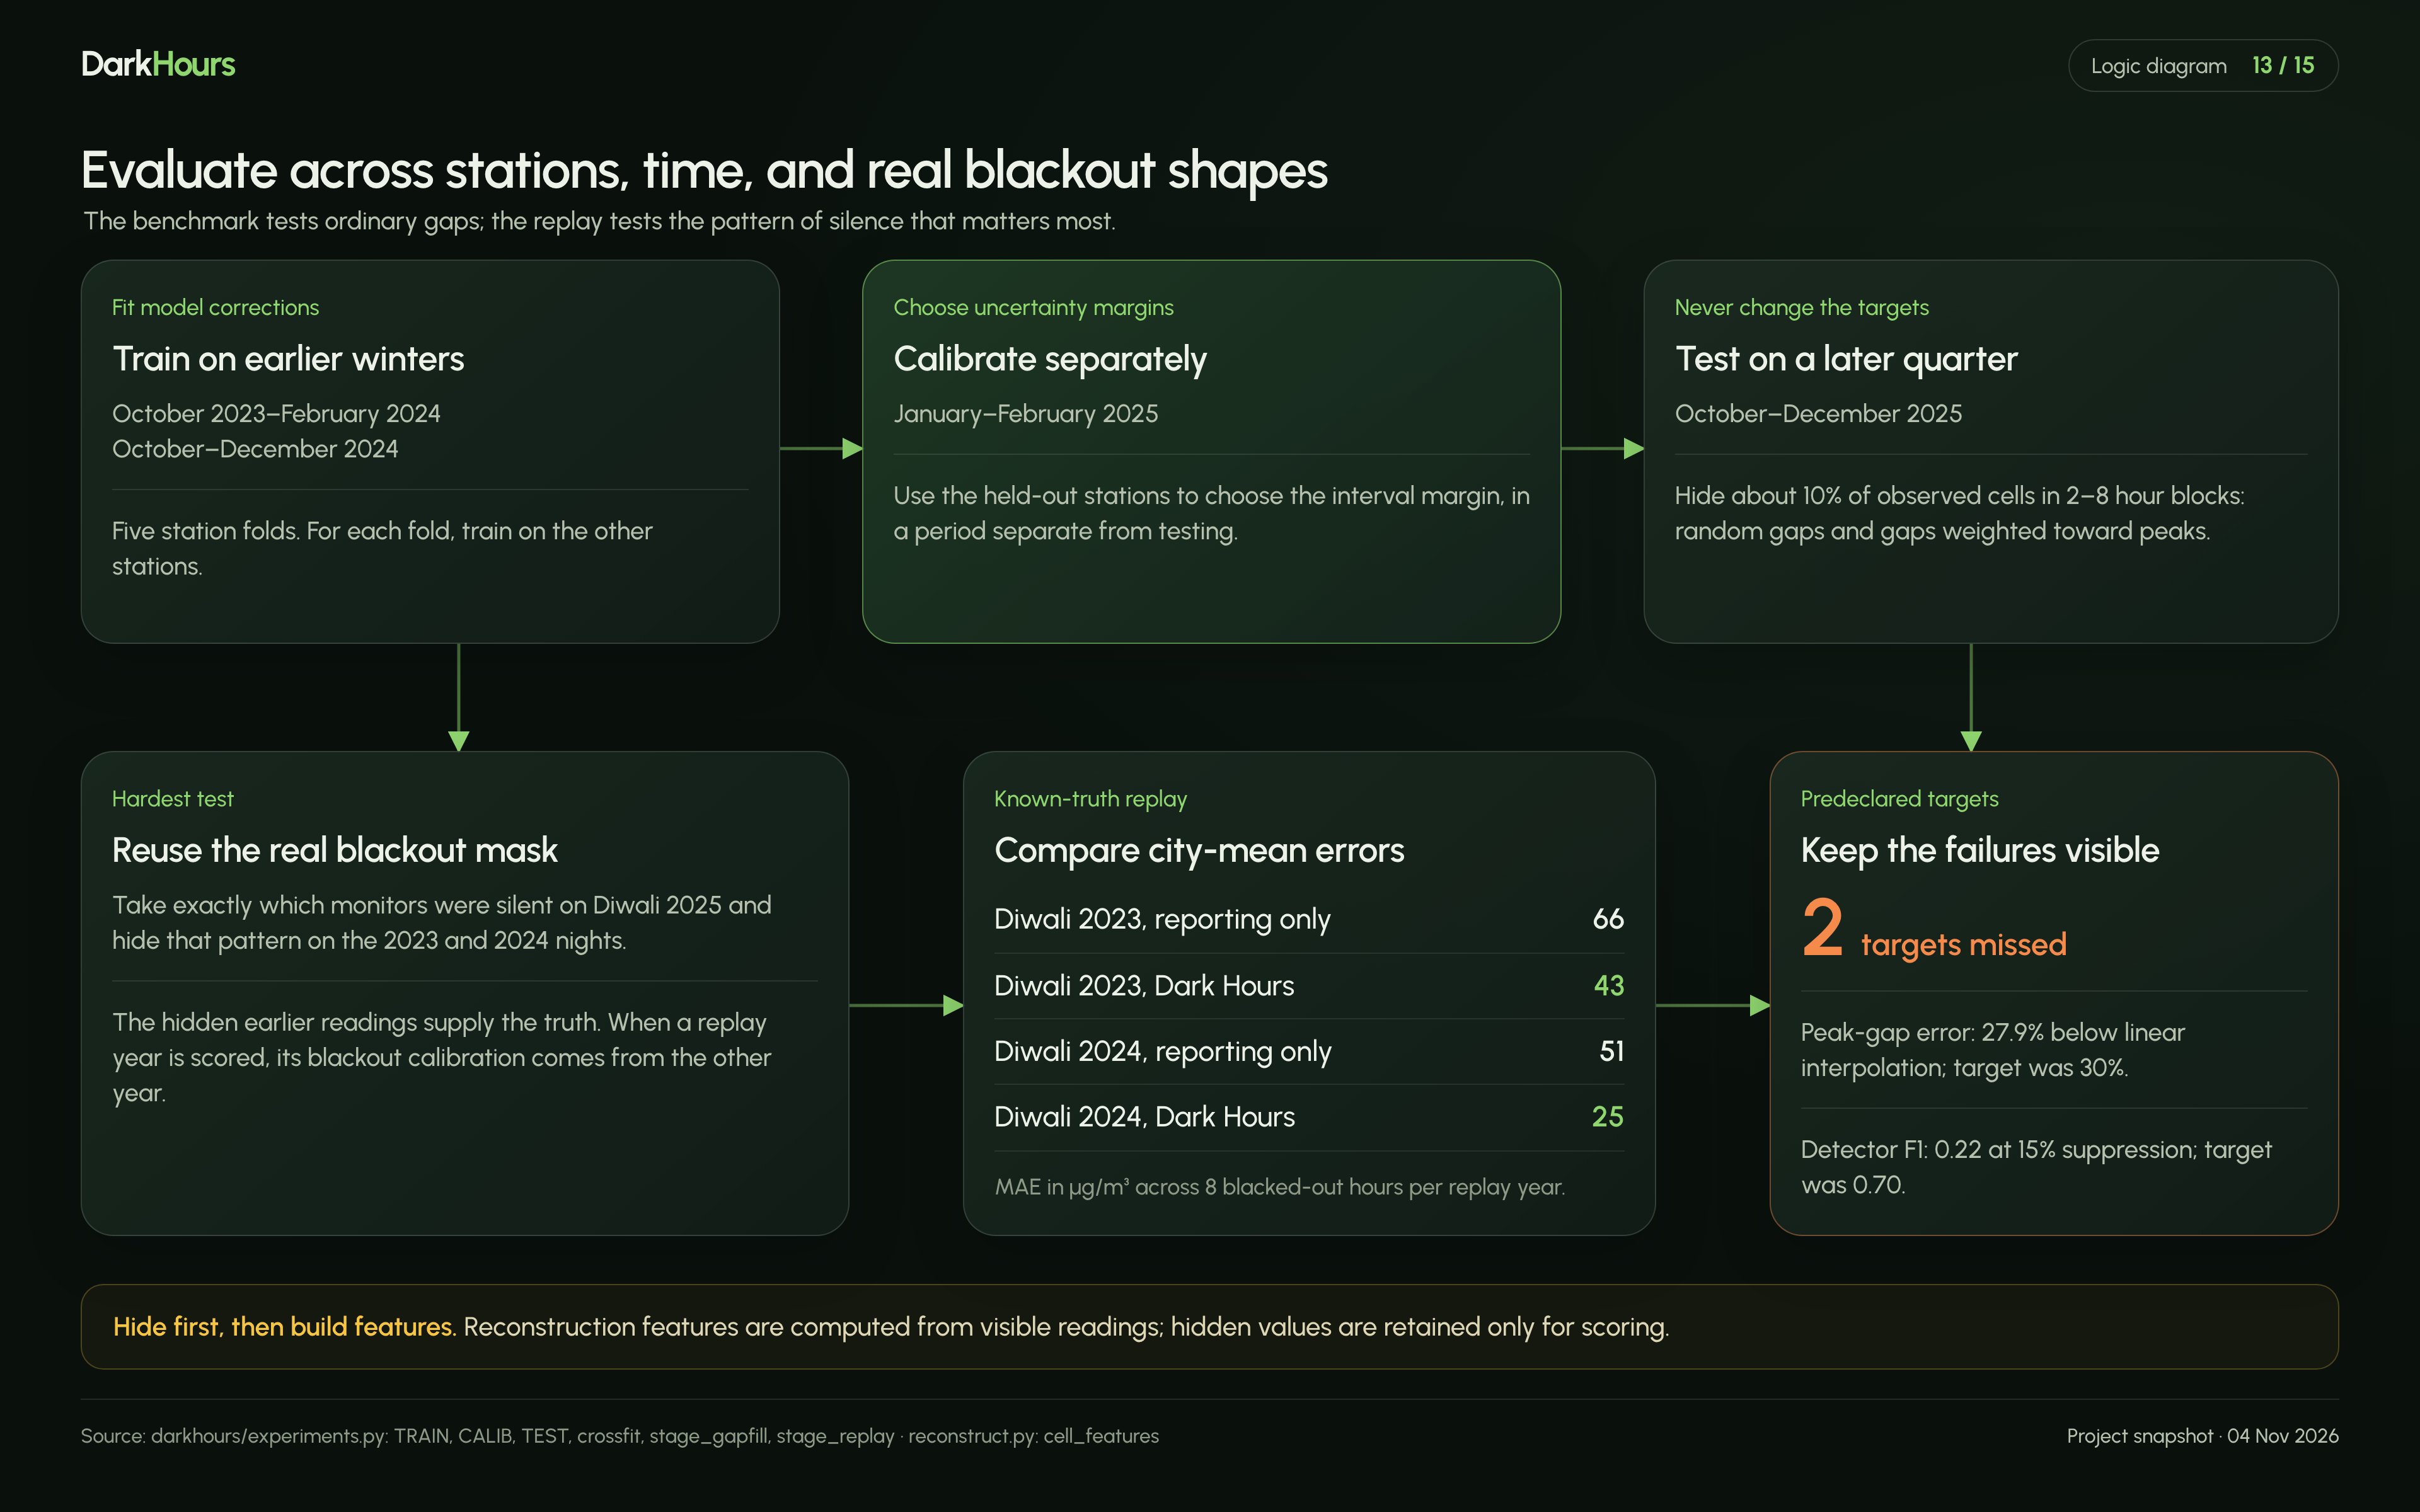
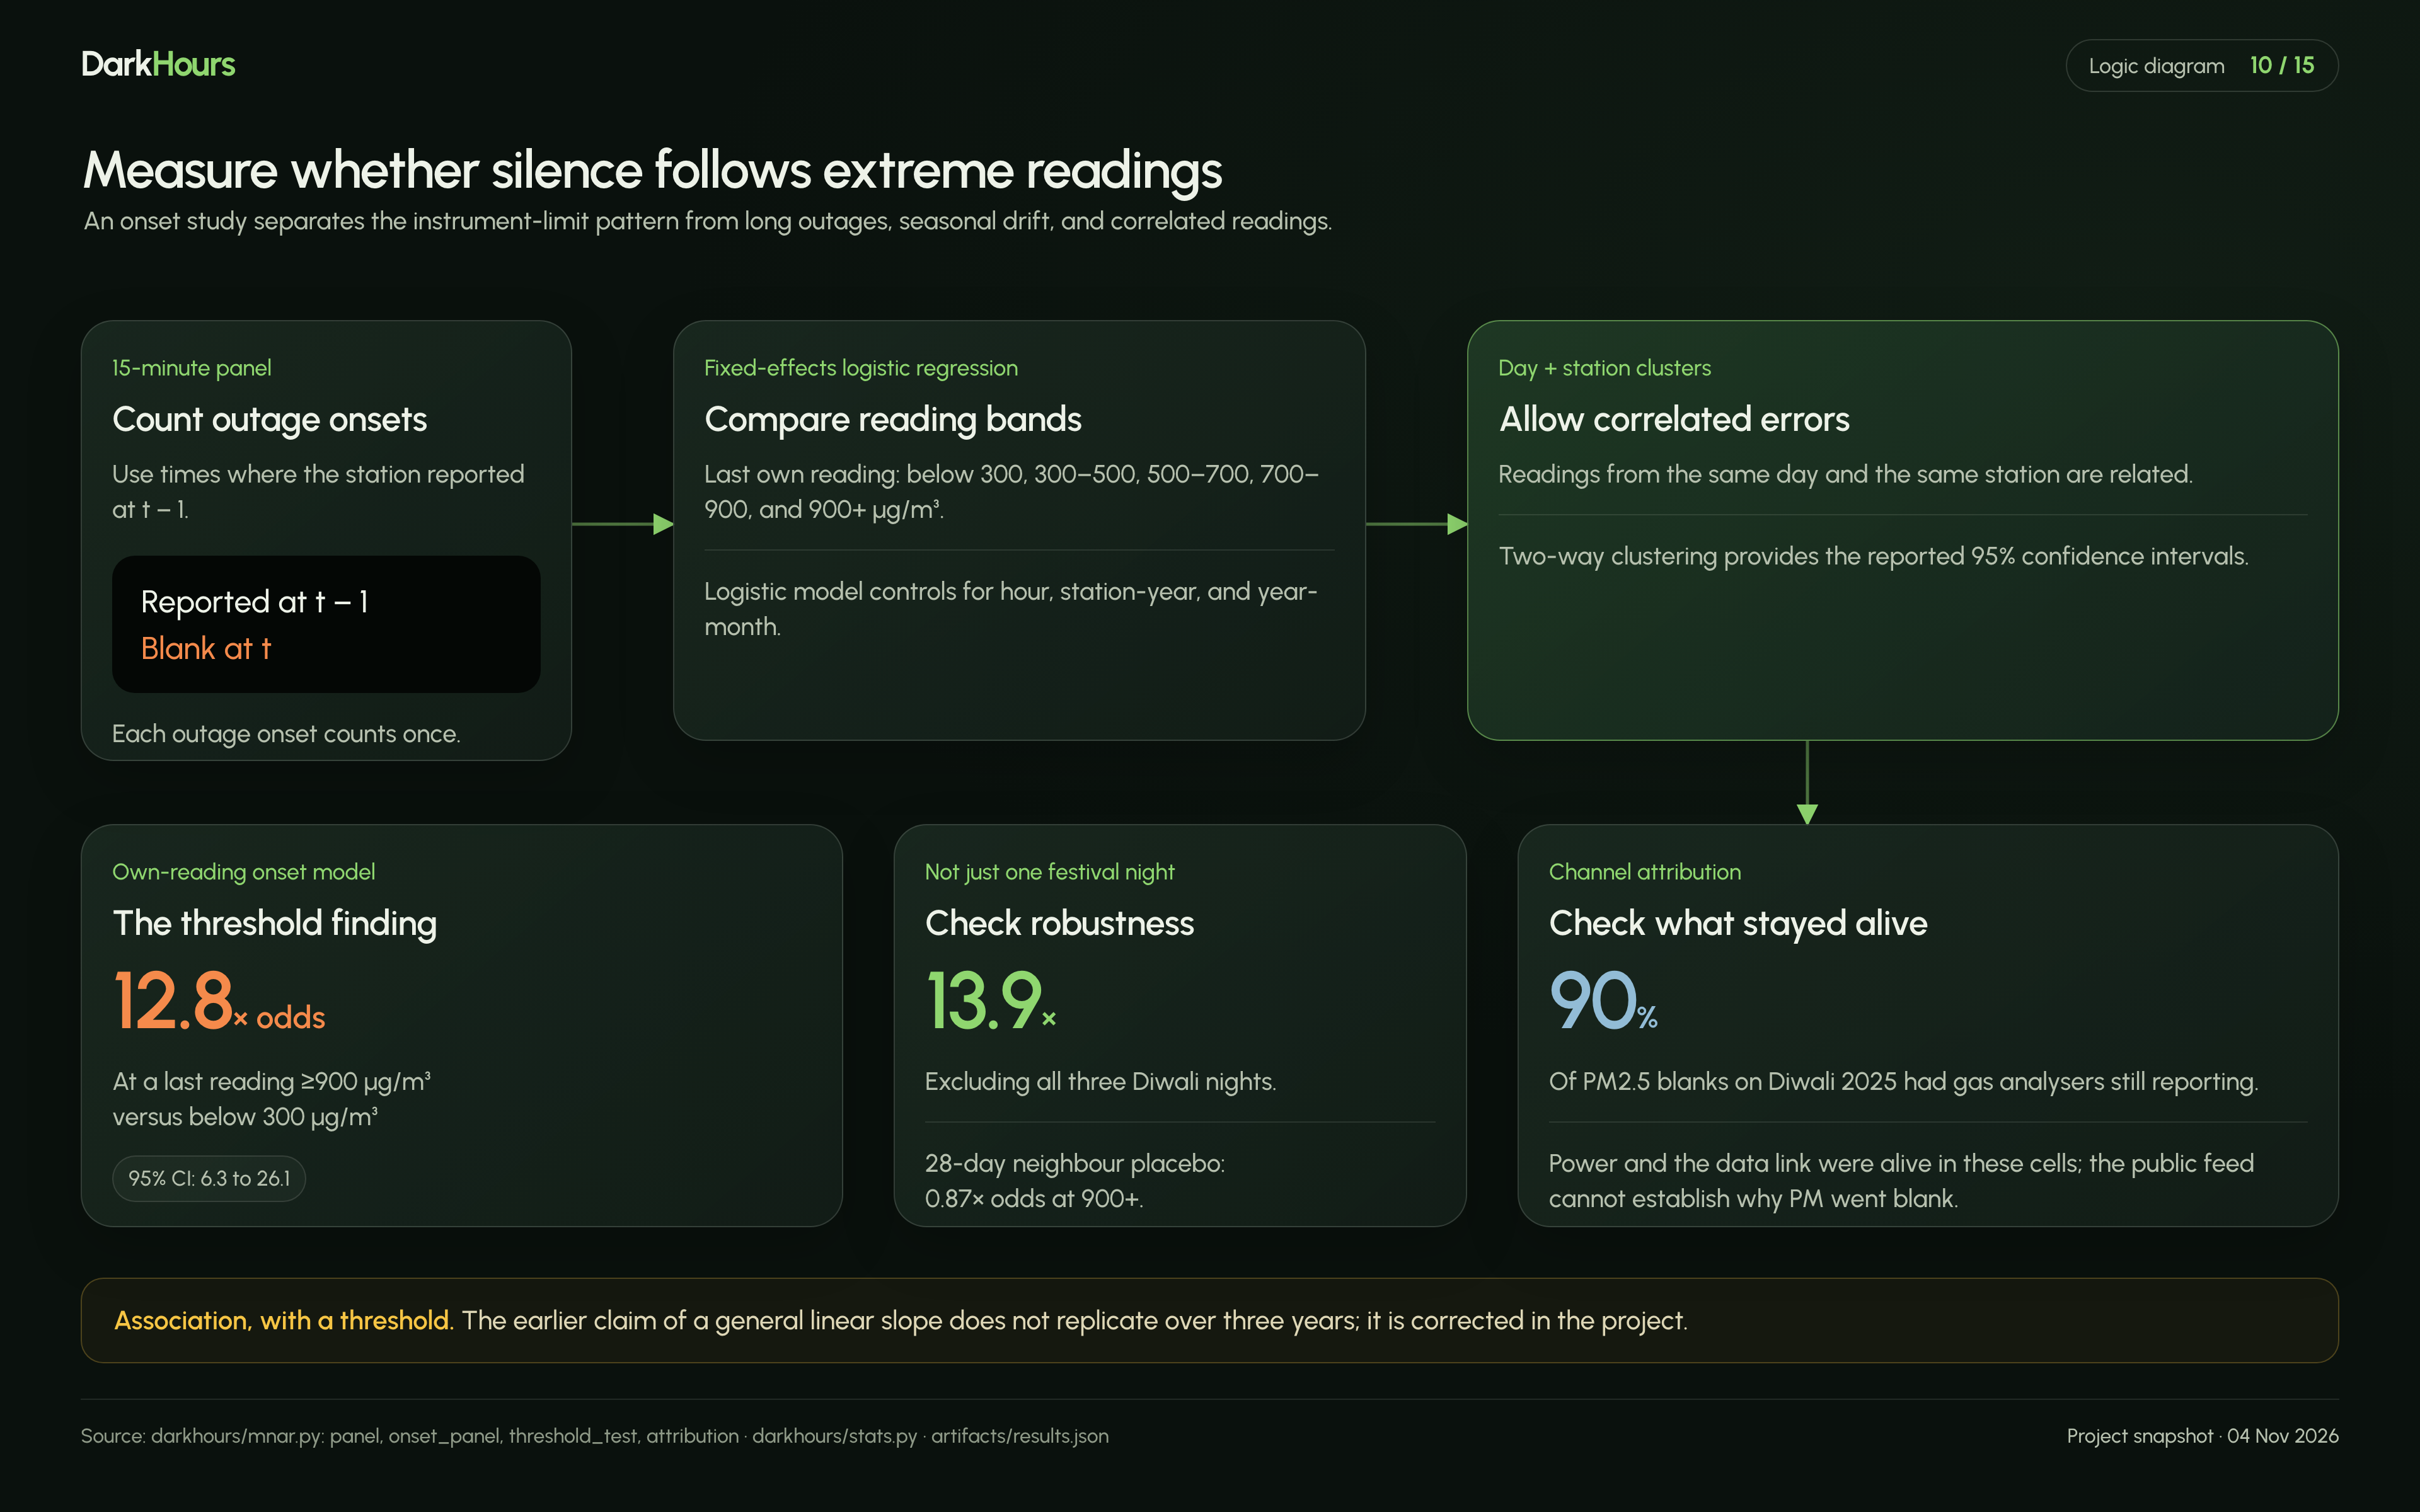
Clean the record. We process 4,105,061 readings across 40 stations from 2023 to 2025. The source labels IST values as UTC, and a test now guards that fix. Measure the silence. A monitor whose last reading was 900 µg/m³ or more had 12.8 times the odds of going silent in the next 15 minutes (95% CI 6.3 to 26.1). It isn’t a slope: there is no rise from 300 to 700, then a cliff. See what went dark. In 90% of PM2.5 blanks on Diwali 2025, the station’s gas analysers kept reporting, so its power and data link were alive. Fill the gaps. We combine each monitor’s offset from its neighbours, a quantile gradient-boosting model, and conformal and blackout calibration. Replay the blackout. We hid 2025’s exact silence pattern on Diwali 2023 and 2024, where the readings are known. City-mean error fell by 36% and 51%. Check the official number. Our replica of CPCB’s AQI formula moves from 360 to 381 with gaps filled. The scale saturates at 500, which limits how far gaps can move it. Look for inconsistent readings. A detector flags daytime PM10 dips that neighbouring monitors and PM2.5 don’t share. This matters because sprinkling near monitors has been reported.
How we built it
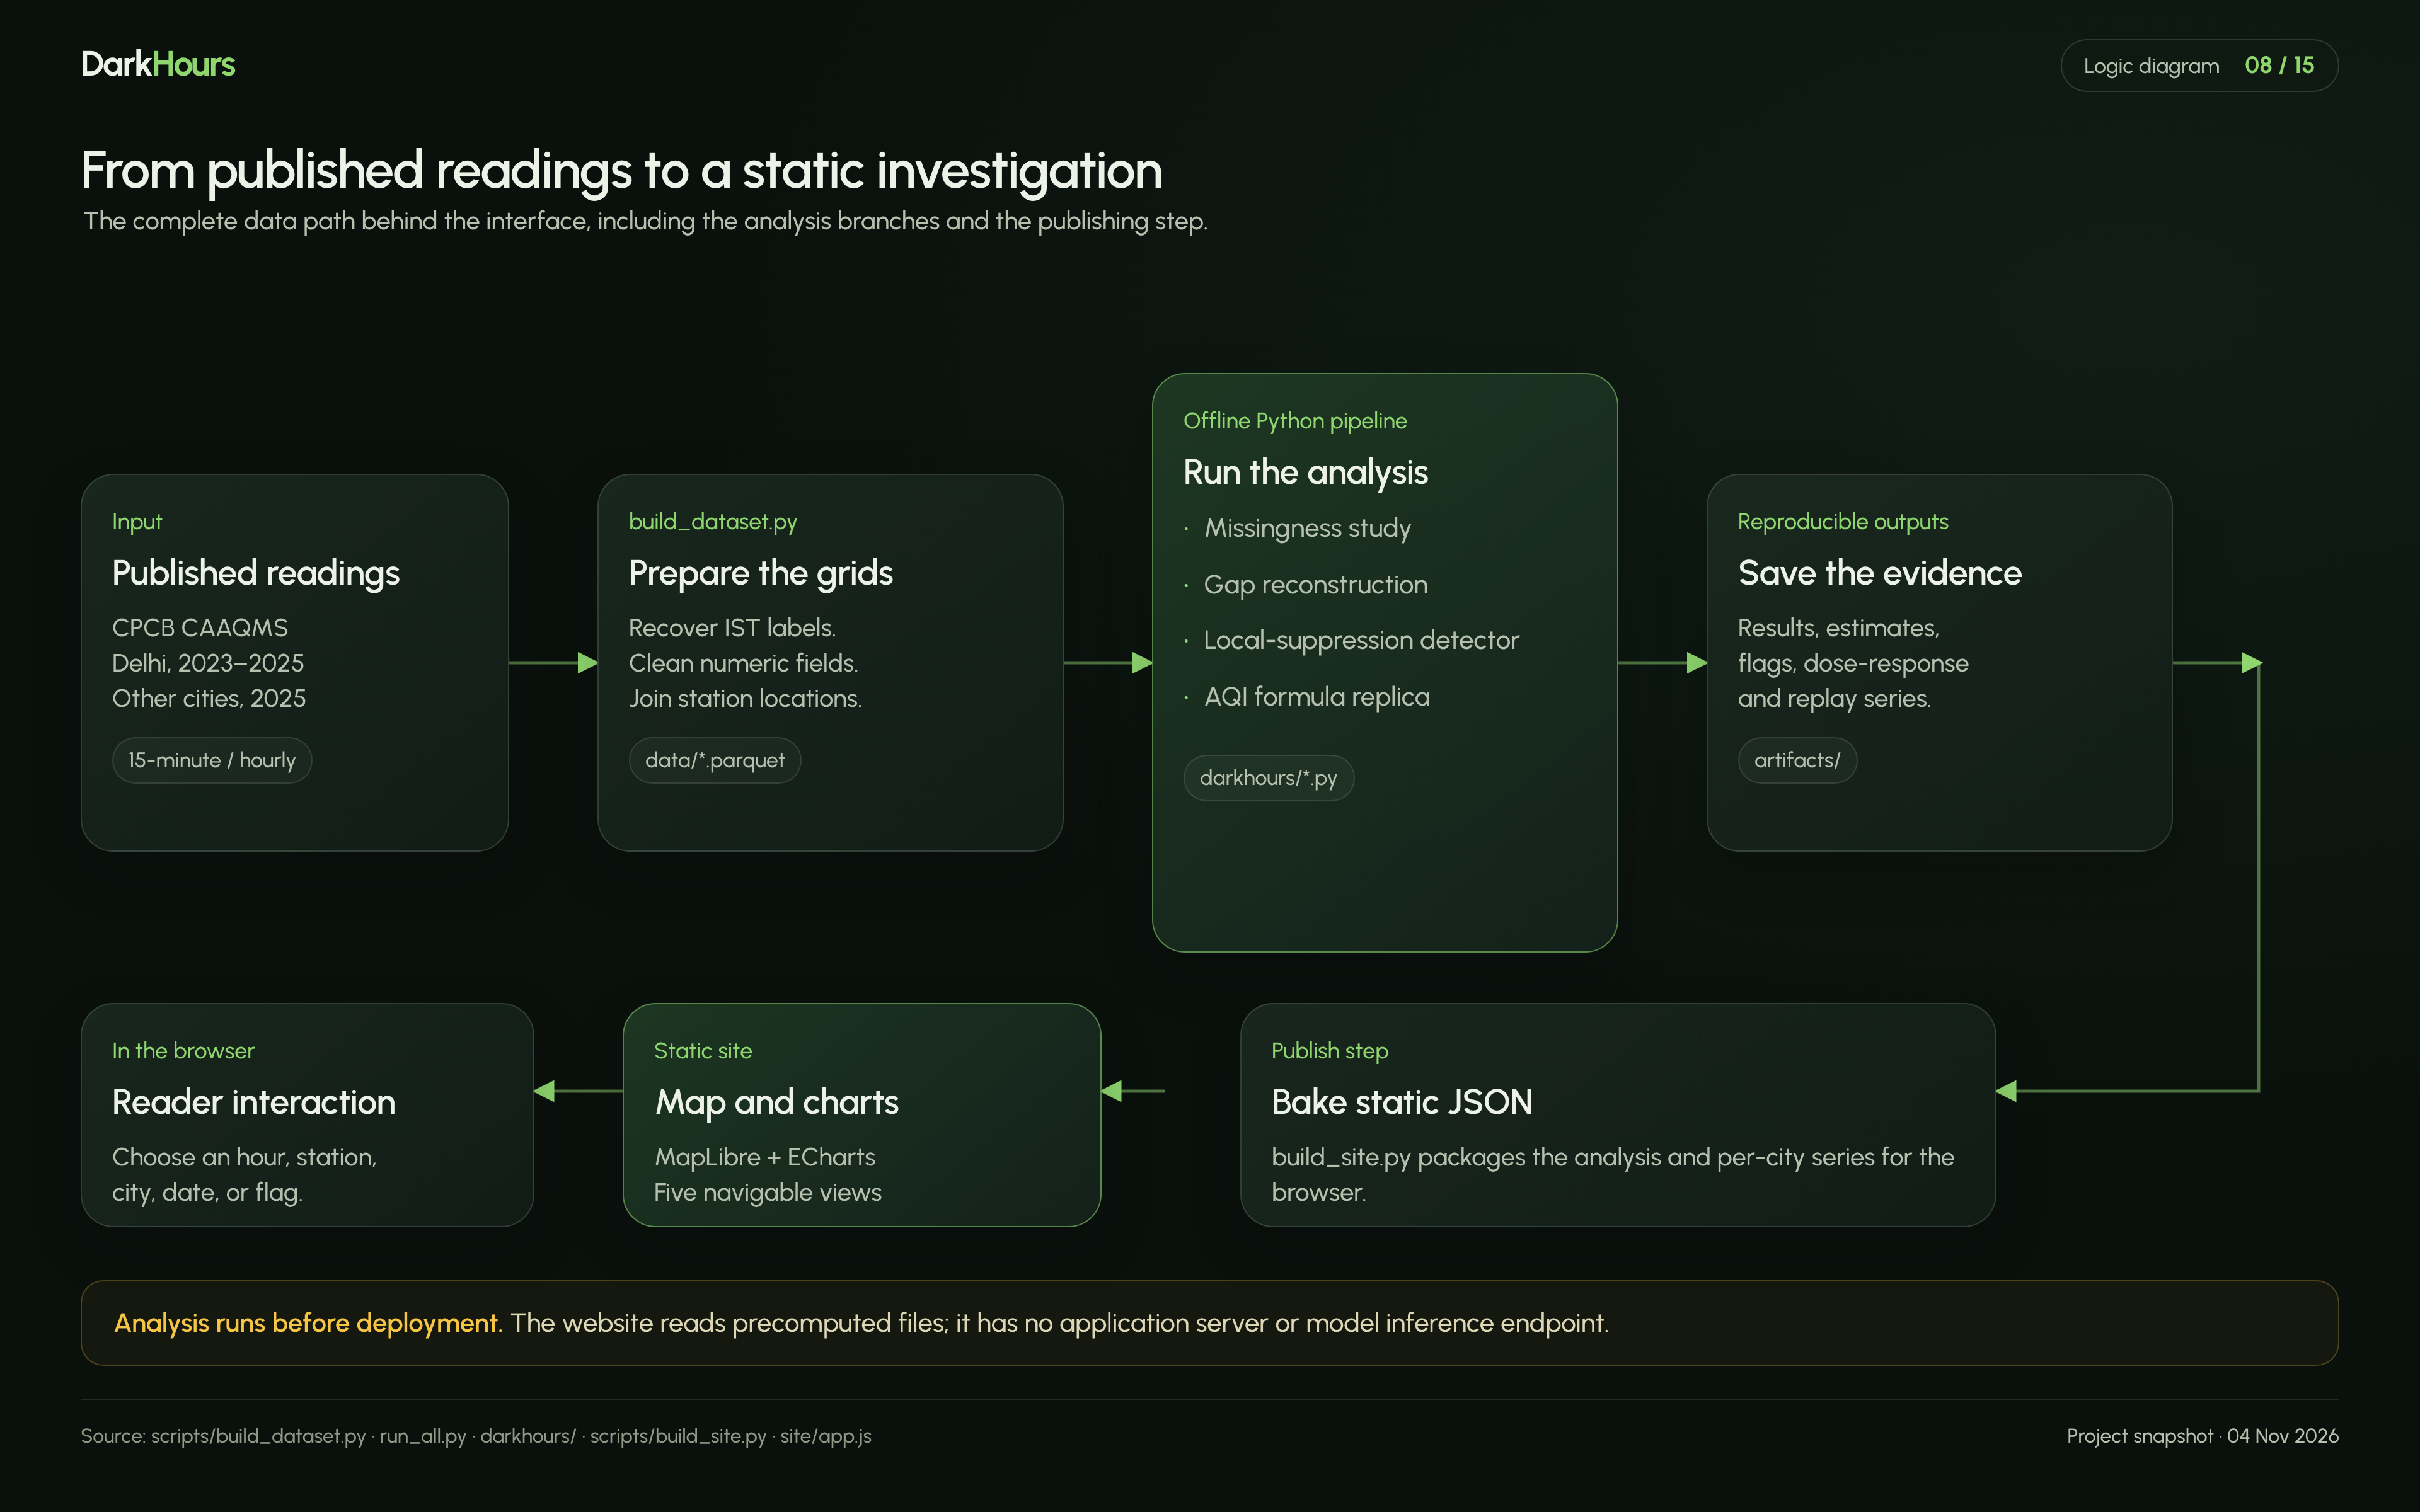
Pipeline (Python). Models train on earlier winters and other stations, then are tested on Oct to Dec 2025. Everything lands in artifacts/, and the README is generated from those results, so its numbers can’t drift from them.
Site (static). scripts/build_site.py bakes the results into JSON. MapLibre draws a full-page map, ECharts draws the charts, and light and dark themes are built in. There is no server and no cold start.
Authority split.
Reported values stay as published. Estimates always carry an interval. A flag is a prompt to look, never a finding.
What is measured and what is estimated
Measured: reported readings, silence rates, and which channels went dark. Estimated: values for silent monitors, and the AQI with gaps filled. Orientation only: the map shading, which just interpolates between monitors. Out of reach: the cause. Public data can’t separate instrument limits, quality filters and deliberate action, so we take no side.
Challenges
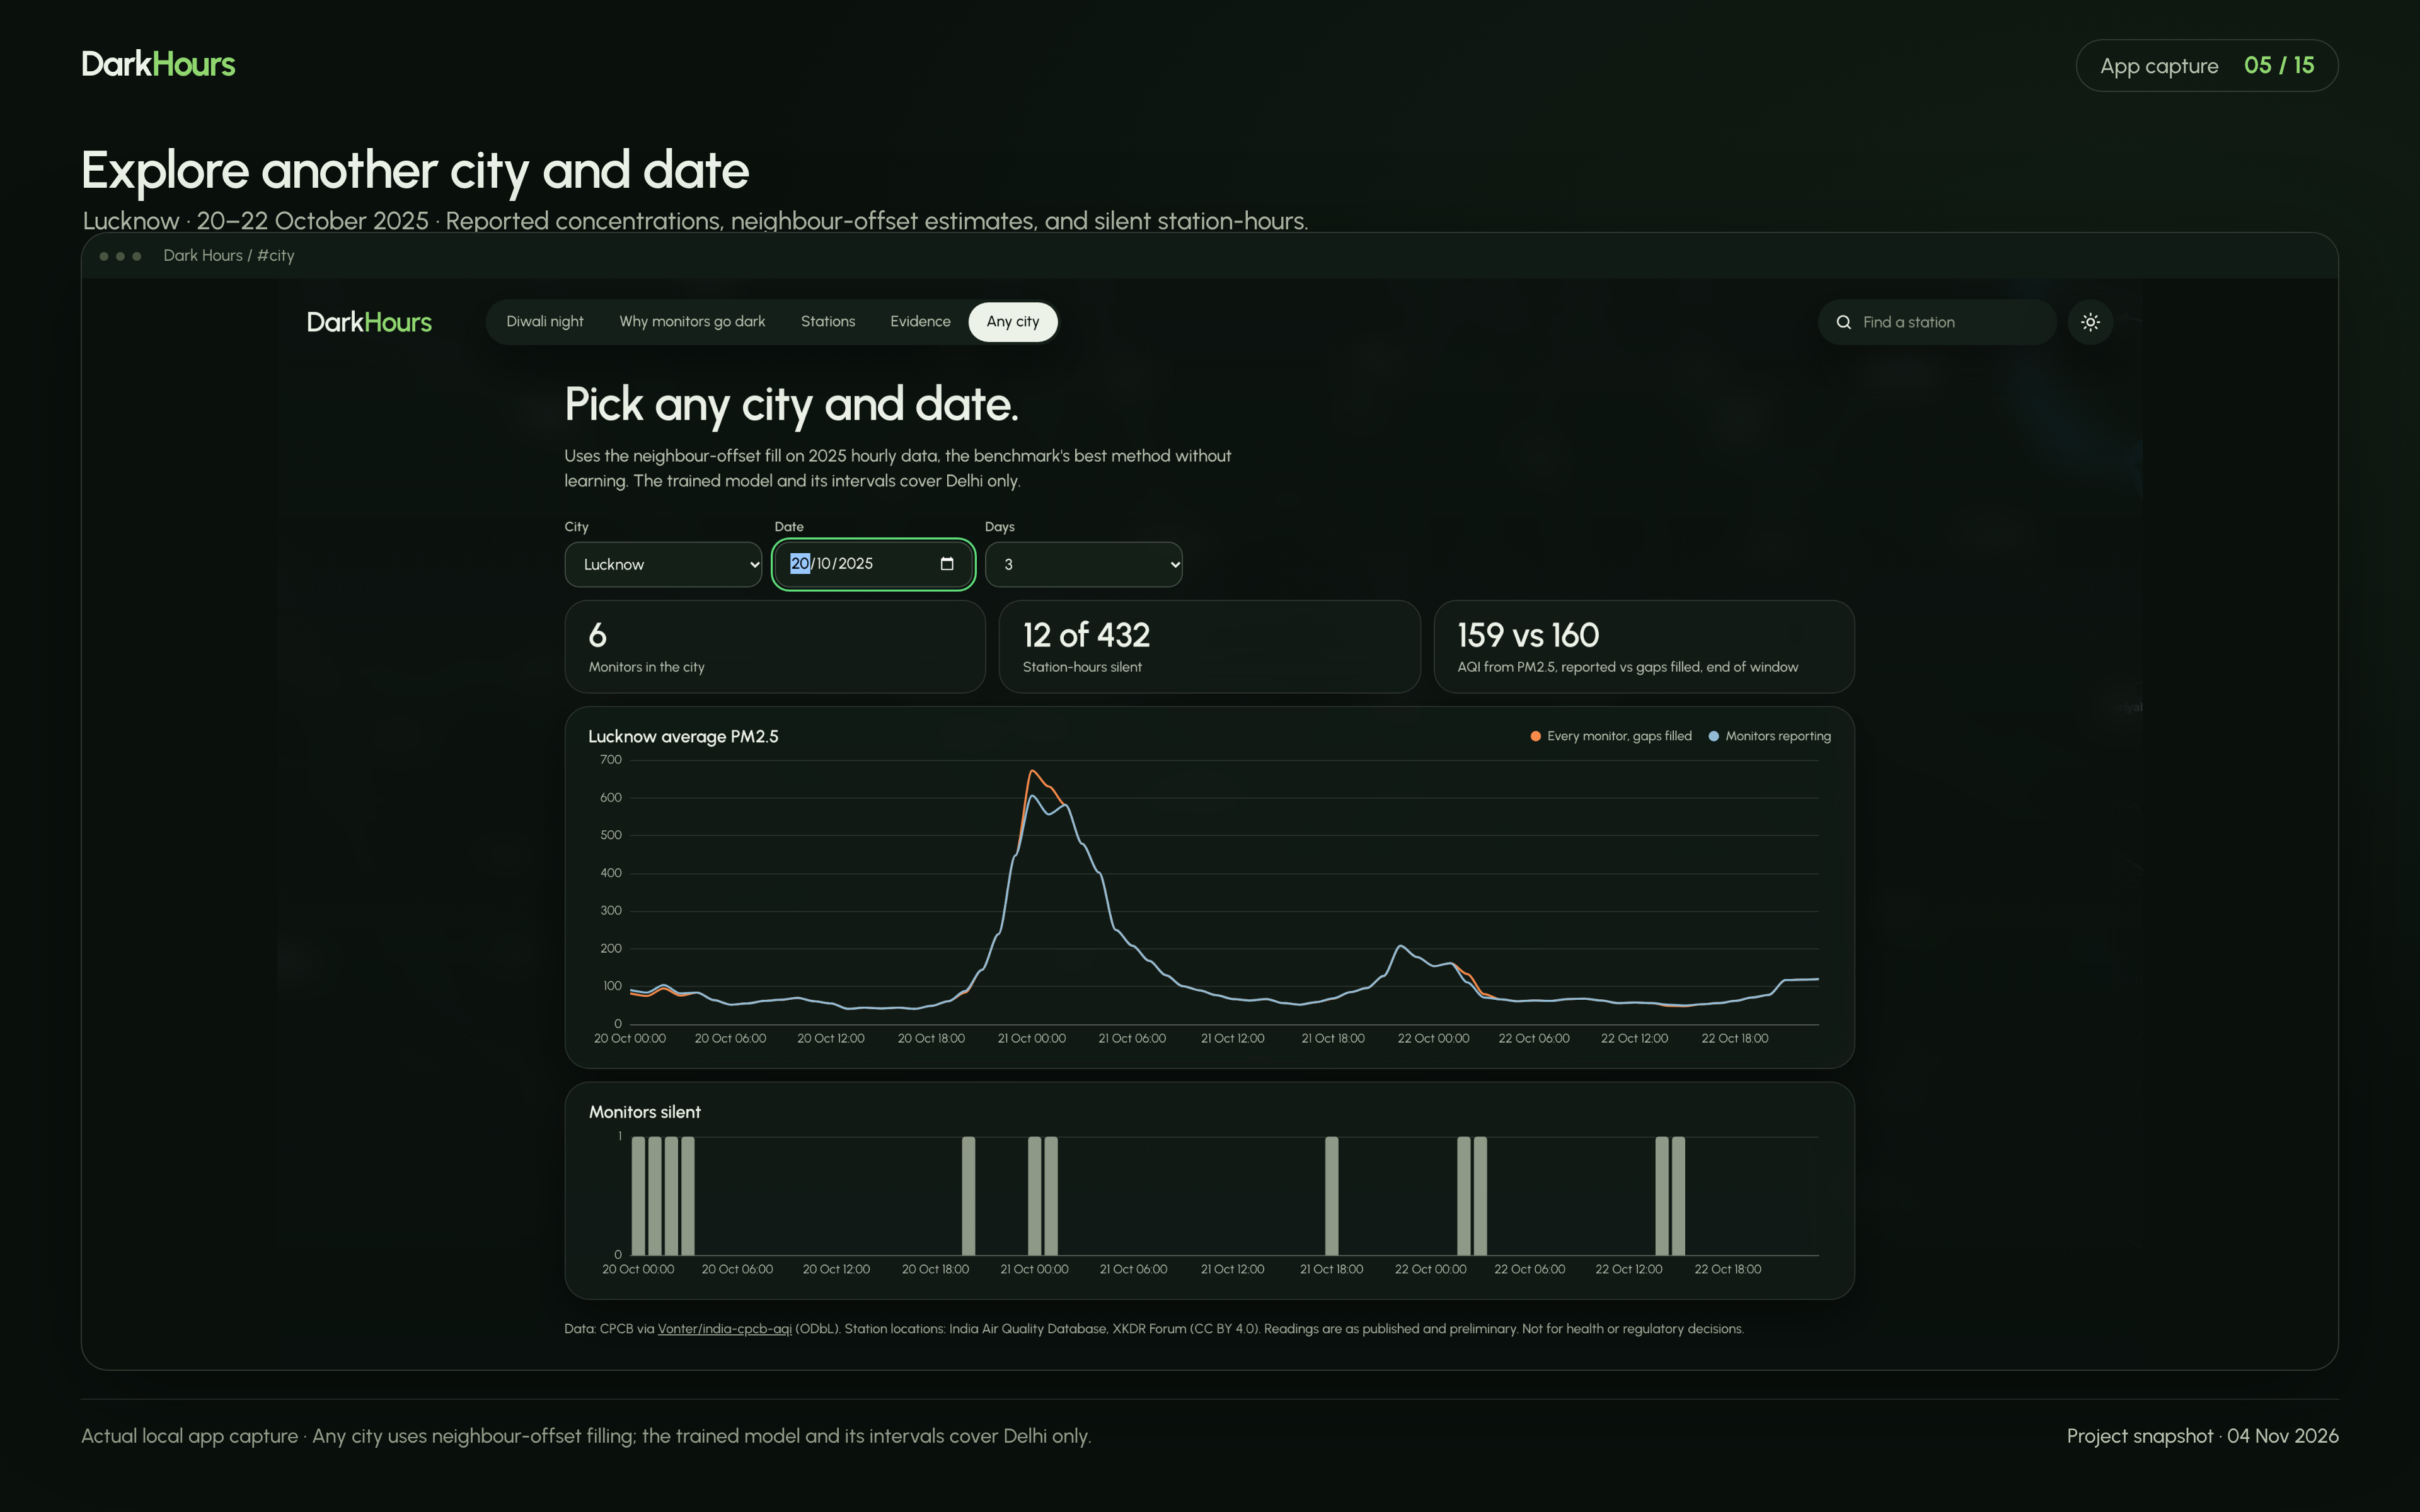
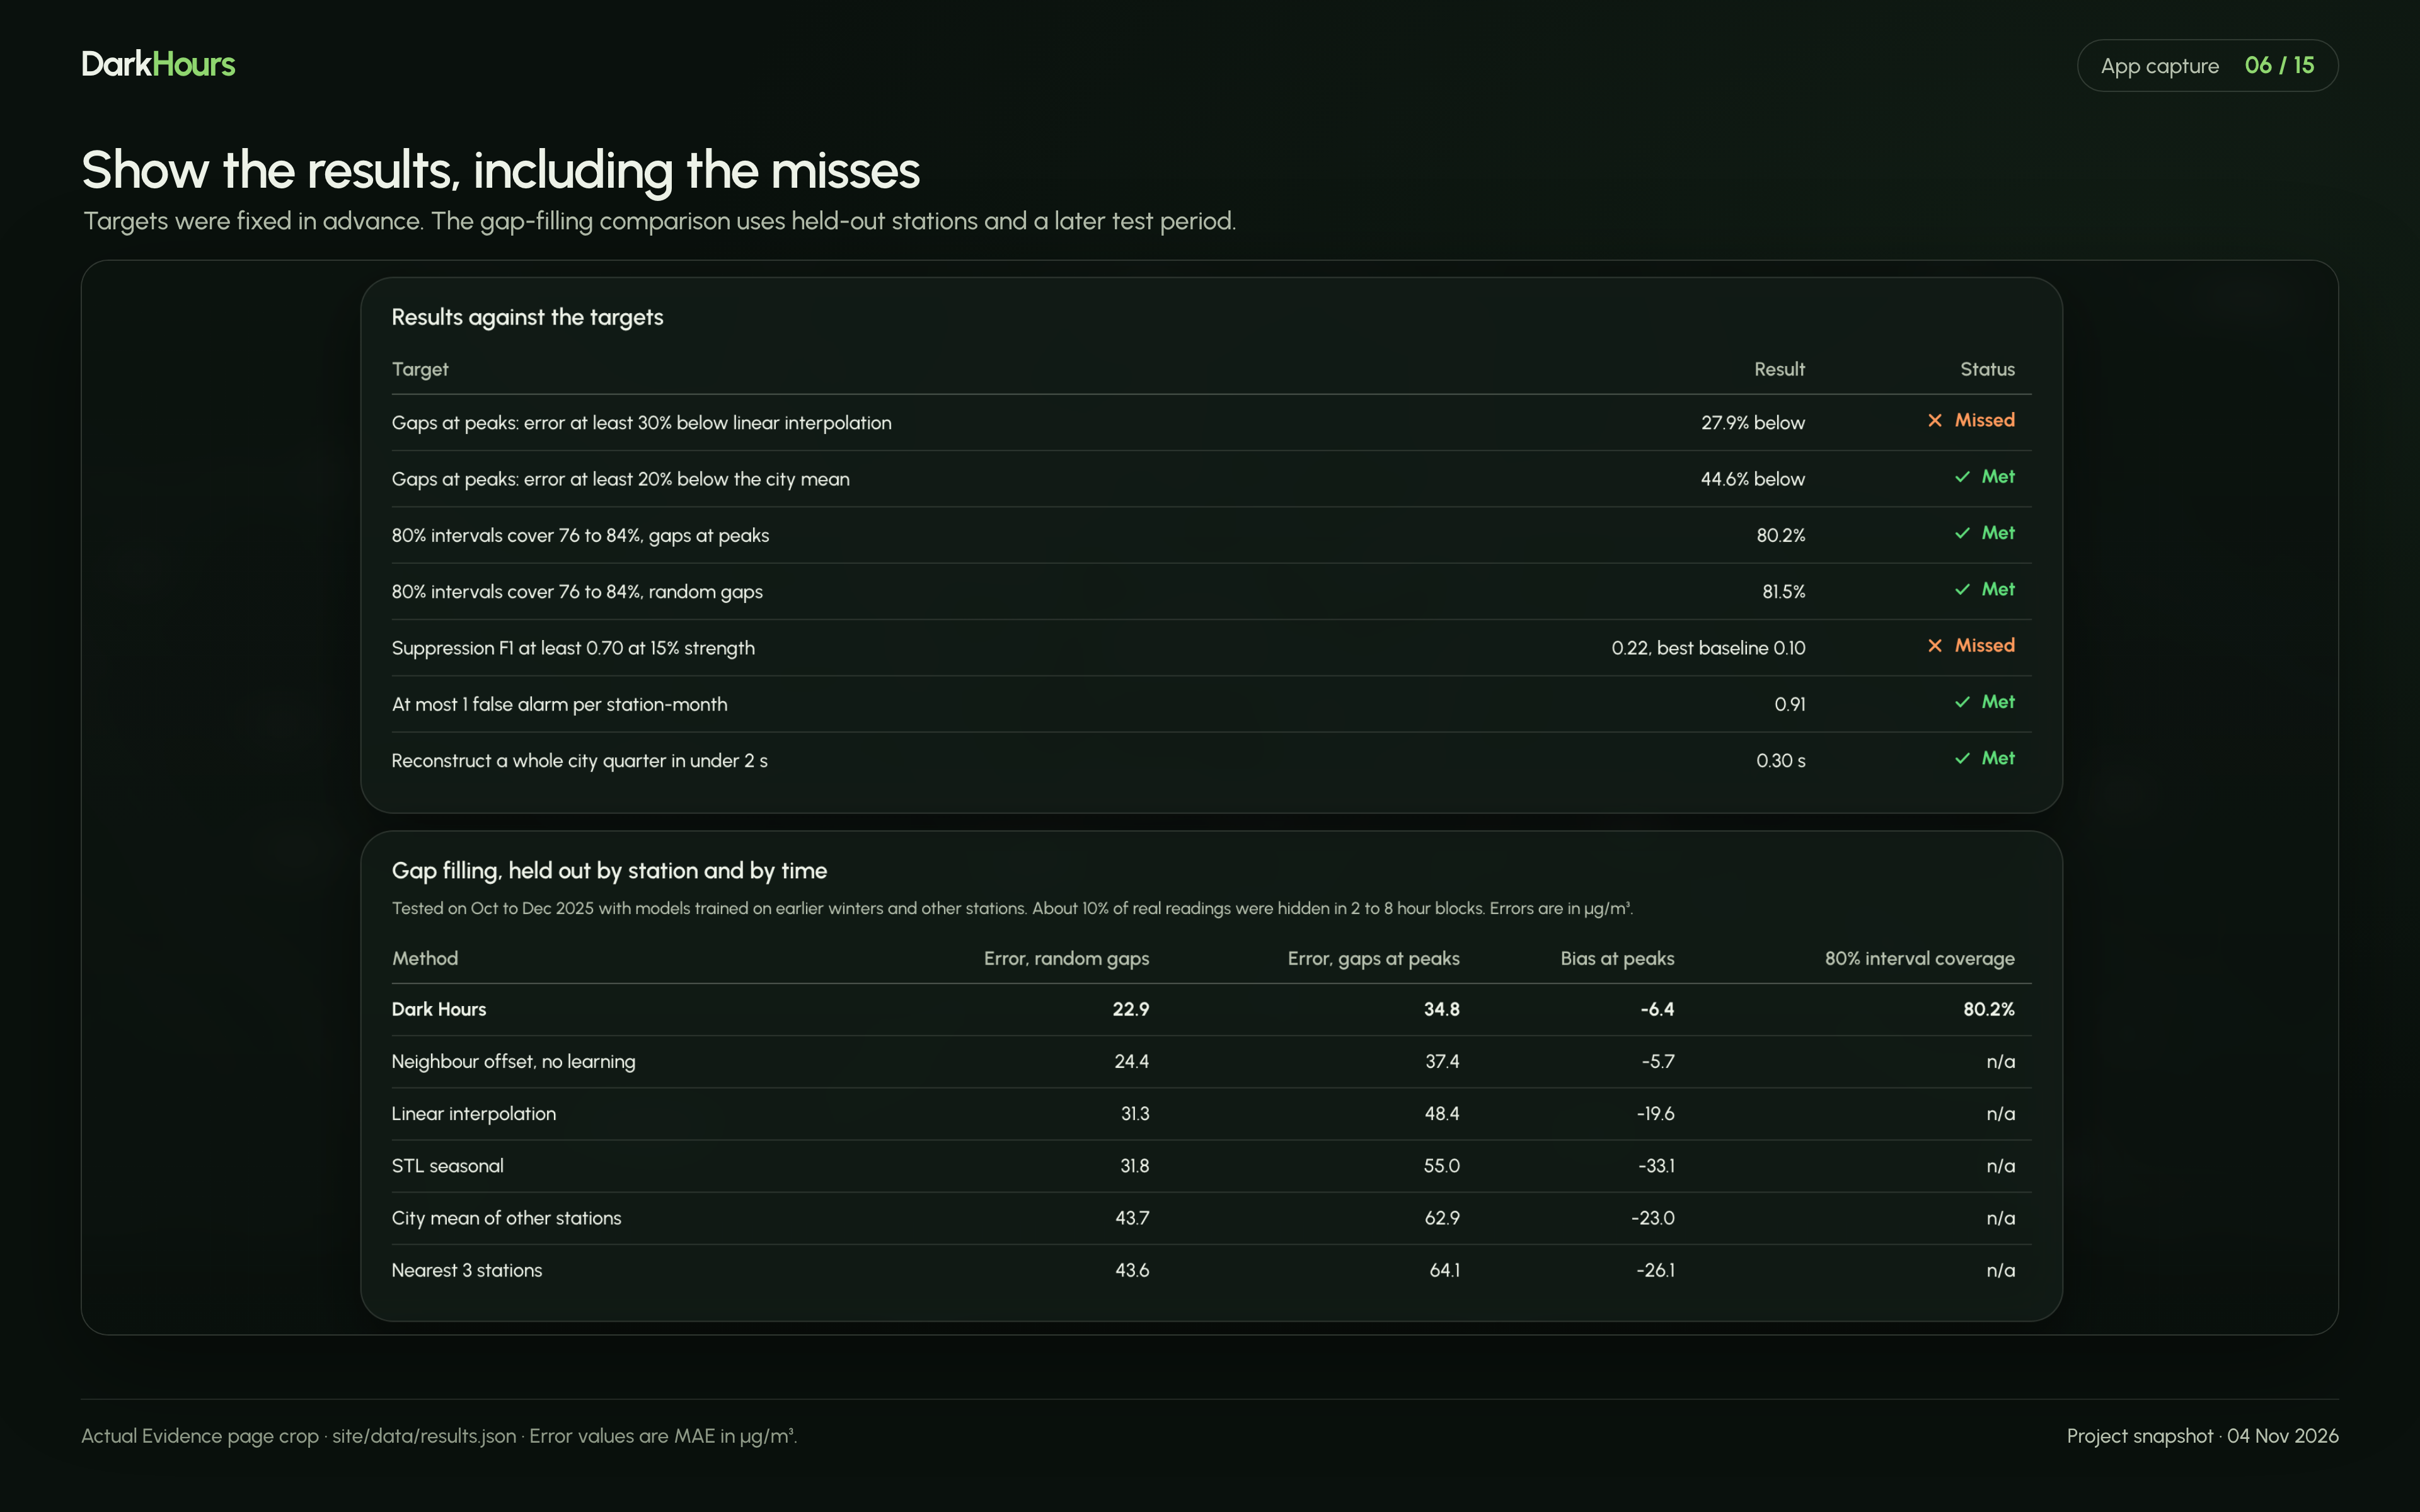
Our own headline failed. An early claim of 1.69 times more silence per +100 µg/m³ came from one week. Over three years it fell to 0.95 (0.84 to 1.08), so we published the correction. Simple methods nearly won. The neighbour offset, with no machine learning, is only 2.6 µg/m³ behind the model. Calibrated intervals are the model’s main advantage. Extreme nights are hard to validate. Replays ran low, and 80% intervals covered only 56% and 75% of cases. The 2025 estimate is more likely low than high. Silence hits the instrument’s limit. Around 1 am, most silent monitors are estimated near 1,000 µg/m³, the most the feed ever reports.
Accomplishments
Found the silence cliff, and it holds without the Diwali nights (13.9 times) and shows no rise in a placebo test (0.87). Calibration lifted interval coverage from 74.2% to 80.2% on gaps at peaks, against a target of 76 to 84%. Met 5 of the 7 targets set in advance, and left the two misses as they are: Error at peaks came in 27.9% below linear interpolation, against a 30% target. Detector F1 reached 0.22, against a 0.70 target. The best baseline got 0.10. Showed the pattern extends beyond Delhi: across 29 other cities, the odds were 6.0 times higher when neighbours read above 500 µg/m³. What we learned
The most useful thing a model did here was show how wrong it could be. And an honest “we can’t tell” was often the strongest claim the data supported.
What’s next
Replay more extreme nights to tighten the intervals where they fall short. Train the model outside Delhi, since other cities currently get the neighbour method without intervals. Use independent sensors to check values at the instrument’s limit, which the feed itself can’t show. Improve the detector at realistic dip sizes, where it is weakest.
Try it: https://dark-hours-site.onrender.com Code: https://github.com/rahulgunwanistudy-2005/DarkHours
Readings are as published and preliminary. Not for health or regulatory decisions.
Built With
- echarts
- javascript
- maplibre-gl
- numpy
- pandas
- pyarrow
- python
- scikit-learn
- statsmodels
